ABSORPTION SPECTRA ANTD PHASE TRANSFORMATIONS OF MINERALS AT PRESSURES UP TO 200 KILOBARS
by
RATEB M. ABU-EID
B.Sc.(Hons), Alexandria University 1968
SUBMITTED IN PARTIAL FULFILLMENT OF THE REQUIREMENTS FOR THE
DEGREE OF DOCTOR OF PHILOSOPHY at the MASSACHUSETTS INSTITUTE OF TECHNOLOGY January, 1975 Signature of Author
Department of Earth and Planetary Sciences, January 27, 1975
Certified by
Thesis Supervisor
Accepted by
c1
-2-ABSTRACT
HIGH PRESSURE ABSORPTION SPECTRA AND PHASE TRANSFORMATIONS OF MINERALS AT PRESSURES
UP TO 200 KILOBARS
by
Rateb M. Abu-Eid
Submitted to the Department of Earth and Planetary Sciences on January 27, 1975 in partial fulfillment of the
requirements for the Degree of Doctor of Philosophy
The absorption spectra of minerals containing a variety of transition metal ions were investigated at pressures ranging from 1 atm. to 200 kb. using the Cary 17 spectrophotometer with a newly designed optical microscope attachment and the diamond anvil pressure cell. The general results indicate that with
increasing pressure, spin-allowed crystal field bands shift to higher energies, whereas charge transfer bands shift to lower
energies; spin-forbidden bands, on the other hand, did not show any significant shift. The rate of the energy shift (cm-l/kb.) varies from one band to the other depending on the nature of the transition metal ion and the coordination site symmetry. From the high pressure spectra, energy level diagrams were constructed at elevated pressures. Such diagrams provided the energy values of the crystal field splitting, 1ODq, and the crystal field
stabilization energy, CFSE, parameters at various pressures. The site compressibilities of Fe2+, Mn3+, and Cr3+ contained in orth-oferrosilite, piemontite, and uvarovite were estimated at various pressures and correlated with the compressibilities of the bulk mineral phases dontaining them. It appears that the Si04 tetra-hedra are the least compressible sites, whereas the 8-fold coord-ination sites (Ca site) are the most compressible ones.
The degree of covalency of the metal-ligand bond was esti-mated in uvarovite and Fe3+-bearing minerals. There is a very slight decrease in Racah parameter B with increasing pressure
(6-10 cm-l/100 kb.), indicating that the ionic character of the M-L bond may not be changed significantly under pressures of up
to 200 kb.
The d-energy levels constructed at high pressures provided information on the degree of regularity or distortion of the transition metal ion site. In most cases, it appears that distorted sites tend to be more regular at elevated pressures,
-3-and the longer M-0 bond is shortened substantially more than the shorter one as pressure increases.
No evidence has been obtained for any pressure-induced spin-pairing in Fe2+ in gillespite mineral or in any other minerals. Nevertheless, from the rates of band energy shifts with pressure, it appears that spin-pairing may take place in the lower mantle in the FeO phase.
Pressure-induced reduction of Cr6+, V5+, Mn7+, and Cu2+ ions contained in crocoite, vanadinite, KMnO4, and Egyptian-blue, occurs at pressures ranging from 50-120 kb.. On the other hand, no reduction was detected in the other cations such as Fe3+, Cr3+, and Mn3+ with increasing pressure up to 200 kb..
The high pressure spectra were used to distinguish crystal field bands from charge transfer bands, (e.g. Ti3+ in lunar pyroxene), and to give appropriate assignments to many of the observed absorption features in the spectra of minerals.
In the course of this study, many high pressure polymorphs were identified from the high pressure spectra. Some of those were studied intensively using other techniques, such as x-ray and Mbssbauer, and others remained to be investiaated further. From the high pressure spectra, the minerals gillespite,
azur-ite, crocoazur-ite, and vanadinite are believed to transform to other structures. In all of these minerals, discontinuous changes in their colors and spectra were observed at various pressures. High pressure x-ray studies are warranted to identify the crystal structures of the new polymorphs.
THESIS SUPERVISOR: Roger G. Burns
- 4
TABLE OF CONTENTS
TITLE PAGE...
ABSTRACT. . . . . . . . . . . . . . . . . . . . . . . .
TABLE OF CONTENTS . . . . . . . . . . . . . . . . . . . . INDEX OF FIGURES IN THE TEXT.. . . . . . . . . . . . . . .
INDEX OF TABLES IN THE TEXT - .. - . . . .. . . . .
ACKNOWLEDGMENTS . . . . . . . .... ... .. .. . . Chapter I: Chapter II: Chapter III: Chapter IV: INTRODUCTION. . . . . . . . . . . . . . . . THEORETICAL BASIS . . . . . . . . . . . . . II-1. Introduction. . . . . . . . . . . .
11-2. Crystal Field Theory. . . . . . . .
11-3. Ligand Field Theory and
Racah Parameters. . . . . . . . . . .
11-4. Molecular Orbital Theory and
Charge Transfer Spectra. . . . . . .
11-5. Effect of Pressure On Crystal
Field and Charge Transfer Bands. . . APPARATUS AND EXPERIMENTAL METHODS.. . . . .
III-1. Spectral Apparatus.. . . . . .. . . .
111-2. High Pressure Instruments. . . . ..
111-3. Sample Preparation For Spectral
Studies.. . . . . . . . . . . . . . . 111-4. Pressure Calibration . . . . . . . . 111-5. Experimental Difficulties.. . . . . . 4 7 13 14 15 19 19 20 24 31 36 44 44 54 62 72 78
EFFECT OF PRESSURE ON CRYSTAL FIELD
BANDS . . . . . . ... . . . ... 86
IV-l. Introduction. . . . . . . . . . . . . 86
IV-2. Pyroxenes . . . . . . . . . . . . . . 87
IV-2.1 Orthoferrosilite.. . . . . . . 91
IV-2.2 Bronzite . . . . . . . . . ill IV-2.3 Lunar Ti-augite.. . . . . . 116
IV-2.4 Blue Omphacite . . . . . . 131
IV-2.5 Rhodonite. . . . . . . . . 141
IV-3. Olivine . . . . &. ... . . .. . 148
IV-4. Garnets . . . . . . . . . . . . . . 165
IV-4.1 Almandine. . . . . . . . . . 168
IV-4.2 Andradite. . . . . . . . . . 182
- 5 -page Chapter V: IV-5. Epidotes. _+.. . . . . . . . . .. IV-5.1 Fe 3+-Epidotes. . . . . IV-5.2 Mn -Epidotes.. . . . .
IV-6. Miscellaneous Minerals.. . . . .
IV-6.i Staurolite.. . . . . . . IV-6.2 Lusakite.. . . . . . . . IV-6.3 Melilite.. . . . . . . . IV-6.4 Glaucophane.. . . . . . . IV-6.5 Dioptase.. . . . . . . . IV-6.6 Gillespite.. . . . . . .
EFFECT OF PRESSURE ON CHARGE
TRANSFER BANDS.. . . . . . . . . . . . .
V-l. Introduction.. . . . . . . . . .
V-2. Band Energies, Intensities
and Influence of Pressure . . . .
V-3. Effect of Pressure On M-M
Charge Transfer Bands.. . . . . .
V-3.1 Glaucophane.. . . . . . . V-3.2 Blue-Omphacite.. . . . . V-3.3 Vivianite . . . . . . . V-3.4 Fayalite and Orthoferrosilite. . . . . V-4. Effect Of Pressure On M-L and L-M Charge Transfer
Absorption.. . . . . . . . . . . V-4.1 Crocoite.. . . . . . . . V-4.2 Vanadinite.. . . . . . . V-4.3 KMnO .* . ... . V-4.4 Hematite .. ... V-4.5 Silicates . . . . . . . Chapter VI: PRESSURE INDUCED PHASE TRANSFORMATIONS
IN: GILLESPITE, EGYPTIAN BLUE AND AZURITE . . . . . . . . . . . . . . .
VI-1. Introduction.. . . . . . . . . . VI-2. Gillespite.. . . . . . . . . . . .
VI-2.1 Introduction.. . . . . . .
VI-2.2 Experimental Methods. . .
VI-2.3 Results.. . . . . . . . .
VI-2.4 Discussion.. . . . . . . .
VI-3. Egyptian Blue . . . . . . . . . . VI-4. Azurite . . . . . . . . . . . . . Chapter VII: DISCUSSION . . . . . . . . . . . . . . .
VII-l. Energy Shifts Of Spectral Bands With Pressure . . . . . . . ... VII-2. The Degree of Covalency and Racah
Parameter B at Elevated Pressures
333 333 335 335 336 337 363 377 384 396 396 400 193 196 201 214 214 220 230 246 255 263 264 264 265 268 269 276 281 290 291 293 307 315 324 330
- 6
-page
VII-3. Site Comnressibilities
From 1ODq Values. . . . . . . . 408 VII-4. Crystal Field Stabilization
Energies (CFSE).. . ... . 412
VII-5. Pressure Induced Reduction. . . . 421 VII-6. Pressure induced
Spin-Pairing . . . . . . . . . . . . . 428 VII-7. The Trend Of Pressure
Induced Changes In The Structure Of Silicate
Minerals . . . . . . . . . . .. 437 VII-8. Absorption Spectra And
Radia-tive Heat Transfer . o.. ... . 443
References . . ... . . . . . . . 46
- 7
-INDEX OF FIGURES IN THE TEXT
(Page numbers refer to figure captions, the figures will be found on the page immediately following.)
FIGURE PAGE
II-1. Octahedral array of ligands and position of electron at point P described in
spherical coordinates . . . . . . . . . . . . . 21
11-2. Energy levels of the free cation, free ligands, and molecular unit (ML6) - - - - *. 33
11-3. Schematic representation of conduction and valence bands....--.-.-.- . . . . . . .. 38
11-4. Potential energy wells of ground and excited states . . . . . . . . . . . . . . . . . 41
III-1. Photograph showing Cary 17 spectrophoto-meter *.... . . . . .. .. .. . . .. 45
111-2. Photograph showing reference and sample microscopes . . . . . . . . . . . . . . . . . . 47
111-3. Reflecting focusing system .. .. . -. -. . . 50
111-4. Spectrophotometer optical attachment . . . . 52
111-5. Light path in the new optical system . . . . 55
111-6. Photograph of UP style pressure cell mounted on universal x-ray table . . . . . - - - 58
111-7. Photograph of UXP type pressure cell mounted inside Debye-Scherrer powder x-ray camera . . . . . . . . -. - - - -. 60
111-8. Photograph of PP type diamond cell mounted on eucentric goniometer head . . . . . . 63
111-9. Gasketing method . . . . . - - - -. 66
III-10. Photograph of silver iodide (AgI) powder between two diamond anvils . . .... ... 71
III-11. Geometries of x-ray reflections from NaCl between the anvil faces . . . . ... 76
111-12. Visible spectra of a pair of diamond anvils.used in the pressure cell . . ... 79
III-13a. Pressure distribution in ungasketed sample of powdered NaCl in diamond anvil cell . . . . . . . . . .'. . ... 83
III-13b. Pressure contours for sample of nickel dimethylglyoxime in NaCl (1:3) in diamond-anvil cell . . . . . . . . . . . . . . . 83
IV-l. The crystal structure of diopside on z--axis . - - - -.. - -. . . . - 88
IV-2. Views of Ml and M2 sites in orthoferro-silite . . . .... . .. .. .. .* *. . . 92
IV-3. Crystal structure of orthoferrosilite . . . .. 94 IV-4. a-spectra of orthoferrosilite at 1 atm.
- 8
-FIGURE DAGE
IV-5. y-spectra of orthoferrosilite at 1 atm.
and 20 kb . . . . . . . . . . .. .. .. .. . 101 IV-6. Energy level diagrams for Ml and M2 sites
in orthoferrosilite constructed at 1 atm.
and 20 kb. . . . ... .. .. . . . . .. . .. . 1..04 IV-7. a-spectrum of bronzite, Fs14.5, at 1 atm.
and 20 kb . . . . . . . . . . . . ... 112 IV-8. Energy level diagram of M2 site in bronzite
at 1 atm. and 20 kb. . . . . . . . . . . . . . . 114 IV-9. Views of Ml and M2 polyhedra in lunar
pyroxene . . . . . . . . . . . . . . . . . . . . 120 IV-10. Polarized absorption spectra of pyroxene
single crystals in rock 74275 . . . . . . . . . 124 IV-ll. Energy level diagrams of Fe 2+ cation in
Ml and M2 sites, and Ti3
4 ion in Ml site . - . . 126 IV-12. a-spectra of 74275 pyroxene at 1 atm. and
50 kb. . . . .. 129
IV-13. Crystal structure of omphacite projected
along (100) . . . . .. . . . . . . . . . . . . . 133 IV-14. Absorption spectra of blue-omphacite single
crystal at 1 atm. and 40 kb. . . . . . . . . . . . 139 IV-15. Absorption spectrum of rhodonite in visible
and i.r. regions - . . . ....143 IV-16. Portion of octahedral serrated band in olivine
projected on (100) . . . . . . ... 150 IV-17. M1 and M2 polyhedral symmetries in olivine . 152 IV-18. y and a spectra of olivine [Fa96] at normal
pressure . . . . . - - - -. . . . . . . . . 155 IV-19. d-energy level diagrams for Fe2+ in Ml
and M2 sites in olivine . .. . . . . . . . . . . 157 IV-20. a-spectra of fayalite single crystal at
1 atm., 20 and 40 kb .. . . . . . .. . .. 160 IV-21. Energy level diagrams of M, site in fayalite
at 1 atm. and 40 kb. . . . . . . . . . . . . . . . 163 IV-22. Garnet crystal structure along z-axis . . . . . . 166 IV-23. a) Coordination polyhedra of oxygen atoms
about Si, Al, and Fe2+ atoms in almandine . . . 169 b) Interatomic distances (X-0 and 0-0) of
X08 triangular dodecahedron . . . . . . . . . . . . 169 IV-24. Energy level diagrams illustrating splitting
of d-energy levels in octahedral, cubic, and
dodecahedral symmetries . . . . . . . . . . . . . . 172 IV-25. Absorption spectrum of almandine garnet at
normal pressure . . . . . . . . . . . . . . . . . . 174 IV-26. Absorption spectra of almandine garnet at
1 atm., 50 kb., 100 kb., and 200 kb. . . . . . . . 180 IV-27. Absorption spectra of Fe3+ in andradite
garnet . . . . . . . . . . . . . . . . . . . . . . .184 IV-28. Absorption spectra of synthetic uvarovite
- 9
-FIGURE PAGE
IV-29. Structure of epidote along b-axis . . . . . . . 194 IV-30. a and $ spectra of Fe3+-epidote at
1 atm. ... ... ... 197
IV-31. a) Very distorted octahedral site of
Mn3+ in piemontite and M-0 distances ... 202
b) Energy level diagram of Mn3+ ion
at 1 atm . . . . . . . . . . ... 202 c) Energy level diagram of Mn3+ from
spectra at 200 kb.. . . . . . . . . . . . . . . 202 IV-32. Absorption spectra of Mn3+ in powdered
Mn3+ sample of piemontite at 1 atm. and
197 kb . . . . . . . . . . . . . .. . . . 205
IV-33. Pressure-induced energy shift of Mn3+ absorption bands in piemontite dt 18170
cm-1, 22000 cm-1 . . . . . - .. - .* - - .207
IV-34. Energy level diagrams of Mn+ orbitals at 1 atm., 75 kb., 92 kb., 135 kb.,
180 kb., and 190 kb . . . . . . . .... .. . 209 IV-35. Rate of pressure-induced energy changes
in CFS and CFSE parameters . ... 212 IV-36. View of Fe2+ tetrahedral site in
staurolite . . . . . . . . . . . 215 IV-37. Polarized absorption spectra of staurolite
at 1 atm . . . . . . .. .. .. 218
IV-38. Spectra of lusakite single crystal at 1 atm.
and 30 kb. . . . . . . . . . . . . . . . . . . . 221 IV-39. Energy level diggrams of Co2+ in lusakite
at 1 atm., 20 kb., and 120 kb. ... ... 225 IV-40. Spectra of lusakite powder at 1 atm. and 20
kb-.-.-.-.-.-.-.-... . . .... . . .. ... .228 IV-41. Crystal structure of melilite
projected on (001)..-.-.-.-. . . . . .231 IV-42. M6ssbauer spectrum of melilite I at
room temperature . . . . . . . . . . . . . . . ..235 IV-43. Absorption spectra of melilite I, melilite
II, and melilite III . . ft. .. . .. .. .. 239 IV-44. i.r. polarized spectra of melilite I at
1 atm., c-spectrum, a-spectrum . . . . . . . . . 241 IV-45. a) Energy level diagram of Fe2+ in
melilite I for curve-fitted c-spectrum. .... 244 b) View of tetrahedral site of Fe2+ in
melilite I . . . . . . . . . . . . . . . . . . . 244 IV-46. a) View of glaucophane structure along
a-axis. . . . . . . . . . . .. . . .. 247 b) View of glaucophane structure along
c-axis ... *.*... . . . .. . . . . . .. .. . 247 IV-47. Ml, M2, and M3 polyhedra in glaucophane . . . . 251 IV-48. Polarized spectra of glaucophane at
normal pressure . . . . . . . . . . . . . . . . 253 IV-49. a)Structure of dioptase along c-axis . . . . . . 256
- 10
-FIGURE PAGE
IV-49. b) Schematic diagram showing edge and
corner sharings between Cu2+ polyhedra... ... 256 c) Cu2
+ distorted octahedron and Cu-C
and Cu-OH distances .... . ... 256 IV-50. Absorption spectra of dioptase at
1 atm. and 50 kb.... . . . . ... . 259
IV-51. Cu2+ energy level diagrams in Oh and
C4v symmetries . . . . . . . . . . . . . . . . . 261 V-1. 8 and y spectra of glaucophane
measured at 1 atm. and 50 kb. . ... 271
V-2. MlH - Ml(l)H direction relative
to x, y, and z axes . . . . . . ... 278 V-3. Fe, and Fe1I site symmetries and
M-L distances in vivianite . . . ... 282 V-4. al Absorption spectra of
vivianite at 1 atm. . . . . . . ... 285 b) M-M charge transfer spectra
of vivianite at 1 atm. and
at 300 kb. . . . . . . . . . . . . . . . . . ... 285 V-5. Clinographic projection of
the crocoite structure . . . . . . . . . . . . 294 V-6. a) The visible spectrumrc of
crocoite at I. atm. ... . . .. .. ... 299 b) Absorption spectrum of crocoite
powder at pressure around 20-30
kb . . . . . . .... .. . . . . . . . . .. 299 c) Absorption spectrum of crocoite
powder at pressure around
60 kb. . . . . . . . . . . . . . . . . . . . . . 299 V-7. The molecular orbital energy level
diagram of the tetrahedral
chromate ion . . . . . . . . . . . . . . . . . . 301 V-8. a) A photograph of crocoite sample
subjected to 100 kb . . . . . . . a . .. .. .. 304 b) A photograph of crocoite sample
after lowering the pressure to
60 kb . . . . . . . a... . . .. .. .. . 304 V-9. Projection of vanadinite structure
on the c-axis . . . . . . . . . . . . . . . . . 308 V-10. a) Absorption spectra of vanadinite
at 1 atm. . . . . . .. . .. . . .... .. 311 b) Spectra of vanadinite at pressure
30-40 kb. . . . . . . . ... . . . 311 c) The spectrum of vanadinite at
pressure around 80 kb. . . . . . . . . . . . . . 311 V-ll. a) A photograph of vanadinite sample
subjected to about 80 kb. 0 . .. . . . .. .. 313 b) Photograph of crocoite subjected
to high pressure and quenched rapidly
PAGE
V-12. Crystal structure of KMnO4 projected
on (001) ..-.-. . . .- ... .. .. .. . . . 316 V-13. A photograph of KMnO4 subjected to
about 60 kb. . . . .~. . . . . . . . . . . . . . 320 V-14. The spectra of KMnO4 at elevated
pressures . . . . . . . . . . . . . . . . . . . 321 V-15. M.O. energy level diagram for
FeG6 9~ ionic cluster . . . . . . . . . . . .. 325 V-16. Optical absorption spectra of
hematite sample subjected to
100 kb. . . . . . . . . . . . . . . . . . . . 328 VI-l. a) Polarized spectra of a gillespite
crystal at 1 atm. and 26 kb... . . . . .. 338 b) The visible spectra of a
gillespite crystal above the
transition pressure . . . . . . . . ... 340 VI-2. a) A photograph of gillespite
crystal in polarized light, the
electric vector E-W . . . . . . . . . . . . . . 343 b) Photograph of the same crystal
above the transition pressure . . . . . . . . . 343 VI-3. a) A photograph of the same crystal
as in (VI-2a) rotated 90* (El|c) ... 345 b) Photograph of the same crystal
as in (VI-3a) subjected to pressure
above 26 kb. . . . . . . . . . . . . . . . . . 345 VI-4. Polarized spectra of a gillespite
crystal mounted in the diamond cell such that the c-axis is perpendicular
to the anvil faces. . . . . . . . . ... 347 VI-5. M6ssbauer spectra of synthetic
gillespite at 1 atm. and above the
transition pressure . . . . . . . . ... 350 VI-6. Cone axis x-ray photograph of a
gillespite crystal a.t 1 atm. ... 353 VI-7. Cone axis x-ray photograph of the
same gillespite crystal above
26 kb. ... . ... 355
VI-8. O-level precession x-ray photograph of a gillespite crystal without the
diamond cell ... .... 357.
VI-9. O-level x-ray photograph of a gillespite crystal mounted in the diamond cell with the pressure
below26 kb... . . . **...359 VI-10. O-level x-ray photograph of the
same crystal at pressure above 26kb. .... 361 VI-ll. a) Energy level diagrams of Feh.s.2+
in square planar site... . . . . . . 366
-11-
-12-PAGE
VI-ll. b) Energy level diagram showing the increases in the splitting
energies .. . . . . . . . . . . . . . . . . . . 366 c) Energy level diagram of Fel.s.2+
in square planar site .... . ... 366 VI-12. a) Energy level diagram of Fe2+ in D4h
symmetry . . . . . . . .. e . . . . . . ... 370 b) Energy level diagram constructed
from the spectra of gillespite
measured at pressure above 26 kb. .370 VI-13. Two diagrams illustrating the sites
of Fe2+ in the low pressure phase and the high pressure phase of gillespite.372 VI-14. The fluorescence spectrum of ruby
crystal fragment contained in the
diamond cell at 12.6 kb. . . . . .375 VI-15. e) Absorption spectrum of BaCuSi
4010
measured at normal pressure .... 379 b) Energy level diagram showing the
electronic transitions of Cu2+ ... 379 VI-16. The spectra of BaCuSi40O1 0 measured at
1 atm., 50 kb., and 200 kh. . ... .381 VI-17. The site symmetries and coordinates
of CuT and Cuji atoms in azurite . . . . . . . 386
VI-18. a) Spectrum of azurite crystal mounted
in the diamond cell at normal pressure . . . 389 b) Spectrum of azurite crystal above
60 kb. ..* **... . . . . .. .. ... .. 389 VI-19. Energy level diagram of Cu2+ in Oh and
D4h symmetries.
VII-l. Variation of B value with Cr-O interatomic distances in a suite of Cr-bearing
minerals . . . . . . . . . . . . . . . . . . . . 404 VII-2. a) The splitting of the d-energy levels
in a regular octahedral symmetry ... 414 b) Energy levels of Fe2+ in an octahedral
site compressed along the z-axis. . . . . . . . 414 VII-3. a) Energy level diagram showing the
spin-allowed transitions in Feh.s. 2+ and
Fel.s.2
+
. .. . .. .... .. .. . .. . . . . . . 431 b) Energy level diagram showing the
-13-INDEX OF TABLES IN THE TEXT
TABLE PAGE
II-1. The energies of some electrc:ic transitions
of dn configurations in octahedral field . . 27 IV-l. Ml-O and M2-0 interatomic distances in
orthoferrosilite . . . . . *. *.. .. .. .. .. 96 IV-2. Energy values of CFS and CFSE parameters for
Ml and M2 sites in orthoferrosilite at 1 atm.
and 20 kb. . . . . . . . . . . . . . . . . . . . 110 IV-3. Electron microprobe analyses of Apollo
74275 pyroxene . . . . . . . . . . . . . . . . . 118 IV-4. Ml-O and M2-0 interatomic distances in
lunar pyroxene . . . . . . . . . . . . . . . . . 122 IV-5. a)Site occupancies of Ml, M(l), MlH, and
Ml(l)H sites in omphacite . . . . . . . . . . . 136 b)M-0 interatomic distances in Ml, Ml(l)H,
Ml(l), and MlH sites ... ... 136
IV-6. Electron microprobe analysis of blue omphacite 138 IV-7. Assignments of spectral bands in rhodonite . . . 147 IV-8. Electronic transitions of Fe2+ in almandine
garnet ... . ... 178
IV-9. Co2+ crystal field band energies at 1 atm.,
5 kb., 20 kb., and 30 kb. . . . . . . . . . . . . 226 IV-10. M-O and 0-0 interatomic distances in staurolite.. 216 IV-ll. Electron microprobe analyses of melilite
I,II, and III . . . . . ... .. ... 234.
IV-12. M6ssbauer parameters of various minerals Con-taining Fe2+ and Fe3+ cations in octahedral,
tetrahedral, and square planar sites . . . . . . 238 IV-13. Ml-O, M2-0, and M3-0 interatomic distances
in glaucophane . . . . . . . . . . . . . . . . . 251 V-1. a)The positional parameters of the Mi, M
2,
and M3 sites . . . . . . . . . . . . . . . . . . 274 b)M-M interatomic distances in glaucophane. . . . 274 c)Bond angles MMM in glaucophane ... 274 V-2. a)Atomic parameters of the Fe ions in the
four octahedral sites in omphacite ... .277 b)M-M distances in omphacite . . . . . . . . . . .277 V-3. a)The intensities and d-values of the x-ray
diffraction lines for the monoclinic form of
PbCrO4 . . . . . . . . . . . . . . . . . . . . .. 296 b)The intensities and d-values of the x-ray
diffraction lines for the orthorhombic
form of PbCrO4 . . . . . . . . . . . . . . . . . 296 c)Intensities and d-values of x-ray
diffraction lines of the crocoite sample
used in this study (1 atm.) . . . . . . . . . . 296 d)Intensities and d-values of x-ray
diffraction lines of a crocoite sample subjected to 60 kb. and then quenched to
-14-ACKNOWLEDGMENTS
It is a pleasure to express my gratitude to Professor Roger G. Burns, my advisor, for his guidance, encouragement, and
complete support to this study throughout its duration. His ideas and constructive criticisms solved many problems and im-proved the thesis. Professor Burns kindly provided me with many of the mineral specimens used in this study.
I would also like to thank Drs. No-Kwang Mao and Peter Bll, of the Geophysical Laboratory, for allowing me to use their lab-oratory during the summer of 1972. Dr. Mao spent a lot of his valuable time explaining to me the techniques involved in the usage of the diamond cell. Dr. Gasper Piermarini, of the N.B.S., helped me to measure the transition pressure of gillespite,
using the ruby-fluorescence method, and explained many of the techniques involved in the high pressure -single crystal x-ray
studies. Professor William Bassett of the University of Roches-ter, provided me with the new modification of the diamond cell
(UXP type) and showed me how to use it.
I would particularly like to thank Dr. Frank Huggins for providing me with many stimulating ideas and for useful
discus-sion. Dr. Earl Whipple kindly provided me with two analyzed garnet samples.
I am indebted to Mr. Chien-Min Sung for many helpful dis-cussions and for his assistance. Mr. Bruce Loeffler read some parts of the thesis and critically reviewed Chapter V. I also wish to thank Professor Charles Burnham and Mr. Robert Hazen
for the cooperative high pressure x-ray work on gillespite. Professor Patrick Hurley's advice and encouragement are deeply appreciated. Professor John Dickey provided free time to use the microprobe lab. to analyze mineral specimens.
Mrs. Virginia M. Burns helped me in the bibliographic re-search and in the preparation of the thesis. I would like to express my appreciation to Ms. Roxanne Regan for typing this thesis; her skills and fast typing saved me a lot of time and improved the thesis.
Last, but not least, I am indebted to my wife, Maria
Letizia Abu-Eid, who typed all of the rough draft of the thesis. In the last four months, the first four months of our married life, she accepted, with good spirit, to live alone most of the time while I was working on the thesis; in addition, she provi-ded me with all of her moral support.
- 15 -Chapter 1 INTRODUCTION
Metals of the first transition series are often significant constituents of natural minerals so that the physical and chem-ical properties of many mineral phases are closely related to the nature and state of transition metal ions contained in their
structures.
The electronic absorption spectral technique is one of the most powerful tools employed to study the crystal chemistry of transition metal ions. Most transition metal ions absorb energy in the visible and nearby u.v. and i.r. regions as a result of electronic transitions between 3d orbital energy levels. In the past decade, these crystal field spectra have been used success-fully in mineralogy for such studies as determining cation valence state, interpreting cation site symmetries, explaining the cause of color and pleochroism of minerals, and estimating the degree of covalency of the metal-ligand bond. For a detailed review of
these applications in mineralogy and geochemistry, the reader is referred to Burns (1966, 1969a, 1970a); Manning (1967ab, 1969a,b,c, 1970); Faye et al. (1968); and White and Keester (1966). Obtain-ing the spectra of minerals at elevated pressures should reveal such properties at greater depths in the earth, and may provide valuable information relevant to the nature and composition of the Earth's interior.
The nature of the chemical bond in mineral phases at
- 16
-is not well understood yet. Racah parameters, B and C, have been
used as indicators of the degree of covalency of the chemical
bond (Manning, 1970; Moore and White, 1972). Since energies of
many crystal field bands depend on such parameters, a study of
the pressure effect on absorption bands could reveal information on the nature and character of the bonds between transition metal
ions and the ligands in mineral phases existing under elevated
pressure conditions in the mantle.
The crystal field stabilization energy parameter (CFSE) has
been used to estimate the site preferences of transition metal
ions in crystal structures. Obtaining similar parameters from
the high pressure spectra of minerals could be of considerable
importance for understanding ordering and enrichments of
transi-tion metal ions in crystal structures during mineral
crystalliza-tion.
At elevated pressures, electronic transitions such as
spin-pairing (Fyfe, 1960; Strens, 1969; Burns, 1969a; and Gaffney, 1972 a,b) and pressure induced reduction (Drickamer et al., 1969;
Burns et al., 1972a,b) of transition metal ions to lower oxidation states are expected to occur when sufficient pressures are
ap-plied to the samples. Using high pressure spectral techniques,
such transitions should be easily identified. In addition,
structural phase transformations in mineral phases may also be
detected when significant changes in the site symmetries or the
coordination numbers of transition metal ions take place at the
phase boundary (Abu-Eid et al., 1973; Hazen and Abu-Eid, 1974;
- 17
-Since the volumes of the polyhedra containing transition
metal ions are closely related to the spectral parameter, 1ODq,
the variation of this parameter with pressure can provide
in-formation on the site compressibilities (Tischer and Drickamer,
1962).
In addition to applications to geochemical and mineralogical problems, high pressure absorption spectroscopy has also been
used in geophysics for studies of radiative conductivities and
the variation of thermal conductivity within the Earth (Pitt and
Tozer, 1970a,b; Fukao et al., 1968; and Shankland, 1970, 1972).
Many ambiguities concerning the assignments of a number of
spectral bands to either charge transfer or crystal field
transi-tions have been the subject of controversy and debate in the
min-eralogical literature (Dowty and Clark, 1973a,b; Burns and
Huggins, 1973; Burns et al., 1972b,c,d,; and Burns et al., 1973).
Since crystal field and charge transfer bands are expected to
show opposite energy shiftswith pressure, high pressure spectra of minerals can be used for distinguishing crystal field from
charge transfer bands.
There is obviously a large scope of spectral data of
miner-als containing T.M. ions at high pressures. The present
inves-tigation is aimed at measuring the crystal field and charge
transfer spectra of minerals at pressures ranging from 1 atm. to
200 kilobars, and then employing the obtained experimental
re-sults, with some theoretical consideration, to explain or predict the chemical and physical behavior of transition elements at
- 18
-In the Zollowing chapter, crystal field and molecular orbital
theories are reviewed briefly since they represent the theoretical
basis for interpreting both crystal field and charge transfer
bands.
The apparatus and experimental methods are described in
chapter III. This is followed by the core of the thesis in
chap-ters IV and V, in which the effect of pressure on crystal field
and charge transfer bands for various minerals is discussed in
some detail. Chapter VI discusses high pressure polymorphic
transitions in some minerals. Finally, applications of the high
pressure spectral studies to the Earth's interior are outlined
- 19 -Chapter II
THEORETICAL BASIS
II-1. Introduction
The spectra of mineral phases bearing transition metal ions
are dominated in general by two types of features. Firstly,
there are crystal field bands which are related to electronic
transitions between the d-levels of transition metal ions and
generally appear in the energy region 4,000-30,000 cm~ . These bands are characterized by their relative low intensities and
narrow widths. Secondly, there are charge transfer bands which
are of two categories: first, ligand+metal or metal+ligand, and
second, metal-metal charge transfer transitions (Phillips and
Williams, 1966). The first category, charge transfer bands,
arise from electron transfer between energy levels of highly
li-gand character and levels of mostly metal character, and vice
versa (McClure, 1959; Lever, 1968). These, in general, are very
intense and usually occur at energies higher than those of
crys-tal field bands above 25,000 cm 1. The second category of charge
transfer transitions, metalimetal charge transfer bands, arise
from transfer of electrons between the d-levels of adjacent metal
ions having different oxidation states, e.g. Fe 2+Fe 3+(Hush, 1967).
In this study, crystal field bands will be treated using the
models of crystal field and ligand field theories, whereas charge
- 20 -11-2. Crystal Field Theory
Crystal field theory has been remarkably successful in ex-plaining most spectral bands observed in the spectra of transi-tion metal ions contained in many silicate minerals.
In this model, the negative and positive ions are represent-ed as point charges and the electrostatic potential, Vl, associa-ted with an electron at a point, P, (Fig. 1) at a distance, d, from ligand (1) and, r, from the central metal ion is given by
VS 1 + (i)2
d
where Z is the charge on the ligand.
Considering the particular case of an octahedral array of six negative.point charges each at distance, R, from the central ion, the total potential, V, at, P, arising from the six ligands has been calculated by Dunn et al. (1965) and Hutchings (1964), and is expressed as:
2 2
6Ze 35Ze 4 4 4 3 4
V=R + 5(x + y + z --
gr)
(2)4R
The first term, 6Ze 2, is usually neglected in the crystal field
R
approximation since it is spherically symmetrical and does not participate in the splittings of d orbitals. The quantity,
35Ze2, is usually denoted by D; it follows then that the poten-4R5
tial at any point at < R distance from the central ion can be expressed as :
4 4 4 3 4
V = D (x + y + z - r) (3)
After establishing the potential, V, the perturbations of this potential on the wave functions of d electrons are taken
- 21
-FIGURE II-1
Octahedral array of ligands and the position
of an electron at point P described in
- 22 --.
R'
'
*e : * .*.4A
x
3
~ 23
-wave function pairs to obtain integrals of the form:
CO7T T
2
f/f/foRn1 (r)Olm(0)4m (O)VR nl, (r)l'm'(0)m'(#)r sine dr d6 d$ (Dunn et al., 1965), where R nl(r) is the radial part of a d wave function and 0lm(0)Dm ($) are the angular parts or spherical
harmonics.
The perturbation secular determinant can be constructed from solving the above integrals. In case of a d electron, a
square matrix 5x5 could be established from the five ML values for a d electron. Solution of the part of the integral depend-ent on D will reduce the 25 elemdepend-ents of the secular determin-nt to seven. However, solutions of the 0 integral for different values of m and m' need tedius mathematical treatments and have been given in many references (Dunn et al., 1965; Figgis, 1966; Hutchings, 1964); thus, for example, for in = m' = 0, the solution of 01m and @m integrals is given as:
<0| (x4 + y + z
)|0>=
r4 (4)
-2 4 2
The radial part integral fWR (r)r r dr cannot be solved
(Dunn et al., 1965; Figgis, 1966), and it is replaced by the parameter q where:
2 co 2 4 2
q = 105/ORnl (r)r r dr (5)
Considering the rest of the ML values, the secular determi-nant can be formulated from the solution, of which the energies
of the different sets of d-levels could be evaluated.
This method of calculation represents the basis for
con-structing energy level diagrams for transition metal ions of
- 24
-Orgel energy level diagrams (-Orgel, 1966). The splitting energies between these levels are expressed as multiples of Dq and the
relations among the Dg values for octahedral, tetrahedral, and
cubic symmetries are:
9 9
Dq (oct.) = -T Dq (tet.) =-- Dq (cubic)
From the above outline of the theoretical basis of crystal
field theory, we should keep in mind the important equivalence: 2
35Ze 2 cO 2 4 2
Dq 4 5 105/oRl (r)r r dr] (6)
From this relation, it is evident that Dq is inversely
proportional to the fifth power of the average metal-ligand band
distance, R.
For qualitative spectroscopic studies, crystal field theory is quite successful. However, for quantitative work it is inad-equate, primarily because it does not take into account the
possibility of some covalent character of the metal-ligand bond.
Because of this inadequacy, ligand field theory has been
develop-ed from crystal field theory.
11-3. Ligand Field Theory (LFT) and Racah Parameters
Ligand field theory is a modification of crystal field
theory which takes into account the various degrees of overlap
between the d-orbitals of the transition metal ion and the ligand
orbitals. When there is an excessive degree of mixing between
the metal and ligand electrons, LET will have essentially a
molecular orbital formulation; however, in the case of small to
moderate amounts of overlap, it will be basically an adjusted
- 25
-For the purposes of this study, greater emphasis is placed
on crystal field and ligand field models, since the degree of
covalecy of the metal-ligand bond in most mineral phases under
investigation is small to moderate.
The major modifications of crystal field theory that take
into account mixing of cation and ligand orbitals involve using
the parameters of 3d interelectronic interaction as variables
rather than constants (equal to the values for the free ion). Of these parameters, the most significant are the interelectronic
repulsion parameters which are frequently known as Racah
parame-ters, B and C.
Racah parameters, B and C, are related to the covalency or
the ionicity of the metal-ligand bond. They are derived from
calculations of the radial wave functions of the electrons
in-volved in the bonding between transition metal ions and the
surrounding ligands (Racah, 1942a,b, 1943, 1949). B and C energy
values are inversely proportional to the spatial extent of the
ligand and cation orbitals. Hence the larger their values, the
more ionic is the metal ligand bond.
The perturbation of the ligand orbitals on the d-wave
func-tions of the central ion, using ligand field models, is
mathemat-ically expressed in a secular determinant or energy matrix. The
elements of that matrix are given in terms of the crystal field
parameter, Dq, and Racah parameters, B and C.
In two classic papers (1954a,b), Tanabe and Sugano derived
such secular determinants and from the solutions, they obtained
- 26
-the higher energy states. The results of calculations by Tanabe
and Sugano have been used by many workers in this line of study.
Some of the important electronic transitions for various dn
configurations in octahedral fields are given in Table 1; their
energies in terms of Dq, B, and C are also quoted from different
references. Tanabe and Sugano (1954b) also constructed energy
level diagrams which show the dependence of energy levels upon
both interelectronic repulsion parameters and crystal field of
medium strength. In these diagrams, the energies of the levels
of a dn system are plotted in B units as vertical coordinates,
and the horizontal coordinate is Dq/B. These diagrams are useful
for recognizing the type of electronic transition, forbidden or
allowed, and for rough estimation of the energy of each
transi-tion in various dn systems.
In order to apply the above theoretical aspects to
assign-ments of crystal field spectra of transition metal ions in
natur-al minernatur-als, the following procedure will be followed in this
thesis:
1. Determine the chemical composition of each mineral phase and especially the concentrations of transition metal ions.
2. Obtain all the accessible informatidn on the crystal
struc-ture of each individual mineral with emphasis on the site
sym-metries of the central ions.
3. Identify spectral bands and assign them to the appropriate electronic transitions.
4. Evaluate the energies of these transitions expressed in
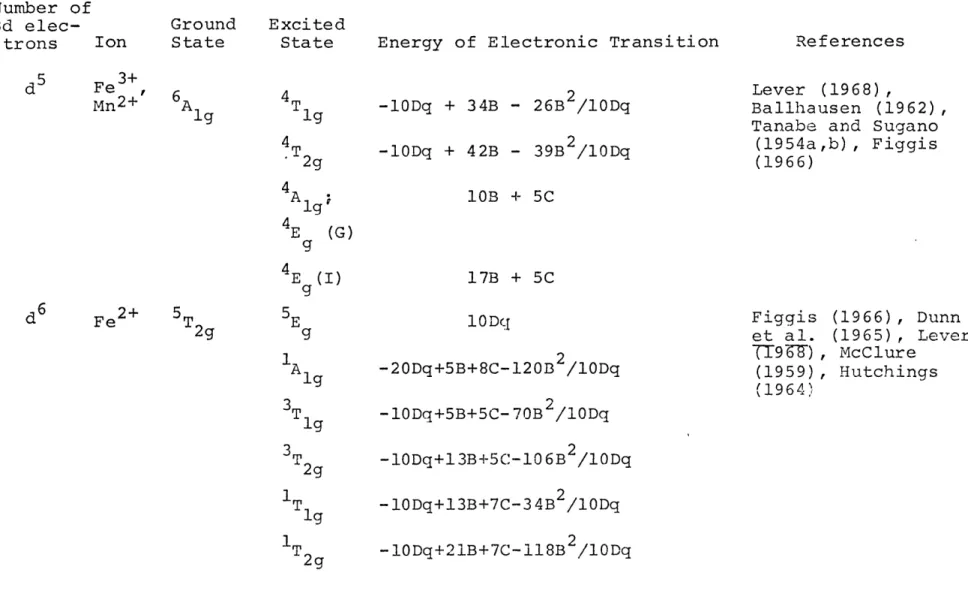
Table 1: Energies of Some Common Electronic Transitions of dn Configurations in an Octahedral Field Number of 3d elec- Ion trons d1 d TgTi3+ 2T Ground Excited
State State Energy of Electronic
10 Dq g Transition References Dunn et al. (1965), Hutchings (1964), Figgis (1966) d2 V3+ 3T g 3TT 2g T lg A 2g 1/2 (10Dq-15B) +1/2 [ (l0Dq+15B) 12B. 10Dq] 1/2 [(lODq+15B) 2-12B. 10Dq] 1/2 1/2 (3ODq-15B) +1/2 [ 12B.10Dq] 1/2 - Lever (1971) Sugano (1968) , K6nig Tanabe and (1954a,b) (lODq+15B) Cr3+ Cr 4AA 2g d4 M3+ 5E g T2g (F) T g(F) T lg(P) 5TT2g 10 Dq 1/2 (15B+3ODq) -1/2 [ 1/2B. 1ODq] 1/2 (15B-lDq) 2
Tanabe and Sugano (1954a,b), Poole (1964), Knig (1971) Lever (1968), Reiner (1969) 1/2 (15B+3ODq) +1/2 [ (15B-lODq) 12B. 10Dq] 1/2 10Dq Lever (1968), Orgel (1966) (1965) Dunn et al.
d
3Table 1: Number of 3d elec-trons (Cont'd - page 2) Ion Ground Excited
State State Energy of Electronic Transition References
5 3+ d Fe ' Mn2+ 6A g 4T g 2g 4A 4 E (G) 9 4E (I) -lODq + 34B - 26B /lODq -lODq + 42B - 39B /lODq Lever (1968) , Ballhausen (1962), Tanabe and Sugano
(1954a,b) , Figgis (1966) 10B + 5C 17B + 5C 10Dq 2 -20Dq+5B+8C-120B /lODq -lODq+5B+5C-70B 2 /10Dq -1ODq+l3B+5C-106B /lODq -lODq+13B+7C-34B /lODq -lODq+21B+7C-18B /lODq Figgis (1966) , Dunn r et al. (1965) , Lever c
TT9-6T),
McClure I (1959) , Hutchings (1964) d6 Fe2+ 5T A g 3T 1T 1T2gTable 1: Number of 3d elec-trons (Cont'd - page 3) Ion d 7 Co2+ 4 T d8 Ni 2+ 3A g ound Excited ate State F) 4T 2g(F) A lg(F) 4 T g (P) 3T 2g (F) T g (F) 3 T g (P)
Energy of Electronic Transition
1/2 (lODq-15B)+1/2 [ (lODq+15B) 2 -11/2 12B.lODq] 2 _ 1/2 (3ODq-15B) +1/2 [ (lODq+15B) 2 12B. 10Dq] 1/2 References Kbnig (1971) , Lever (1968), Tanabe and Sugano (1954a,b), Ballhausen (1962) [(lODq+15B) -12B. 10 Dq] 1/2 10Dq 1/2 (15B+3ODq) -1/2 [ (15B-lODq) 2 12B. lODq] 1/2 1/2 (15B+3ODq) +1/2 [(50B-lODq) 2 12B. 1ODq] 1/2 K6nig (1971) , Lever (1968), Tanabe and Sugano (1954a,b)
d9 Cu2+ 2E 2T 2g Dunn et al. (1965).
Ballhausen (1962)
- 30
-This procedure may be easily followed for interpreting the spectra of simple mineral phases. However, in complicated sys-tems, i.e. minerals containing more than one transition metal ion and having different oxidation states in distorted and multiple sites, the interpretation needs more careful study and some experience.
The energies of spectral bands may also be calculated and then compared with the experimentally determined energy values (Ilse and Hartmann, 1951a,b; Ballhausen, 1954; Wood and Strens, 1972; and Gaffney, 1972a). This may be done when the site sym-metry of the central ion is known and the interatomic bond dis-tances (metal-ligand) are available. The methods of calculating the energies of crystal field transitions are useful, especially whenever there are uncertainties in the assignments of spectral bands.
In natural minerals, transition metal ions are frequently contained in distorted sites. Consequential to the site distor-tion, the degeneracy of the d-levels will decrease and multiple electronic transitions are obtained for each distorted symmetry. To obtain the values of 1ODq in a distorted symmetry, energy level diagrams should be constructed empirically from the energy values of each transition. The baricenters of energy for each set of d-levels are then determined and 1ODq or A will be the energy separation between the baricenters of energy.
In the present study, we shall follow the above procedure wherever it applies and then calculate the values of 1ODq and B
- 31
-Other complications arise in interpreting the spectra of transition metal ions in natural minerals when other types of
absorption bands appear in the spectra. These are the charge
transfer bands, the theoretical basis of which is outlined
brief-ly in the next section.
11-4. Molecular Orbital Theory and Charge Transfer Spectra
Crystal field models cannot explain all the observed
spec-tral features, and there is a great deal of experimental evidence
demonstrating the limits of its usefulness (McClure, 1959; Cotton, 1971). This limitation is mainly due to the neglect of the over-lap of metal and ligand orbitals. To take this into account,
molecular orbital theory has been modified from crystal field
theory.
In the molecular orbital model, the ligand orbitals of
ap-propriate symmetries are mixed with the d orbitals. As an
exam-ple, let us consider a strong octahedral crystal field in which
the d orbitals are split into e and t2 . Of the p orbitals of
g 2g
each ligand in the molecule, one orbital is directed along the
bond and gives rise to a a orbital when combined with a cation
orbital. The other two p orbitals, which are perpendicular to
the bond, give rise to 7 orbitals when combined with cation
or-bitals. These two types of orbitals, a and r, may also be
class-ified into e and t .
g 2g~
To form molecular orbitals, the atomic orbitals of the
li-gand and cation should have similar symmetries, e.g. p orbitals
- 32
-of t syrmtry will combine with to, d orbitals (McClure, 1959;
2g 4
Lever, 1968). Since m orbitals are not directed along the ligand
bond whereas a orbitals are so directed, then the former, fr, will
generally form weaker bonding and antibonding orbitals than do a. In both crystal field theory and molecular orbital theory, the difference in energy between e and t orbitals is a result
g 2g
of the same geometrical factor, the octahedral ligand field,
which arises from an electrostatic effect in the former and an
antibonding effect of a-ligand orbitals in the latter (McClure,
1959; Cotton, 1971).
To understand the origin of the charge transfer bands and
how they are related to those of crystal field, Fig. 2 is drawn
schematically to illustrate both types of transitions for an
octahedral complex. In this diagram, the energy levels of the
free cation and the free ligand are shown on both sides. Also
shown is how the d-orbitals split into two sets of levels, e g and t2g as a result of placing the cation in a regular octahedral
electrostatic environment. The central portion of the diagram
shows the energy levels of the molecular units (ML6) as a conse-quence of combining ligand and cation orbitals. Molecular
orbi-tals marked by an asterisk are those of antibonding character,
whereas others are either bonding or non-bonding. The levels
below t * are filled with electrons and the levels above e *
2g g
are empty. However, these two levels, t * and e *, could be
2g g
completely filled, or empty, or partly filled depending on the
number of d electrons of the transition metal ion. The e * and g
- 33
-FIGURE 11-2
The energy levels of the free cation, the free ligands, and the molecular unit (ML6) , drawn schematically, based on the molecular orbital
- 34 -P M-L M-L e * 4 g t2g L-M T 2 g __ e 9 Cation Orbitals Tr p S a
Molecular Orbitals Ligand Orbi.tals 2g
- 35
-immediately above. and below them have mostly ligand character.
Transfer of electrons from the ligand orbital to either t 2g* or e * will give rise to ligand-to-metal (L-*M) charge transfer bands
g
and from t2g * or e * to the above levels will produce metal-to-ligand (M-L) charge transfer bands (Phillips and Williams, 1966).
Tails of charge transfer bands, due to electron transfer
from the orbitals of primarily ligand character to higher energy levels having mostly metallic character (e * or t *) are always
g 2g
observed in the ultraviolet spectra of silicate minerals bearing
transition metals.
Another type of electron transfer is that between the t 2
and e * levels of one cation to that of another neighboring g
cation of different oxidation state. This is called a metal-to-metal electron transfer (M+M) or intervalence transfer (Hush, 1967). Metal-metal electron transfer can occur either between the energy levels of cations of the same element but of different oxidation states, e.g. Fe +Fe +, Ti +-Ti 4+, which is called
homonuclear intervalence transfer; or between d-levels of cations
of different elements, e.g. Fe 2+ Ti4+, which is known as
hetero-geneous intervalence transfer (Hush, 1967).
The intensities and energies of charge transfer bands
aris-ing from metal-metal electron transfer are dependent on the
extent of delocalization of electrons between metal nucleii.
This delocalization will lead either to direct overlap of the
orbitals of the two metal atoms or to metal-ligand-metal overlap
through a or 'i metal-ligand bonding. Overlap orbitals for the
- 36
-(Hush, 1968). The values of the overlap integrals AMM or AMLM are also dependent on the interatomic distances, the nature of the ligand, and the crystal geometry.
Since it is the purpose of this thesis to examine the effect
of pressure on the spectra of minerals, we need to examine how
the effect of pressure on absorption phenomena may be described
by these theories.
11-5. Effect of Pressure on Crystal Field and Charge Transfer Bands
The most significant spectral parameters that concern this
study are the band energies, shapes, and intensities and their
interrelationships.
The energies of most significant crystal field transitions
are given for dn (where n=1,2,...9) electronic configurations in
Table 1. Some of these transitions are dependent solely on Dq,
others on B, and still others on both B and Dq. The relation
between Dq and the metal-anion distance, R, in equation (6) can
be given as:
Dq (7)
R
With increasing pressure, assuming a typical hydrostatic
condi-tion, R is expected to decrease and results in an increase of Dq.
Therefore, we expect significant energy increases to be observed
for those bands dependent only on Dq. However, bands which are
dependent on B and C are expected to show very small negative
energy shifts (i.e. red shift). This is because B and C are