HAL Id: ird-00145342
https://hal.ird.fr/ird-00145342
Submitted on 9 May 2007
HAL is a multi-disciplinary open access archive for the deposit and dissemination of sci-entific research documents, whether they are pub-lished or not. The documents may come from teaching and research institutions in France or abroad, or from public or private research centers.
L’archive ouverte pluridisciplinaire HAL, est destinée au dépôt et à la diffusion de documents scientifiques de niveau recherche, publiés ou non, émanant des établissements d’enseignement et de recherche français ou étrangers, des laboratoires publics ou privés.
Distributions of oxygen and carbon stable isotopes and
CFC-12 in the water masses of the Southern Ocean at
30°E from South Africa to Antarctica: results of the
CIVA1 cruise
Anne-Sophie Archambeau, Catherine Pierre, Alain Poisson, Bernard Schauer
To cite this version:
Anne-Sophie Archambeau, Catherine Pierre, Alain Poisson, Bernard Schauer. Distributions of oxygen and carbon stable isotopes and CFC-12 in the water masses of the Southern Ocean at 30°E from South Africa to Antarctica: results of the CIVA1 cruise. Journal of Marine Systems, Elsevier, 1998, 17 (1-4), pp.25-38. �10.1016/S0924-7963(98)00027-X�. �ird-00145342�
Journal of Marine Systems
Volume 17, Issues 1-4, November 1998, Pages 25-38
Distributions of oxygen and carbon stable isotopes and CFC-12 in the water masses of the Southern Ocean at 30°E from South Africa to Antarctica: results of the CIVA1 cruise
Anne-Sophie ARCHAMBEAU 1, (tel : +33-1-4427-4868; Fax: +33-1-4427-4993; E-mail:
archambo@ccr.jussieu.fr)
Catherine PIERRE ² (email : cat@lodyc.jussieu.fr) Alain POISSON 1 (email: apoisson@ccr.jussieu.fr)
Bernard SCHAUER 1 (email: schauer@ccr.jussieu.fr)
1 Laboratoire de Physique et Chimie Marines (LPCM), (URA 2076: CNRS/UPMC), Université Pierre et Marie Curie, tours 24-25, 4 place Jussieu, F 75252 Paris Cedex 05, France
2 Laboratoire d'Océanographie Dynamique et de climatologie (LODyC), (UMR: CNRS/ORSTOM/UPMC), Université Pierre et Marie Curie, tour 26, 4 place Jussieu, F 75252 Paris Cedex 05, France
Abstract
This study presents oceanic distributions of stable isotopes (δ18O of water and
δ13C of ΣCO
2) and CFC-12 from samples collected during the CIVA1 cruise
(February/March 1993), across the Southern Ocean, along a meridian section at 30°E, from South Africa (44°S) to Antarctica (70°S). The isotopic measurements show important variations between the subantarctic surface waters with low δ18O–high δ13C
values and the antarctic surface waters with very low δ18O–low δ13C values. The surface
distributions of δ13C values follow the major frontal oceanic structures; the vertical
distribution shows the progressive upwelling from the subantarctic zone to the antarctic divergence of 13C-depleted CO
2 derived from remineralization of organic matter. Along
the Antarctic continental shelf, between 2500 and 4000 m, a core of water with δ18O
values close to −0.1‰ is associated with a relative maximum in CFC-12 concentration, although this core is not detected by its temperature and salinity parameters. This water mass, which corresponds to recently formed deep water, may originate from the eastward extension of the Weddell gyre or from bottom waters coming from the East and formed near Prydz Bay.
Résumé
Cette étude présente les distributions dans l'océan Austral des isotopes stables (δ18O de l'eau et δ13C de ΣCO
2) et des CFC-12 provenant d'échantillons prélevés durant la
mission CIVA1 (Février/Mars 1993), le long d'une section méridienne à 30°E, entre l'Afrique du Sud (44°S) et l'Antarctique (70°S). Les compositions isotopiques montrent des variations importantes entre les eaux de surface subantarctiques caractérisées par des valeurs basses de δ18O et élevées en δ13C et les eaux de surface antarctiques très
appauvries en 18O et pauvres en 13C. En surface, les valeurs de δ13C varient en suivant
les structures frontales océaniques; la distribution verticale de ce paramètre montre l'upwelling progressif de la zone subantarctique vers la divergence antarctique, de CO2
appauvri en 13C provenant de la reminéralisation de la matière organique. Le long de la
marge continentale Antarctique, entre 2500 et 4000 m, des maxima relatifs des valeurs de δ18O et de CFC-12 sont observés. Ils indiquent la présence d'une masse d'eau bien
ventilée et récemment formée, bien qu'aucun indice ne soit révélé sur les profils de température et de salinité. Cette masse d'eau pourrait provenir soit de l'extension Est de
la gyre de Weddell soit des eaux profondes venant de l'est et formées dans la région de Prydz Bay.
Keywords: Stable isotopes; 18O; 13C; CFC-12
Introduction
The Southern Ocean is a special area from where the main bottom and intermediate water masses of the world ocean originate. Many studies using dynamic and geochemical observations in the Weddell Sea and near Prydz Bay provide information on the formation of deep and bottom waters and on their circulation in this area; however numerous questions remain regarding the eastern extension of the Weddell gyre and the recirculation of the bottom water masses (Gordon, 1971; Foster and Carmack, 1976; Jacobs and Georgi, 1977; Carmack, 1977; Deacon, 1979; Weiss et al., 1979; Smith et al., 1984; Jean-Baptiste et al., 1991; Mantisi et al., 1991; Schlosser et al., 1991; Gouretski and Danilov, 1993, Orsi et al., 1993). Measuring distributions of δ18O and δ13C
values, which are natural tracers of oceanic water masses, is of great interest because they add specific information to help understand the mechanisms responsible for internal variability of water masses in their source region and at depth, and allow one to follow their circulation far away from their source.
The data presented here were collected during the WOCE/CIVA1 cruise on the Marion Dufresne during February/March 1993 in the southwest Indian sector of the Southern Ocean, along a section at 30°E, from South Africa (44°S) to Antarctica (70°S) (Fig. 1). This study presents a novel set of isotopic data (δ18O of water and δ13C of ΣCO
2)
at 10 vertical stations throughout the water column. In addition to the stable isotope measurements, CFC-12 measurements from the CIVA1 cruise are also presented as transient tracers of the origin and age of the water masses (Bullister, 1984; Mantisi et al., 1991).
Methods
Seawater samples were collected by a rosette system fitted with twelve 12-l Niskin bottles and a Neil–Brown CTD. Onboard, seawater samples for 13C measurements were
siphoned from Niskin bottles into 125 ml glass bottles, then poisoned with 1 ml of a saturated solution of HgCl2. The ΣCO2 was extracted from seawater by acidification with
phosphoric acid as described by Kroopnick (1974). The method used for δ18O
measurement was the classical water–CO2 equilibration at 25°C as described by Epstein
and Mayeda (1953). The isotopic compositions are expressed in the δ conventional units defined by:
δ = [(R/R*) – 1] x 1000
where R=18O/16O or 13C/12C and R* refers to the reference: SMOW for 18O/16O ratio
(Craig, 1961) and PDB for 13C/12C ratio (Craig, 1957). Reproducibility of these
measurements is about ±0.05‰ and the standard deviation is about ±0.01‰.
The method for CFC measurement follows the technique of Bullister and Weiss (1988) and was described in detail by Mantisi et al. (1991). For CFC-12, the detection limits of the system were 0.01 pmol/kg and the standard deviation in the measurements is about 2%.
Hydrography
The CIVA1 cruise was conducted during the austral summer 1993 along a meridian section at 30°E which crosses the main hydrological fronts of the Southern Ocean (Lutjeharms and Valentine, 1984; Park et al., 1993). These fronts are identified by abrupt changes affecting the isohalines (Fig. 2a) and isotherms (Fig. 2b). Along this section, the different fronts are located as follows: the SubAntarctic Front (SAF) at 48°S, the Polar front (PF) at 52°S and the Antarctic Divergence (AD) at 66°S. The different water masses, identified by their θ–S parameters, are those described previously for the Antarctic Ocean by Jacobs and Georgi (1977) and Whitworth and Nowlin (1987).
In the Antarctic zone, the Antarctic Surface Water (AASW) shows strong variability in temperature and salinity (−1°C<θ<4°C; 33.7<S<34) and is easily identified by a subsurface temperature minimum (θ≈−1.7°C) which characterizes the remnant signal of the Winter Water (WW). Beneath this layer of cold water lies the Circumpolar Deep water (CDW) which is characterized by temperature and salinity maxima (θ≈1.4°C; 34.67<S<34.72) between 1000 and 3000 m. For depths greater than 3500 m, the Antarctic Bottom Water (AABW) is observed with S≈34.66 and θ≈−0.7°C.
In the subantarctic zone, four main water masses are superimposed. The Subantarctic Surface Waters (SASW) are relatively warm with a large range of temperatures (8°C<θ<14°C); the Antarctic Intermediate Water (AAIW) which is characterized by a salinity minimum (S=34.25), sinks at the SAF and lies at immersion depths from 200 m to 800 m; the CDW, which contains a major contribution of North Atlantic Deep Water (NADW) in this area, shows a temperature maximum (θ=2.6°C) near 1600 m and a salinity maximum (S=34.76) near 2500 m; the AABW is still observed.
Fig. 2. (b) Latitudinal distribution of potential temperature (°C).
The chlorofluorocarbons (CFC) distribution in the water masses
The vertical distribution of CFC-12 along the section at 30°E (Fig. 3) gives information on the penetration of the transient tracers in this area of the Southern Ocean as well as on the global circulation at depth. The penetration of water with high CFC values in the subantarctic zone is observed down to 1000 m; this characterizes the sinking of newly formed AAIW (CFC-12=1.0 pmol/kg) at the SAF from 200 m to intermediate depths (800 m). The CDW, which largely extends in this area, is characterized by low CFC concentrations (0.05 pmol/kg<CFC-12<0.10 pmol/kg); its upwelling at the AD stops the penetration of atmospheric anthropogenic CFCs in the antarctic zone.
Fig. 3. Latitudinal distribution of CFC-12 (pmol/kg).
Along the Antarctic continental shelf, a relative maximum of CFC concentration is observed between 2000 and 4500 m (0.2 pmol/kg<CFC-12<0.4 pmol/kg), indicating that these waters were recently ventilated. Between the AD and 55°S, at an immersion depth of about 4000 m, a tongue of CFC rich water (0.1 pmol/kg<CFC-12<0.15 pmol/kg) indicates the existence of a “young” deep water mass. Another relative maximum occurs near the bottom, at 5000 m (0.1 pmol/kg<CFC-12<0.15 pmol/kg) which is correlated with a temperature minimum (θ=−0.7°C) and an oxygen maximum (240<O2 μm/kg<245).
The stable isotope composition of the water masses
The oxygen and carbon stable isotope compositions of ocean waters provide specific information on both the water and carbon cycles, providing insight to better understand the mechanisms and magnitude of the fluxes between the oceanic and atmospheric reservoirs.
The δ18O values of ocean waters are sensitive to variations in the evaporation–
dilution ratio; the concentrations of heavier isotopes in the ocean surface waters are enriched by evaporation and depleted by dilution due to precipitation. These processes cause linear relationships between oxygen-18 and salinity whose slopes depend on climatic constraints (Craig and Gordon, 1965). At high latitudes, the effect of freezing at the ocean surface increases the salinity, however it causes only a weak depletion of the
δ18O values of the remaining liquid seawater. Leaving the surface, for intermediate or
deeper depths, the water is no longer affected by air–sea exchange; the δ18O parameter
is thus conservative and its distribution follows the circulation pattern of the water masses (Craig and Gordon, 1965). The melting of sea-ice causes large changes in salinity and leaves the δ18O almost unchanged (the resulting mixture may be slightly enriched in 18O), while continental-ice melt causes large drops both in salinity and δ18O. Therefore, at
high latitudes, the δ18O values of waters may also help to differentiate dilution effects
induced by the melting of continental ice as opposed to sea ice (Schlosser et al., 1990). The variations of δ13C of ΣCO
2 occur mostly in the upper ocean waters and depend
on the ocean–atmosphere CO2 exchange and on the photosynthesis–respiration
processes. Carbon isotopes are fractionated during the production of organic matter which incorporates preferentially the carbon-12. The δ13C values in ocean waters are
maximum at the surface where photosynthesis occurs; they decrease at depth where remineralization of organic matter releases 13C-depleted CO
2 (Kroopnick, 1985; see Table
1 Table 2).
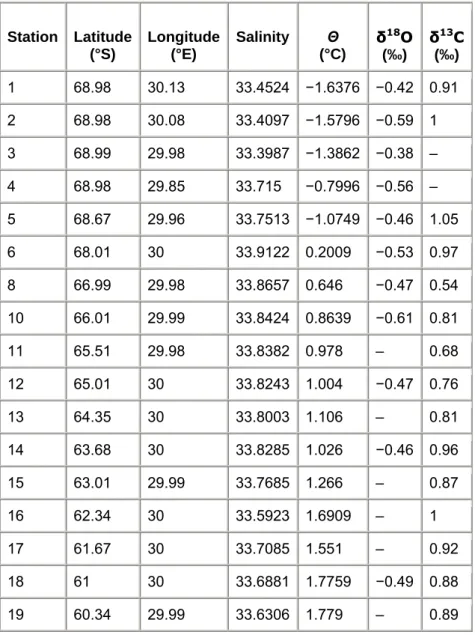
Table 1: Stable isotope composition (δ18O of water and δ13C of ΣCO
2) and salinity data
for the CIVA1 surface samples
Station Latitude (°S) Longitude (°E) Salinity Θ (°C) δ18O (‰) δ13C (‰) 1 68.98 30.13 33.4524 −1.6376 −0.42 0.91 2 68.98 30.08 33.4097 −1.5796 −0.59 1 3 68.99 29.98 33.3987 −1.3862 −0.38 – 4 68.98 29.85 33.715 −0.7996 −0.56 – 5 68.67 29.96 33.7513 −1.0749 −0.46 1.05 6 68.01 30 33.9122 0.2009 −0.53 0.97 8 66.99 29.98 33.8657 0.646 −0.47 0.54 10 66.01 29.99 33.8424 0.8639 −0.61 0.81 11 65.51 29.98 33.8382 0.978 – 0.68 12 65.01 30 33.8243 1.004 −0.47 0.76 13 64.35 30 33.8003 1.106 – 0.81 14 63.68 30 33.8285 1.026 −0.46 0.96 15 63.01 29.99 33.7685 1.266 – 0.87 16 62.34 30 33.5923 1.6909 – 1 17 61.67 30 33.7085 1.551 – 0.92 18 61 30 33.6881 1.7759 −0.49 0.88 19 60.34 29.99 33.6306 1.779 – 0.89
Station Latitude (°S) Longitude (°E) Salinity Θ (°C) δ18O (‰) δ13C (‰) 20 59.68 29.99 33.717 1.8669 – 0.88 21 59.02 30 33.7054 1.8109 – 0.75 22 58.35 29.97 33.5976 2.1938 −0.46 – 23 57.68 29.99 33.7095 2.1798 – 0.78 26 55.68 30 33.9342 2.8325 −0.44 1.04 27 55.01 30 33.8169 2.3613 – 1.36 29 53.68 29.98 33.9538 2.7055 – 0.86 30 53.01 30 33.8815 3.1221 −0.51 – 31 52.33 30.02 33.8802 4.177 – 1.19 32 51.64 29.97 33.8812 4.6461 −0.28 1.32 34 51 29.97 33.8913 4.6703 −0.47 1.21 36 50.35 29.99 33.8451 3.1573 −0.27 – 38 49.68 30.02 33.8755 4.5363 −0.35 0.99 40 49 30.01 33.8919 6.3907 – 1.23 42 48.03 30 34.1661 8.3457 −0.24 1.74 43 47.51 29.98 34.2679 8.8479 – 1.18 44 47.01 30 34.3512 10.1607 −0.1 1.14 45 46.67 30.02 34.2965 9.93 – 1.32 46 46.34 29.98 34.5306 10.8762 – 1.61 47 46 29.99 34.4394 10.8862 – 1.26 48 45.68 29.99 34.6698 11.5325 −0.03 1.33 49 45.38 30 34.4968 10.8949 – 1.47 50 45.01 29.98 34.4389 10.7013 – 1.18 51 44.52 29.98 34.4487 12.0471 – 1.6 52 44.01 29.96 34.4794 12.315 0.04 1.56
Table 2 : CFC-12, oxygen-18 and carbon-13 data for CIVA1 seawater samples. Each sample is listed by station number and depth, together with its potential temperature (θ) and salinity (S) Depth (m) Θ (°C) S F12 (pmol/kg) δ18O (‰) δ13C (‰) Station 5 (68.67°S 29.96°E) 10.1 −1.0749 33.7513 2.94 −0.24 −1.05 20.6 −0.1286 33.8975 2.84 −0.46 1.35 39.1 −0.3232 33.9091 2.82 −0.38 1.24 60.7 −1.6306 34.1131 2.60 −0.48 0.91 80.1 −1.7271 34.1751 2.47 −0.49 – 100.3 −1.7986 34.2010 2.53 −0.53 0.83 198.4 −1.5708 34.2888 2.38 −0.30 0.71 325.5 −0.8186 34.4444 1.67 −0.31 0.57 399.3 0.1062 34.5601 0.99 −0.31 0.38 498.5 0.6585 34.6434 0.55 −0.17 0.35 697.1 0.6859 34.6785 0.34 −0.25 0.31 998.8 0.4346 34.6827 0.21 – 0.31 1345.8 0.1750 34.6735 0.18 −0.10 0.32 1748.2 −0.0280 34.6678 0.18 −0.15 0.25 1996.0 −0.1251 34.6670 0.20 – 0.29 2496.4 −0.2797 34.6622 0.28 −0.23 – 3021.7 −0.4232 34.6590 0.38 −0.08 0.29 Station 6 (68.01°S 30.00°E) 10.2 0.2009 33.9122 2.92 −0.21 0.97 19.9 0.1145 33.9158 2.93 −0.53 1.21 40.0 −0.1182 33.9307 2.86 −0.44 1.27 60.7 −1.7257 34.2924 2.50 −0.51 0.86 81.0 −1.7582 34.3304 2.50 −0.11 0.71 100.6 −1.7636 34.3487 2.47 −0.16 0.80 199.7 −0.5536 34.4732 1.52 0.07 0.60
324.4 0.7518 34.6407 0.46 0.04 0.17 403.2 0.8128 34.6642 0.42 −0.03 −0.02 698.8 0.7136 34.6916 0.23 0.08 0.26 998.8 0.4484 34.6879 0.18 −0.15 0.08 1346.3 0.2066 34.6780 0.13 −0.13 0.34 1747.9 −0.0171 34.6713 0.15 −0.15 0.37 1996.4 −0.1300 34.6672 0.19 – 0.33 2497.6 −0.2729 34.6630 0.24 −0.25 0.38 2997.6 −0.3780 34.6601 0.36 −0.07 0.41 3495.9 −0.4769 34.6562 0.41 −0.06 0.41 3681.3 −0.5667 34.6538 0.40 −0.01 – Station 8 (66.99°S 29.98°E) 10.6 0.6460 33.8657 2.89 0.19 – 20.2 0.6406 33.8655 2.84 −0.47 – 40.0 −1.505 34.2558 2.46 −0.52 – 61.0 −1.6737 34.3407 2.35 −0.45 – 80.8 −1.7041 34.3543 2.36 −0.55 – 100.0 −1.6465 34.3737 2.24 −0.40 – 201.0 0.7616 34.6069 0.61 −0.18 – 322.1 1.1479 34.6803 0.29 −0.27 – 397.5 1.1609 34.6970 0.22 −0.22 – 493.7 1.1169 34.7074 0.16 0.08 – 699.7 0.8876 34.7082 0.15 −0.12 – 997.1 0.5854 34.6986 0.09 −0.24 – 1300.3 0.2866 34.6845 0.16 −0.23 – 1299.9 0.2877 34.6836 0.15 −0.37 – 1595.7 0.1155 34.6753 0.13 −0.40 – 1993.8 −0.0865 34.6692 0.25 −0.24 – 2490.9 −0.2596 34.6639 0.29 0.00 – 3193.9 −0.4247 34.6577 0.39 −0.37 – 3697.2 −0.5206 34.6547 0.42 −0.44 –
4065.9 −0.6265 34.6518 0.36 −0.48 – 4065.7 −0.6255 34.6508 0.36 −0.56 – Station 10 (66.01°S 29.99°E) 13.2 0.8639 33.8424 2.86 −0.56 0.81 23.3 0.8255 33.8495 2.84 −0.61 – 82.4 0.4151 34.5224 1.09 0.10 – 102.0 0.8490 34.5760 0.65 −0.21 – 202.8 1.5142 34.6852 0.20 −0.12 – 324.3 1.4360 34.7080 0.14 −0.16 – 399.1 1.3432 34.7120 0.17 −0.34 – 500.3 1.2390 34.7171 0.11 −0.10 – 698.2 1.0239 34.7164 0.11 −0.21 – 998.1 0.6925 34.7047 0.11 −0.34 – 1350.8 0.3953 34.6916 0.11 −0.32 – 1350.3 0.3963 34.6908 0.09 −0.32 – 1495.7 0.3028 34.6841 0.07 −0.33 – 1995.4 0.0335 34.6748 0.11 −0.22 – 2495.4 −0.1756 34.6665 0.17 −0.39 – 2994.9 −0.3338 34.6613 0.27 −0.39 – 3495.1 −0.4408 34.6601 0.22 −0.34 – 3998.4 −0.5312 34.6553 0.37 −0.37 – 3998.0 −0.5321 34.6552 0.30 −0.58 – 4477.0 −0.6604 34.6524 0.23 −0.44 – Station 14 (63.68°S 30.00°E) 11.0 1.0260 33.8285 2.87 – 0.96 20.8 0.7816 33.8316 2.89 −0.46 1.10 40.5 −0.8856 34.0561 2.76 −0.55 1.07 60.2 −1.5886 34.1637 2.69 −0.41 0.01 79.9 −1.6670 34.1966 2.62 −0.57 1.03 99.5 −1.0753 34.2850 2.22 −0.32 0.79 202.0 1.3446 34.6453 0.35 −0.02 0.02
324.4 1.3472 34.6891 0.20 −0.21 0.23 399.3 1.3442 34.7070 0.16 −0.33 0.19 498.7 1.1963 34.7095 0.15 −0.17 0.26 691.6 1.0014 34.7124 0.11 −0.07 0.38 998.0 0.6657 34.7026 0.09 −0.07 0.19 1347.9 0.3994 34.6928 0.09 −0.27 0.18 2495.2 −0.1687 34.6669 0.11 −0.38 0.25 3493.5 −0.4415 34.6596 0.14 −0.44 0.64 3994.2 −0.5385 34.6572 0.15 −0.41 0.39 3995.0 −0.5386 34.6568 0.14 −0.41 0.30 4491.9 −0.6271 34.6545 0.08 −0.37 – 5092.8 −0.7216 34.6514 0.08 −0.40 0.40 Station 18 (61.00°S 30.00°E) 11.3 1.7759 33.6881 2.83 −0.36 0.88 20.9 1.6254 33.7183 2.85 −0.49 – 80.0 −1.6200 34.1229 2.74 −0.39 – 100.1 −1.6305 34.1397 2.66 −0.03 – 200.0 1.2090 34.5679 0.62 0.04 – 324.4 1.5217 34.6755 0.23 0.05 – 398.9 1.5356 34.7015 0.17 −0.14 – 498.8 1.4363 34.7135 0.10 −0.03 – 698.1 1.2098 34.7208 0.08 0.03 – 998.9 0.8452 34.7100 0.10 0.01 – 1346.3 0.5005 34.6957 0.09 0.01 – 1348.3 0.5003 34.6947 0.07 0.09 – 1495.7 0.3958 34.6901 0.07 −0.16 – 1994.7 0.1193 34.6790 0.08 −0.05 – 2494.0 −0.1077 34.6706 0.09 −0.22 – 2995.5 −0.2888 34.6626 0.10 0.05 – 3495.4 −0.4173 34.6600 0.08 −0.42 – 3993.6 −0.5189 34.6565 0.13 −0.46 –
5228.2 −0.7164 34.6515 0.10 −0.40 – Station 22 (58.35°S 29.97°E) 9.7 2.1938 33.5976 2.80 −0.47 1.41 19.9 2.1963 33.5974 2.78 −0.46 1.46 40.4 2.1712 33.6051 2.76 −0.39 1.43 62.4 −0.2850 33.9609 2.95 −0.52 1.24 82.4 −0.6427 34.0512 2.89 −0.43 0.78 101.5 −0.3753 34.1183 2.76 −0.13 0.83 201.7 0.6828 34.3620 1.57 −0.02 0.51 320.1 1.4822 34.5507 0.58 −0.20 0.30 396.6 1.6254 34.6269 0.34 0.13 0.22 497.7 1.8556 34.6953 0.13 −0.09 0.31 696.3 1.7796 34.7376 0.07 – 0.32 994.9 1.3741 34.7341 0.05 −0.10 0.30 1349.8 0.9444 34.7215 0.09 −0.09 – 1349.3 0.9464 34.7208 0.05 −0.05 0.27 1494.2 0.7931 34.7122 0.06 −0.18 0.27 1998.2 0.3760 34.6897 0.07 −0.18 0.17 2497.0 0.0873 34.6759 0.08 −0.28 – 3000.1 −0.1513 34.6696 0.07 −0.07 0.33 3496.3 −0.3267 34.6598 0.11 −0.22 0.32 3998.1 −0.4552 34.6574 0.11 −0.18 0.42 5371.4 −0.7105 34.6495 0.11 −0.42 0.36 Station 26 (55.68°S 30.00°E) 10.2 2.8325 33.9342 2.67 −0.50 1.04 19.4 2.8249 33.9352 2.67 −0.44 1.48 38.7 2.8278 33.9362 2.67 −0.41 1.48 60.0 2.4319 33.9566 2.71 −0.48 1.33 79.8 0.8511 34.0314 2.75 −0.21 1.23 100.0 0.6233 34.0809 2.58 −0.02 1.10 199.9 1.4017 34.2946 1.27 0.04 0.69
322.6 1.9119 34.4610 0.57 0.03 0.43 392.3 2.0951 34.5489 0.29 0.16 0.30 503.4 2.1331 34.6271 0.15 −0.05 0.31 699.1 2.0807 34.7022 0.07 0.07 0.28 995.4 1.8621 34.7517 0.00 – 0.34 1343.8 1.4918 34.7541 0.04 0.12 0.33 1745.6 0.9319 34.7202 0.06 – 0.35 2244.9 0.4002 34.6911 0.07 0.09 0.26 2994.6 −0.0833 34.6703 0.08 – 0.28 3495.2 −0.2934 34.6633 0.09 0.12 0.31 3994.5 −0.4334 34.6585 0.11 – 0.36 5441.6 −0.7160 34.6503 0.10 −0.06 0.35 Station 32 (51.64°S 29.97°E) 10.9 4.6461 33.8812 2.46 −0.27 1.32 20.2 4.6394 33.8824 2.38 −0.24 1.32 37.7 4.6391 33.8815 2.47 −0.42 1.59 60.9 4.6214 33.8822 2.37 −0.23 1.69 79.2 3.9949 33.9012 2.44 −0.20 1.51 99.3 2.9470 33.9513 2.58 −0.27 1.26 200.9 2.7721 34.1327 1.88 −0.12 0.99 325.9 2.4452 34.2137 1.31 −0.23 0.79 398.6 2.4088 34.2755 0.91 −0.07 0.67 499.8 2.3705 34.3515 0.57 −0.11 0.62 700.5 2.4456 34.5183 0.21 0.01 0.43 996.9 2.3759 34.6628 0.05 0.05 0.39 1345.0 2.2820 34.7661 0.04 −0.05 – 1349.1 2.2678 34.7643 0.03 0.05 0.43 1496.9 2.2403 34.7791 0.00 0.03 0.43 2012.0 1.6977 34.7807 0.00 0.03 0.51 2404.7 1.3461 34.7611 0.03 −0.04 0.42 2746.6 1.2286 34.7657 0.00 0.01 0.54
2994.3 0.8648 34.7290 0.00 −0.08 0.46 3495.4 0.3224 34.6895 0.06 0.02 0.36 4854.7 −0.3832 34.6611 0.08 −0.19 0.50 Station 42 (48.03°S 30.00°E) 7.3 8.3457 34.1661 2.16 −0.28 1.74 18.2 8.3456 34.1642 2.17 −0.24 1.74 40.0 8.3484 34.1660 2.16 −0.40 1.74 58.3 8.3495 34.1671 2.16 −0.23 1.73 76.9 8.5443 34.3887 2.07 – 1.50 97.7 8.2066 34.4798 2.01 −0.11 – 198.5 6.4745 34.3083 2.07 −0.29 1.30 323.4 5.3758 34.2373 1.42 −0.27 1.18 399.0 5.1701 34.2882 – −0.29 1.04 499.0 4.7635 34.3022 1.11 −0.35 1.19 698.3 3.2969 34.2365 1.01 −0.32 0.89 1097.6 2.8633 34.4643 0.22 – 0.56 1351.0 2.5481 34.5625 0.08 −0.21 0.44 1744.4 2.3917 34.6950 0.00 −0.20 – 1992.1 2.2862 34.7487 0.05 – 0.45 2244.3 2.1168 34.7731 – −0.02 – 2745.4 1.7741 34.7923 0.04 0.01 – 2993.6 1.5461 34.7783 0.05 0.01 0.42 3498.3 0.9699 34.7333 0.00 0.00 0.33 3993.9 0.5506 34.7090 0.04 −0.09 – 5060.8 −0.2095 34.6668 0.09 – 0.32 Station 52 (44.01°S 29.96°E) 9.8 12.3150 34.4794 1.82 0.03 1.56 19.4 12.2968 34.4783 1.87 0.04 1.59 39.7 12.0453 34.4526 1.95 0.02 1.56 61.0 11.8357 34.6558 1.86 −0.12 – 82.1 10.0045 34.6431 1.86 −0.13 –
100.5 9.2985 34.5982 1.89 0.09 – 197.4 7.9160 34.4974 1.75 0.09 0.96 323.3 6.3703 34.3396 1.62 −0.18 1.07 398.5 5.8962 34.3536 1.32 −0.02 1.04 499.0 5.1576 34.3321 1.09 −0.05 0.79 698.7 4.0819 34.3287 0.80 −0.18 0.79 1098.2 2.7701 34.4644 0.25 −0.17 0.49 1345.5 2.6602 34.5998 0.12 −0.07 – 1347.4 2.6561 34.6007 0.11 – 0.40 1748.2 2.4683 34.7234 0.00 −0.03 0.27 2244.9 2.2081 34.7934 0.00 0.08 0.58 2995.4 1.6311 34.7894 0.00 0.00 0.58 3496.4 1.0783 34.7521 0.00 −0.03 0.44 4497.9 0.1862 34.6903 0.00 – 0.37 5002.0 −0.1482 34.6705 0.09 −0.18 0.40 5440.7 −0.2290 34.6660 0.09 −0.15 –
The oxygen isotope composition
In the uppermost surface waters, the δ18O values and salinities show latitudinal
gradients (Fig. 4). North of the Subantarctic Front to the Polar Front, δ18O values
decrease from 0.0‰ to −0.4‰ and salinities drop from 34.7 to 33.9 due to dilution by atmospheric precipitations. In the antarctic zone, the δ18O values of AASW remains
around −0.45‰ while salinities are in the range 33.6–33.9 due to the melting of sea ice. At the AD, a slight drop in the δ18O values to −0.6‰ associated with a very small
salinity decrease is probably indicative of a very weak contribution from continental ice melting. South of 69°S, the decrease of δ18O value which is associated with a salinity
Fig. 4. Latitudinal variations of observed δ18O and salinity values in the uppermost
surface waters of the Southern Ocean.
On the δ18O–S diagram (Fig. 5), the signal of Winter Waters (WW) is well defined
by its salinity (34.15 to 34.30) and δ18O value (−0.56‰ to −0.40‰). The other water
masses are also differentiated by their δ18O–S parameters: −0.15‰<δ18O<−0.35‰
and 34.22<S<34.34 for AAIW; −0.18‰<δ18O<0.15‰ and 34.70<S<34.80 for CDW,
the 18O and salinity enrichments being due to the influence of North Atlantic Deep Water
(NADW) in the northern part of the section; −0.28‰<δ18O<−0.42‰ and
34.64<S<34.68 for AABW. This diagram shows a grouping of waters identified as CSBW (Continental Shelf Bottom Water) which have the same salinity as AABW (S=34.66) but higher δ18O values (−0.2 to 0.0‰).
Fig. 5. The δ18O/salinity relationship in the water masses of the Southern Ocean. The
following water masses have been identified: AASW, Antarctic Surface Water; SASW, SubAntarctic Surface Water; WW, Winter Water; CDW, Circumpolar Deep Water; AABW, Antarctic Bottom Water; CSBW, Continental Shelf Bottom Water.
The vertical distributions of δ18O values along the 30°E section (Fig. 6) follows
rather well the general pathways of the main water masses. The AAIW, characterized by δ18O values between −0.2 and −0.3‰ when it sinks at the Polar Front, is advected
northward at a depth of about 800 m. The core of CDW is well recognized by δ18O values
close to 0.0‰ between 2000 and 3000 m; the upwelling of this water mass at the antarctic divergence is marked by the raising of the δ18O=0‰ isoline at immersion
depths of about 1000 m. The AABW, characterized by δ18O values around −0.4‰, lies
below 3500 m. Along the southern margin of Antarctica, a lense of bottom water with maximum values of δ18O≈0.1‰ is observed between 2500 m and 4000 m. This water
mass corresponding to the CSBW, which is not differentiated by its temperature and salinity characteristics, has also been identified by a relative maximum in the CFC-12 concentrations. There is no evidence of local formation of deep water in this area so two hypothesis may be put forward: (1) the water mass comes from the East and corresponds to bottom waters formed near Prydz Bay, (2) the water is formed in the Weddell sea and acquires an intermediate density between the WSBW and the CDW; then, following the topography, this water flows back to the Weddell basin by the Enderby basin. However, further physical measurements would be necessary for a better understanding of the origin and circulation of this deep water mass in this area.
The carbon isotope composition
The variations of δ13C values in the uppermost surface waters (Fig. 7) follow the
main frontal oceanic structures. Strong oscillations are observed north of the Polar Front, separating the 13C-rich waters (1.15‰<δ13C<1.6‰) of the polar front and subantarctic
zones from the 13C-depleted waters (0.5‰<δ13C<0.9‰) of the antarctic zone. The
major drop of δ13C values down to 0.5‰ characterizes the antarctic divergence and is
due to the upwelling of 13C-depleted waters.
Fig. 7. Latitudinal variations of δ13C of ΣCO
2 in the uppermost surface waters of the
Southern Ocean.
Along the 30°E meridional section, the δ13C values exhibit strong latitudinal and
vertical variabilities (Fig. 8). In the subantarctic and polar front zones, the δ13C values
decrease to ≈0.6‰ at 1000 m due to organic matter remineralization; the δ13C values
then remain close to 0.4‰ downward in the water column. The progressive upwelling of
13C-depleted CDW (0.3 to 0.4‰) at the antarctic divergence is responsible for the
decrease of about 0.7‰ in surface waters between the subantarctic and the antarctic zone. Around 4000 m, a local maximum of δ13C values (0.45 to 0.5‰) is observed and
corresponds with a local CFC-12 maximum; identifying a deep lense of better ventilated water.
Fig. 8. Latitudinal distribution of the δ13C values of ΣCO 2.
Conclusions
The distributions of δ13C, δ18O and CFC-12 along the meridian 30°E follow the
general pathways of the main water masses described by temperature and salinity sections. The AASW and SASW are well discriminated by the uppermost δ18O and δ13C
surface values and their mixing occurs in the PF-SAF zone. The sinking of AAIW north of the SAF and the upwelling of CDW at the AD are also well identified by the distribution of these tracers.
These tracers give also new information on the circulation of the water masses in this area. A relative maximum of CFC-12 appears around 4000 m between 66°S and 56°S and is correlated with maximum δ13C values; both observations indicate a higher
ventilation rate than in the surrounding deep waters. Along the continental margin of Antarctica, the bottom waters, between 2500 and 4000 m, are identified by relatively high δ18O values (−0.2‰<δ18O<0‰) and relatively high CFC-12 concentrations,
indicating that this water mass is well ventilated, newly formed and does not come from the downwelling of the superficial waters. This water mass which is not identified by the temperature and salinity parameters may originate either from the Weddell Sea or from Prydz Bay. An extensive study of this region, including physical measurements and geochemical tracer data, would give information on the extension of this newly formed water mass and provide more details on its origin.
Acknowledgements
The CIVA1 cruise took place on board the R/V Marion Dufresne, thanks to the support of the Institut Français des Terres Polaires (IFRTP). We are grateful to all the cruise and to Y. Ballut and B. Ollivier for their valuable assistance. We thank L. Rever and F. Thomas in helping for the CFC measurements and N. Metzl for all the instructive discussions. This work was supported by the WOCE-PNEDC programm.
References
Bullister, J.L., 1984. Atmospheric Chlorofluoromethans as Tracers of Ocean Circulation and Mixing: Measurement and Calibration Techniques and Studies in the Greenland and Norwegian Seas. PhD Thesis, University of California, San Diego, 172 pp.
J.L. Bullister and R.F. Weiss, Determination of CCl3F and CCl3F2 in seawater and air,
Deep-Sea Research 35 (1988) (5), pp. 839–853.
Carmack, E.C., 1977. Water characteristics of the Southern Ocean south of the Polar Front. In: Angel, M. (Ed.), A Voyage of Discovery. Pergamon, pp. 15–41.
H. Craig, Isotopic standards for carbon and oxygen and correction factors for mass-spectrometric analysis of carbon dioxide, Geochimica et Cosmochimica Acta 12 (1957), pp. 133–149.
H. Craig, Standards for reporting concentrations of deuterium and oxygen-18 in natural waters, Science 133 (1961), pp. 1833–1834.
Craig, H., Gordon, L.I., 1965. Deuterium and oxygen 18 variations in the ocean and the marine atmosphere. In: Tongiorgi, E. (Ed.), Stable Isotopes in Oceanographic Studies and Paleotemperatures. Spoleto, Italy, CNR, pp. 9–130.
G.E.R. Deacon, The Weddell gyre, Deep-Sea Research A 26 (1979), pp. 981–995.
S. Epstein and T.K. Mayeda, Variations of the 18O/16O ratio in natural waters, Geochimica
et Cosmochima Acta 4 (1953), pp. 213–224.
T.D. Foster and E.C. Carmack, Frontal zone mixing and antarctic bottom water formation in the Southern Weddell Sea, Deep-Sea Res. 23 (1976), pp. 301–317.
Gordon, A.L., 1971. Oceanography of antarctic waters. In: Reid, J.L. (Ed.), Antarctic Oceanography 1: Antarctic Research Series, Vol. 15. American Geophysical Union, 169– 203.
V.V. Gouretski and A.I. Danilov, Weddell gyre: structure of the eastern boundary, Deep-Sea Research 40 (1993) (3), pp. 561–582.
Jacobs, S.S., Georgi, D.T., 1977. Observations on the southwest Indian/Antarctic ocean. In: Angel, M. (Ed.), A Voyage of Discovery. Pergamon, pp. 43–84.
P. Jean-Baptiste, F. Mantisi, L. Mémery and D. Jamous, 3He and chlorofluorocarbons
(CFC) in the Southern Ocean: tracers of water masses, Marine Chemistry 35 (1991), pp. 137–150.
P.M. Kroopnick, The dissolved O2–CO
2–13C system in the eastern equatorial Pacific,
P.M. Kroopnick, The distribution of 13C of ΣCO
2 in the world oceans, Deep-Sea Research
32 (1985) (1), pp. 57–84.
J.R.E. Lutjeharms and H.R. Valentine, Southern Ocean thermal fronts south of Africa, Deep-Sea Research 31 (1984) (12), pp. 1461–1475.
F. Mantisi, C. Beauverger, A. Poisson and N. Metzl, Chlorofluoromethans in the western Indian sector of the Southern Ocean and their relations with geochemical tracers, Marine Chemistry 35 (1991), pp. 151–167.
A.H. Orsi, W.D. Nowlin Jr. and T. Whitworth III, On the circulation and stratification of the Weddell Gyre, Deep-Sea Res. 40 (1993) (1), pp. 169–203.
Y.H. Park, L. Gamberoni and E. Charriaud, Frontal structure, water masses, and circulation in the Crozet Basin, J. Geophys. Res. 98 (1993) (C7), pp. 12361–12385.
P. Schlosser, R. Bayer, A. Foldvik, T. Gammelsrød, G. Rohardt and K.O. Münnich, Oxygen-18 and helium as tracers of Ice Shelf Water and water/ice interaction in the Weddell Sea, J. Geophys. Res. 95 (1990) (C3), pp. 3253–3263.
P. Schlosser, J.L. Bullister J. and R. Bayer, Studies of deep water formation and circulation in the Weddell Sea using natural and anthropogenic tracers, Mar. Chem. 35 (1991), pp. 97–122.
N.R. Smith, D. Zhaoqian, K.R. Kerry and S. Wright, Water masses and circulation in the region of Prydz Bay, Antarctica, Deep-Sea Res. 31 (1984) (9), pp. 1121–1147.
R.F. Weiss, H.G. Östlund and H. Craig, Geochemical studies of the Weddell Sea, Deep-Sea Res. A 26 (1979), pp. 1093–1120.
T. Whitworth III and W.D. Nowlin Jr., Water masses and currents of the Southern Ocean at the Greenwich Meridian, J. Geophys. Res. 92 (1987) (C6), pp. 6462–6476.