HAL Id: hal-01473795
https://hal.archives-ouvertes.fr/hal-01473795
Submitted on 29 May 2018
HAL is a multi-disciplinary open access
archive for the deposit and dissemination of
sci-entific research documents, whether they are
pub-lished or not. The documents may come from
teaching and research institutions in France or
abroad, or from public or private research centers.
L’archive ouverte pluridisciplinaire HAL, est
destinée au dépôt et à la diffusion de documents
scientifiques de niveau recherche, publiés ou non,
émanant des établissements d’enseignement et de
recherche français ou étrangers, des laboratoires
publics ou privés.
Mediterranean octocoral: Consequences of different
demographic histories?
M. B. Masmoudi, L. Chaoui, N. E. Topçu, Pachka Hammami, Mohamed
Hichem Kara, D. Aurelle
To cite this version:
M. B. Masmoudi, L. Chaoui, N. E. Topçu, Pachka Hammami, Mohamed Hichem Kara, et al..
Con-trasted levels of genetic diversity in a benthic Mediterranean octocoral: Consequences of different
demographic histories?. Ecology and Evolution, Wiley Open Access, 2016, 6 (24), pp.8665-8678.
�10.1002/ece3.2490�. �hal-01473795�
Ecology and Evolution 2016; 6: 8665–8678 www.ecolevol.org © 2016 The Authors. Ecology and Evolution
|
8665 published by John Wiley & Sons Ltd.Abstract
Understanding the factors explaining the observed patterns of genetic diversity is an important question in evolutionary biology. We provide the first data on the genetic structure of a Mediterranean octocoral, the yellow gorgonian Eunicella cavolini, along with insights into the demographic history of this species. We sampled populations in four areas of the Mediterranean Sea: continental France, Algeria, Turkey, and the Balearic and Corsica islands. Along French coasts, three sites were sampled at two depths (20 and 40 m). We demonstrated a high genetic structure in this species (overall
FST = 0.13), and most pairwise differentiation tests were significant. We did not detect any difference between depths at the same site. Clustering analyses revealed four dif-ferentiated groups corresponding to the main geographical areas. The levels of allelic richness and heterozygosity were significantly different between regions, with highest diversity in Algeria and lowest levels in Turkey. The highest levels of private allelic rich-ness were observed in Algeria followed by Turkey. Such contrasted patterns of genetic diversity were not observed in other Mediterranean octocorals and could be the result of different evolutionary histories. We also provide new empirical evidence of contrast-ing results between tests and model- based studies of demographic history. Our results have important consequences for the management of this species.
K E Y W O R D S
Octocoral, Conservation Genetics, demographic history, Mediterranean Sea, Eunicella cavolini, microsatellite
1Aix Marseille Univ, Univ Avignon, CNRS,
IRD, IMBE, Marseille, France
2Laboratoire Bioressources Marines,
Université d’Annaba Badji Mokhtar, Annaba, Algérie
3İstanbul Üniversitesi Su Ürünleri Fakültesi,
İstanbul, Turkey
4CIRAD, UMR CMAEE, Montpellier, France Correspondence
Didier Aurelle, Station Marine d’Endoume, Chemin de la Batterie des Lions, Marseille, France.
Email: didier.aurelle@univ-amu.fr
Funding information
Algerian–French collaboration program, Grant/Award Number: 12MDU853; French National Research Agency (ANR) program Adacni, Grant/Award Number: ANR-12-ADAP-0016; TUDAV (Turkish Marine Research Foundation)
O R I G I N A L R E S E A R C H
Contrasted levels of genetic diversity in a benthic
Mediterranean octocoral: Consequences of different
demographic histories?
Moutassem Billah Masmoudi
1,2| Lamya Chaoui
2| Nur Eda Topçu
3|
Pachka Hammami
1,4| Mohamed Hichem Kara
2| Didier Aurelle
11 | INTRODUCTION
Understanding the factors explaining the genetic diversity of species and populations is a pivotal and long- standing question in popula-tion genetics (Ellegren & Galtier, 2016; Romiguier et al., 2014). In the context of the current global change, studying the genetic diversity of ecologically key species is important for management and conser-vation. Indeed genetic diversity is the fuel of an adaptive response to environmental change, and population genetics aims at estimating
its distribution within and among populations. Romiguier et al. (2014) have demonstrated that life history traits, such as parental investment and fecundity, explain the main differences in diversity levels among metazoans. Inside species, differences in genetic diversity between populations can reflect varying levels of local effective size and gene flow, or particular demographic histories. For example, the latitudinal patterns of genetic diversity for terrestrial species in Europe are often determined by last glacial fluctuations (Hewitt, 2000). In the marine realm, the genetic consequences of quaternary climatic fluctuations
This is an open access article under the terms of the Creative Commons Attribution License, which permits use, distribution and reproduction in any medium, provided the original work is properly cited.
have been studied by Maggs et al. (2008), who proposed a theoretical framework to study glacial refugia and recolonization in North Atlantic benthic species. Their predictions are based on lower levels of genetic diversity after recolonization (a pattern potentially erased by second-ary contacts; Petit et al., 2003). The reconstruction of demographic history, on the basis of sequence polymorphism, also suggested de-mographic expansion for three benthic species following sea- level rise in the Sunda Shelf (Crandall, Sbrocco, Deboer, Barber, & Carpenter, 2011). Nevertheless, the impact of past climatic fluctuations on the current genetic diversity remains to be studied for numerous marine species and oceanic basins.
The Mediterranean Sea is an interesting geographical and envi-ronmental context for the study of the demographic history of marine species. It comprises different basins with different current and past environmental conditions (Hayes, Kucera, Kallel, Sbaffi, & Rohling, 2005). A dozen different biogeographical areas have been described in the Mediterranean Sea which is a biodiversity hot spot (Bianchi et al., 2012). For numerous species, the different basins correspond to differ-ent genetic units (Borsa et al., 1997) which could have evolved more or less independently. The past sea- level variation added additional constraints to marine species, with a level 120 m lower than present at the LGM around French coasts (Hayes et al., 2005; Lambeck & Bard, 2000).
Differences in levels of genetic diversity between basins have been demonstrated in several cases. Reduced levels of genetic diversity have been observed in Adriatic and Black Seas for the sprat Sprattus
sprattus (Limborg et al., 2012), in the Eastern Mediterranean for the
red gorgonian, Paramuricea clavata (Mokhtar- Jamaï et al., 2011), or for deep populations of the red coral, Corallium rubrum (Costantini et al., 2011; but see Cannas et al., 2016). In the seagrass Posidonia
oceanica, higher genetic diversity has been observed in central
pop-ulations, potentially as the consequence of a secondary contact between Western and Eastern populations (Arnaud- Haond et al., 2007). Different approaches allow the study of demographic history which might explain the observed differences in genetic diversity (eg, Beaumont, 1999; Cornuet & Luikart, 1996; Drummond, Rambaut, Shapiro, & Pybus, 2005; Girod, Vitalis, Leblois, & Fréville, 2011; Rogers & Harpending, 1992). In all cases, genetic structure can bias the results and should be taken into account for such approaches (Städler, Haubold, Merino, Stephan, & Pfaffelhuber, 2009).
Octocorals are good models to study patterns of genetic diversity and demographic history in the Mediterranean Sea. Previous studies have identified well- differentiated populations for these sessile spe-cies (eg, Costantini, Fauvelot, & Abbiati, 2007b; Ledoux et al., 2010; Mokhtar- Jamaï et al., 2011). These species present low dispersal abil-ities (Costantini, Fauvelot, & Abbiati, 2007a; Garrabou et al., 2009; Ledoux et al., 2010; but see Martínez- Quintana, Bramanti, Viladrich, Rossi, & Guizien, 2015), and they could be more impacted by sea- level and climatic fluctuations than species with higher dispersal. No clear past demographic fluctuations have been demonstrated for the red coral Corallium rubrum in the Mediterranean Sea (Aurelle et al., 2011; Ledoux et al., 2010) on the basis of tests of mutation–drift equilibrium, but other methods could be more informative (Girod et al., 2011).
We studied here the genetic diversity and the genetic structure of the yellow gorgonian, Eunicella cavolini (Koch 1887) (Figure 1), one of the most abundant gorgonians in the Mediterranean (Weinberg, 1978). E. cavolini was impacted by mortality events linked with thermal anomalies over the past two decades with variable levels of necrosis depending on location, depth, and individuals (Garrabou et al., 2009). Its wide range, from Western Mediterranean to Marmara Sea, allows comparing the history of different basins. Up to now, there was no extended genetic study on this species because of a lack of adequate molecular markers (Calderon, Garrabou, & Aurelle, 2006).
Our aim was to study the genetic diversity of E. cavolini in differ-ent parts of the Mediterranean Sea. First, we will describe the genetic structure of this species at different spatial scales. We include a com-parison between depths to test the differentiation along an environ-mental gradient. We will then test whether populations from different geographical areas present the same levels of diversity and similar demographic histories. We will study past demographic events with tests of mutation–drift equilibrium and with estimates of current and past effective sizes. These results will be useful for the management of this ecologically important species (Ballesteros, 2006).
2 | MATERIALS AND METHODS
2.1 | Sampling
Five hundred and eighty- four individuals of the yellow gorgonian
Eunicella cavolini were sampled by scuba diving from 19 locations
across the Mediterranean Sea. Several regions and sites per region were taken in consideration in order to cover most of the distribu-tion range and to allow the study of genetic structure at distances varying from 20 m to ~2704 km. The main regions considered here were northern (Provence, Corsica, Balearic Islands) and southwestern Mediterranean (Algeria), Aegean Sea, and Marmara Sea (Figure 2). Samples collected from France included individuals collected from different depths, 20 m and 40 m, at the same sites (VED/VES, MEJ/
F I G U R E 1 Yellow sea fan Eunicella cavolini of the Algerian region
MJS, RIS/RID) (Table 1). Small fragments (3–5 cm) were collected randomly (approximately 30 colonies sampled per site) and then pre-served in 95% ethanol at −20°C for further use.
2.2 | Molecular markers
Total genomic DNA was extracted using two methods: either the QIAamp® DNA Mini Kit (Qiagen) following the manufacturer’s
instruc-tions or a salting- out procedure (Mokhtar- Jamaï et al., 2011). All indi-viduals were genotyped at seven microsatellite loci: C21, C30, C40, S14 (Molecular Ecology Resources Primer Development Consortium et al., 2010), Ever007, Ever009 (Holland, Dawson, Horsburgh, Krupa, & Stevens, 2013), Mic56 (This study). All loci were amplified according to the PCR protocols described in Appendix S1. PCR products were ana-lyzed on an ABI 3130 Genetic Analyser using an internal size standard (GeneScan 600 LIZ; Life Technologies). GeneMapper v.4.0 software (Applied Biosystems) was used to score alleles. We estimated null allele frequencies and tested the presence of large allele dropout using MICRO- CHECKER v.2.2.3 (Van Oosterhout, Hutchinson, Wills, & Shipley, 2004). GENCLONE 2.0 (Arnaud- Haond & Belkhir, 2007) was used to calculate the number of distinct multilocus genotypes (MLG) per sample (G). This resulted in the identification of nine duplicated MLGs (Appendix S2, Table S1). For the following analyses, only one representative of each MLG was retained corresponding to a final set of 575 samples.
2.3 | Genetic diversity and tests of panmixia
The genetic diversity was analyzed using GENETIX v.4.05 (Belkhir, Borsa, Chikhi, Raufaste, & Bonhomme, 1996), with observed (Hobs) and unbiased expected heterozygosities (Hexp). Linkage disequilibrium
was tested among all pairs of loci with a permutation test (n = 1000). GENETIX was used to compute single and multilocus FIS on the basis of the estimator of Weir and Cockerham (1984), and its significance was tested with 1000 permutations. The HP- Rare software (Kalinowski, 2005) was used to estimate allelic richness [Ar(g)] and private allelic richness [Ap(g)] with a rarefaction analysis and 18 as minimum sample size. Differences in genetic diversity and allelic richness were tested between groups of populations, using the one- sided probability test implemented in FSTAT 2.9.3.2 software (Goudet, 2001). The groups of populations were defined on the basis of geographical location, and of clustering analyses, and were Turkey, Algeria, France, and islands (Corsica and Menorca).
2.4 | Demographic history
In order to test whether the analyzed population underwent recent population changes, we used two different approaches. First, the null hypothesis of mutation–drift equilibrium was tested using the software BOTTLENECK 1.2.02 (Piry, Luikart, & Cornuet, 1999). The tests were based on 1000 replicates under a two- phase mutation model (TPM) with 95% of the stepwise mutation model (SMM) and variance among multiple steps equal to 12 (Cornuet & Luikart, 1996). Second, we used the MSVAR 1.3 software to evaluate the most prob-able demographic history on the basis of Markov Chain Monte Carlo (MCMC) simulations (Beaumont, 1999). First, we tested the sensitivity of the software to different starting points concerning ancestral and current effective sizes (respectively Nanc and Ncurr) on one population: We used either the same distributions for Nanc and Ncurr, or distribu-tions indicating either reduction or expansion of populadistribu-tions. As this led to similar results indicating population decline (data not shown), we
F I G U R E 2 Map of the 19 Eunicella
cavolini samples (main sites at the
Mediterranean scale). (a) Samples collected at two different depths in the same location are separated by a slash in the French region of Marseille. (b) Samples from the Algerian region of Annaba (black dots)
B A
focused for the main analyses on an approach without a priori, with the same distributions for Nanc and Ncurr. Considering computation time, we analyzed separately a subset of two samples per area: KIA/DDC
(pooled) and SPI for Algeria; MJS and RIS for France; SIV and AYV for Turkey; and MEN and REV for the islands group. The two Algerian samples KIA and DDC were pooled according to a nonsignificant
T A B L E 1 Collecting sites of Eunicella cavolini in the Mediterranean Sea: location name, code, GPS coordinates, depth, and region, N = sample
size, Hobs and Hexp: observed and expected heterozygosities, Na: mean number of alleles per locus, [Ar(18)] and [Ap(18)]: rarefied allelic richness (for N = 18) and private allelic richness, FIS: fixation index, significant values are indicated in bold; G = number of distinct multilocus genotypes per sample, R = genotypic richness, psex (f) = probability of the duplicate genotypes to be the result of sexual reproduction in case of duplicate MLGs
Location name Code GPS coordinates
Depth
(m) Region N Hobs Hexp Na [Ar(18)] [Ap(18)] FIS G R psex (f)
Annaba—Kiane KIA 36° 58.16′N 17–21 Algeria 30 0.62 0.70 8.14 5.44 1.13 0.12 30 1.00
7° 47.4′E Annaba—Espion SPI 36° 58.118′N 18–32 30 0.50 0.61 6.86 4.65 1.05 0.19 30 1.00 7° 46.41′E Annaba—Dent de chien DDC 36°57.00′N 24–27 30 0.58 0.71 8.71 5.64 0.91 0.19 29 0.97 5.53E- 11 7° 42.34′E
Menorca MEN 40° 4′8.44″N 25 Balearic
Islands
26 0.46 0.49 4.57 3.59 0.09 0.06 26 1.00
4° 8′31.60″E
Revellatta REV 42° 35.080′N 15–20 Corsica 34 0.54 0.63 6.14 4.8 0.34 0.14 34 1.00
8° 43.680′E Plane Island (Gulf
of Lion)
POU 43° 11.340′N 15–25 France–
Provence
30 0.37 0.57 4.57 4.13 0.11 0.36 30 1.00
5° 23.130′E
Riou shallow RIS 43° 10.360′N 20 32 0.51 0.58 6.29 4.61 0.03 0.13 32 1.00
5° 23.420′E
Riou deep RID 43° 10.360′N 40 31 0.51 0.58 6.14 4.53 0.09 0.12 31 1.00
5° 23.420′E
Cap Caveau CAV 43° 15.630′N 25 29 0.48 0.56 6.14 4.54 0.12 0.16 29 1.00
5° 17.390′E
Veyron shallow VES 43° 12.414′N 20 30 0.50 0.56 5.71 4.3 0.1 0.1 30 1.00
5° 15.176′E
Veyron deep VED 43° 12.414′N 40 30 0.51 0.63 5.71 4.46 0.09 0.18 30 1.00
5° 15.176′E
Méjean shallow MJS 43° 19.700′N 18–20 33 0.52 0.54 6.43 4.41 0.14 0.05 33 1.00
5° 13.480′E
Méjean deep MEJ 43° 19.700′N 30–40 31 0.47 0.54 6.00 4.53 0.15 0.12 31 1.00
5° 13.480′E Somlit SOM 43° 14.050′N 58 31 0.47 0.54 5.00 3.89 0.04 0.12 30 0.97 0.006 5° 17.050′E Saména SAM 43° 13.780′N 10 34 0.44 0.50 4.43 3.66 0.06 0.13 33 0.97 0.002 5° 20.880′E La Ciotat—3PP Cave 3PP 43° 9.795′N 15 30 0.34 0.54 4.57 3.66 0.09 0.38 30 1.00 5° 36.000′E Porquerolles – SAR 42° 59.272′N 40 32 0.47 0.53 5.86 4.42 0.06 0.11 32 1.00
Sec de Sarraniers 6° 17.503′E
Ayvalık AYV 39° 33.541′N 30–34 Turkey–
Aegean Sea 30 0.43 0.44 3.43 2.84 0.64 0 25 0.83 4.59E- 08; 2.25E- 12; 0.0003; 0.0003; 0.0002 26° 586′E
Sivriada SYV 40°52′26.15″N 34–38 Turkey–
Marmara Sea
30 0.32 0.34 3.00 2.45 0.39 0.07 29 0.97 2.79 E- 06
differentiation comparison (see results). For continental France, the two retained samples corresponded to two depths and sites, and gave different results with BOTTLENECK. We also analyzed each region separately by grouping the corresponding population samples. In order to evaluate the impact of mutation model on the obtained results, we analyzed the results for the seven loci separately in the Algerian region. As genetic structure can impact the results of MSVAR analysis, an analysis at the deme level inside the French region was launched using two population samples in that region. We also pooled two individuals from the 12 population samples (total: 24 individuals) from the Marseille area, as an approximation to the method proposed by Chikhi, Sousa, Luisi, Goossens, and Beaumont (2010). This was not done in other areas because of a reduced number of independent samples. The parameters used for the MSVAR analyses are provided in Appendix S1 (Tables S2 and S3). We ran four independent chains with identical priors and starting values for each region. Each chain led to 20 000 lines of output. We tested the convergence of the MCMC chains with the Brooks, Gelman, and Rubin statistic (Brooks & Gelman, 1998; Gelman & Rubin, 1992). Values of the multivariate Gelman and Rubin’s convergence diagnostic between 1.0 and 1.1 indicate reason-able convergence, whereas values >1.1 indicate poor convergence. In this regard, the last 10 000 output lines of each chain were retained to make a combined consensus chain of 40 000 data points for each region, which was assumed to summarize the posterior distribution of Nanc and Ncurr (Storz & Beaumont, 2002). The output of MSVAR was analyzed by focusing on the detection and on the direction of demographic changes (expansion or contraction). We also compared the magnitude of changes between regions using both natural (Ncurr,
Nanc) and scaled parameters (θcurr = 4Ncurrμ, θanc = 4Nancμ) over the four replicated data sets. All outputs were analyzed with the R CODA package (Plummer, Best, Cowles, & Vines, 2006).
2.5 | Genetic structure
Pairwise FST were calculated with GENETIX according to Weir and Cockerham (1984). Their significance was tested with 1000 permuta-tions. The excluding null allele (ENA) method in FreeNA (Chapuis & Estoup, 2007) was used to calculate pairwise FST to avoid potential bias induced by null alleles. As a complementary estimate of genetic differentiation, we computed the Jost’s D statistic (Jost, 2008) with the SMOGD software (Crawford, 2010).
The pattern of isolation by distance (IBD) at the Mediterranean scale and within French region only (thanks to the number of samples in this region) was tested through the correlation between FST/(1- FST) and the logarithm of geographical distances (shortest distance by sea) between populations (Rousset, 1997). The correlation was tested with a Mantel test (n = 10 000 permutations) in IBDWS 3.16 (Jensen, Bohonak, & Kelley, 2005).
An analysis of molecular variance (AMOVA) was performed with
FST and RST estimators with ARLEQUIN v.3.5 (Excoffier & Lischer, 2010) and by using the main geographical areas as groups, that is, Turkey, Algeria, continental France, and Menorca and Corsica islands. For these last two islands, we conducted the AMOVA both by separating
and by grouping them, as the STRUCTURE analysis grouped them (see results). One thousand permutations were used to test the significance of the different estimates of fixation indices of the AMOVA.
The relationships between populations were further investigated using principal coordinate analysis (PCoA) with GenAlEx 6.5 (Peakall & Smouse, 2006, 2012) using pairwise population matrix of Nei’s unbi-ased genetic distance (Nei, 1972).
A clustering analysis was performed with the Bayesian method implemented in STRUCTURE v.2.2 (Falush, Stephens, & Pritchard, 2003, 2007; Pritchard, Stephens, & Donnelly, 2000) launched with admixture model, 500 000 iterations after a burn- in period of 50 000, and 12 replicates for each configuration. A first round of analyses was launched with the whole data set to assess structure at the Mediterranean scale with K varying from 1 to 16. A second round of analyses was performed on each genetic group depicted by the initial round with the same parameter set of the first round, and K varying from 1 to 12 for France, and 1 to 5 in other cases. The outputs were analyzed through the STRUCTURE HARVERSTER website (Earl, 2012) to choose the value that captured the major structure in the data. The number of clusters was estimated based on the Delta (K) criterion (Evanno, Regnaut, & Goudet, 2005).
Results for each K value were merged with CLUMPP v.1.1 (Jakobsson & Rosenberg, 2007), and DISTRUCT v.1.1 (Rosenberg, 2004) was used to visualize these results.
To analyze genetic structure without relying on the model imple-mented in STRUCTURE, we performed a discriminant analysis of principal components (DAPC; Jombart, Devillard, & Balloux, 2010) implemented in the adegenet R package (Jombart, 2008). Data were analyzed in two rounds, one with all samples and a second round with French samples only. The number of clusters was determined based on the Bayesian information criterion (BIC).
In all cases, for multiple tests, significance levels were corrected using a 5% false discovery rate (FDR) (Benjamini & Hochberg, 1995).
3 | RESULTS
3.1 | Genetic diversity
The total number of alleles per locus ranged from eight for Ever007 to 40 for Mic56 and a mean value of 18 alleles (Table 1). No evidence for null alleles, large allele dropout, or scoring errors due to stutters was found using MICRO- CHECKER. No significant linkage disequilib-rium among loci was generalized among populations (p > .05 after FDR correction). Observed and unbiased expected heterozygosities ranged from 0.31 for SIV to 0.62 for KIA, and from 0.34 for SIV to 0.71 for DDC, respectively (mean values: 0.48 and 0.56, respectively) (Table 1). Over all loci, significant heterozygote deficiencies were found in 15 samples of 19 (after FDR correction) with multilocus FIS values ranging between 0 for AYV and 0.38 for 3PP (mean: 0.14; Table 1). Polymorphism data per locus and population are detailed in Appendix S2 and Table S2. Allelic richness Ar(18) ranged from 2.45 for SIV (Turkey) to 5.64 for DDC (Algeria; Table 1) and private allelic richness Ap(18) from 0.03 for RIS (Marseille) to 1.13 for KIA (Algeria). Turkish populations
presented significantly lower expected heterozygosities and allelic richness compared to other groups of samples, with Hexp = 0.44 for AYV and 0.34 for SIV, and Ar = 2.6 for the Turkish group, compared to 4.2 for Marseille and the group of Menorca and Corsica islands, and 5.2 for Algeria (Table 2). The two groups of Marseille and of Menorca and Corsica islands showed significantly lower genetic diversity than Algeria, which was the most diverse area for all criteria.
3.2 | Demographic fluctuations
The analysis of departure from mutation–drift equilibrium using BOTTLENECK indicated no significant heterozygosity excess, expected following a bottleneck, on the basis of one- tailed Wilcoxon test (Table 3). On the other hand, significant heterozygosite defi-ciency, expected after population expansion, was detected in 10 samples over 19, and nine tests remained significant after FDR cor-rection. These signals of expansion were observed in five over twelve northern populations (Marseille) and in Algeria and Balearic Islands. Contrastingly, MSVAR results indicated a strong historical decline for all the analyzed samples whether separately (Appendix S3, Figure S1, Table S1) or pooled per region (Figure 3; Appendix S3, Table S2). At the region level, the inferred Nanc/Ncurr reached 104 in Turkey and
around 2 × 10³ in Algeria (Appendix S3, Table S2). When
consider-ing the scaled parameters, the current value of θ = 4Neμ was again highest in Algeria, intermediate in France and islands, and lowest in Turkey. The θ estimate was ten times higher in Algeria than in Turkey (0.21 vs 0.02, respectively; Table 4; Appendix S3, Figure S2). Current effective sizes were also lower in Turkish samples than in other sam-ples at deme level (mean values: 0.78 for AYV, and 0.67 for SIV; Appendix S3, Table S1). In the French region with a pool of 24 indi-viduals, two for each site, results also indicated a population decline, but at a lower intensity than with the regional analysis with two demes (Nanc/Ncurr around 300 and 9 × 10³ for the pool and the regional
anal-ysis, respectively; Appendix S3, Table S3, Figure S3). The inference of demographic decline was coherent along all our loci in the Algerian
area, all indicating signatures of population declines (Appendix S3, Figure S4, Table S4).
3.3 | Genetic structure
Pairwise FST values ranged from 0 (KIA vs DDC; RID vs RIS; POU vs RID; POU vs RIS) to 0.36 (SAR in France vs SIV in Turkey; Appendix
T A B L E 3 Tests of mutation–drift equilibrium in E. cavolini with
BOTTLENECK Pop Probability Region Hdef Hexc KIA 0.00 1.00 Algeria SPI 0.02 0.98 DDC 0.01 0.99
MEN 0.02 0.99 Balearic Islands
REV 0.23 0.81 Corsica CAV 0.00 1.00 France—Provence MEJ 0.02 0.99 MJS 0.01 1.00 POU 0.05 0.96 RID 0.19 0.85 RIS 0.41 0.66 SAM 0.05 0.96 SOM 0.02 0.99 VED 0.05 0.96 VES 0.04 0.97 3PP 0.05 0.96 SAR 0.01 0.00 AYV 0.36 0.72 Turkey SIV 0.50 0.59
p values for the one- tailed Wilcoxon test for heterozygosity excess (Hexc)
and deficiency (Hdef). Significant values in bold.
Comparison
Observed values One- sided p- values (G1 > G2) Allelic richness Hobs Hexp Allelic richness Hobs Hexp
Algeria 5.2 0.57 0.68 0.014 0.01 0.008 France 4.3 0.47 0.56 Algeria 5.2 0.57 0.68 0.001 0.001 0.001 Turkey 2.6 0.38 0.39 Algeria 5.2 0.57 0.68 0.085 0.199 0.094 Islands 4.2 0.51 0.57 France 4.3 0.47 0.56 0.004 0.043 0.004 Turkey 2.6 0.38 0.39 France 4.3 0.47 0.56 0.455 0.775 0.584 Islands 4.2 0.51 0.57 Islands 4.2 0.51 0.57 0.02 0.027 0.015 Turkey 2.6 0.38 0.39 T A B L E 2 Differences in genetic
diversity and allelic richness between groups of populations, using one- sided probability test (G1 indicates the diversity of the first region and G2 of the second region)
S2, Table S3) with an overall FST = 0.13. All populations were signifi-cantly differentiated except KIA and DDC (Algeria) that are separated by a distance of 721 m, and in Marseille for samples from the same site but different depths (MEJ vs MJS, VES vs VED, and RID vs RIS). A
sample from Marseille (POU) with 25% missing data showed also five nonsignificant differentiation tests (POU vs VES/VED, POU vs RID/ RIS, and POU vs 3PP) after FDR correction. Pairwise FST values cor-rected for null alleles showed similar values of differentiation between
T A B L E 4 Scaled parameter estimates (θcurr = 4Ncurrμ, θanc = 4Nancμ, t = T(2Ncurr)) in four regions of the Mediterranean.
Algeria France Islands Turkey
θcurr θanc t θcurr θanc t θcurr θanc t θcurr θanc t
Mean 0.21 398.11 5.25 0.04 380.19 10.96 0.04 389.05 12.59 0.02 147.91 20.89
Media 0.22 407.38 5.25 0.04 398.11 11.22 0.04 407.38 12.88 0.03 154.88 20.89
SD 2.24 1.35 1.41 2.69 1.58 1.62 2.51 1.48 1.35 3.63 2.14 1.58
F I G U R E 3 Marginal posterior density of current and ancestral population size in four regions of the Mediterranean. Densities are expressed
in a log10 scale 8 10 6 4 2 0 –2 0 500 1,000 1,500 2,000 2,500 3,000 3,500 Fr equenc y Population size 8 10 6 4 2 0 –2 Population size 8 10 6 4 2 0 –2 Population size 8 10 6 4 2 0 –2 Population size 0 500 1,000 1,500 2,000 2,500 Fr equenc y 0 500 1,000 1,500 2,000 2,500 3,000 Fr equenc y 0 500 1,000 1,500 2,000 2,500 3,000 Fr equenc y Algeria France Islands Turkey (Ncurr) (Nanc) (Ncurr) (Nanc) (Ncurr) (Nanc) (Ncurr) (Nanc)
samples (Appendix S2, Table S4). The smallest geographical distance for which significant genetic differentiation was observed was 763 m, with FST = 0.02 for KIA vs SPI.
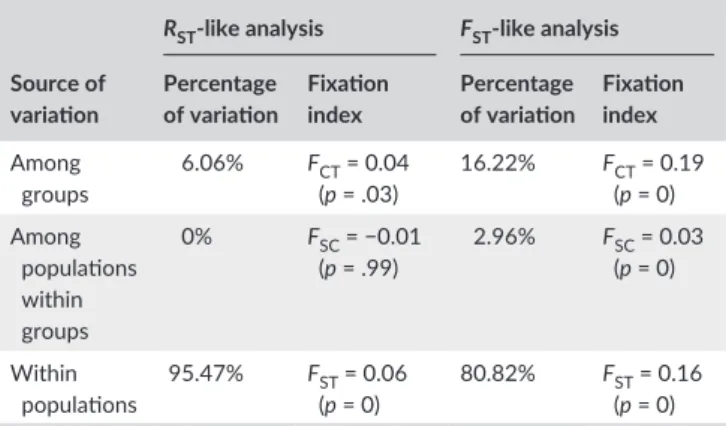
The AMOVA indicated significant differences between geographi-cal groups of samples, both by separating the two islands (Table 5) and by grouping them (Appendix S2, Table S5). For the analysis separating the two islands, differences among groups were significant (FCT = 0.19 and FCT = 0.04 with FST- like and RST- like analyses, respectively; Table 5). The differences between populations within groups appeared significant with FST but not significant with RST (FSC = 0.03 and −0.01, respectively). A significant positive correlation was evident between genetic distances and the logarithm of the geographical distances, indicating a pattern of IBD at the Mediterranean scale (R² = .567,
p < .0001; Appendix S2, Figure S1) and within the French region
(R² = .169, p = .009; Appendix S2, Figure S2). At the global scale, the IBD pattern seemed to be separated in two parts with a lower slope at short distance compared to a much higher slope at higher distances.
The principal coordinate analysis (PcoA) confirmed the distinc-tiveness of the different geographical areas: Axis 1 separated Algeria from other samples, while axis 2 separated Turkey from other ones (Figure 4). Island samples (Balearic and Corsica) appeared closer to French samples than to other areas but well separated from them.
3.4 | Clustering analysis
The first round of STRUCTURE with K = 2 separated samples from Algeria and Turkey in cluster 1 and samples from France, Menorca, and Corsica in cluster 2 (Figure 5). For K = 3, samples from France, Menorca, and Corsica were assigned to cluster 1, while samples from Algeria and Turkey were separated in two different clusters (2 and 3, respectively). At K = 3, four replicates over twelve grouped Algerian and Turkish samples and were not retained here. For K = 4, samples from islands Menorca and Corsica were assigned to a new group, while other samples were clustered as above but with France partly admixed with the islands cluster (Figure 5). The Delta(K) criterion indicated K = 5 as the best clustering solution (Appendix S2, Figure S3). With K = 5, Algerian samples were in cluster 1, Menorca and Corsica in cluster 2, Turkey in cluster 3 and all French samples subdivided between clusters 4 and 5 but with high admixture between these two putative clusters.
For the second STRUCTURE analysis on French samples, K = 3 was the best solution followed by K = 6 (Appendix S2, Figure S4), but there was no clear genetic structuring (Appendix S2, Figure S5). A STRUCTURE analysis on Turkish samples alone indicated a clear separation of both populations at K = 2 (Appendix S2, Figure S6). The STRUCTURE analysis on Menorca and Corsica samples indicated a distinction between these two islands but with quite high levels of admixture (Appendix S2, Figures S7 and S8).
For the DAPC analysis, the Bayesian information criterion (BIC) was minimal between K = 15 and 21 but without a single clear infor-mative value (Appendix S2, Figure S9). We present here the results obtained with K = 15 clusters, and other analyses around this value gave similar results. Higher K values did not bring more information on the general structure at the Mediterranean scale. The analysis con-firmed the main groupings evidenced with STRUCTURE but with the additional separation between the two Turkish samples from Marmara Sea and Aegean Sea in clusters 11 and 14, respectively (Figure 6). Samples from Algeria were assigned to clusters 2 and 7. The two sam-ples of Menorca and Corsica were mainly grouped in clusters 5 and 15, respectively, while French samples were mainly assigned to the remaining clusters (Table 6). High percentages (>0.70) of reassignment to the original clusters were observed apart from clusters 1, 4, and 10 corresponding to samples from France (Appendix S2, Table S6). A
F I G U R E 4 Plot of the first two axes
from the principal coordinate analysis based on Nei’s unbiased genetic distance. Percentage of variation explained by axis 1: 51.1. and by axis 2: 22
TABLE 5 Results of AMOVA. The groups of populations were
defined on the basis of geographical location and of clustering analyses and were Turkey, Algeria, France, and islands (Corsica and Menorca)
Source of variation
RST- like analysis FST- like analysis Percentage of variation Fixation index Percentage of variation Fixation index Among groups 6.06% FCT = 0.04 (p = .03) 16.22% FCT = 0.19 (p = 0) Among populations within groups 0% FSC = −0.01 (p = .99) 2.96% FSC = 0.03 (p = 0) Within populations 95.47% F (p = 0)ST = 0.06 80.82% F (p = 0)ST = 0.16
The significance of the different parameters was tested with permutations (n = 1000 of each analysis).
second DAPC analysis on French samples only did not indicate any clear additional substructuring (Appendix S2, Figures S10 and S11).
4 | DISCUSSION
We have demonstrated (1) strong genetic structure between sam-ples from different regions in the Mediterranean, (2) we did not observe any significant differentiation between depths for a given site in France, and (3) we have shown significant differences in the levels of genetic diversity between regions with the highest values in
southwestern Mediterranean (Algeria) and the lowest in the eastern part (Turkey), which could be correlated to different evolutionary his-tories or levels of effective sizes.
4.1 | Genetic structure of E. cavolini and comparison
with other Mediterranean octocorals
We identified four main clusters corresponding to geographical sub-divisions: northwestern Mediterranean, Balearic and Corsica islands, and Algeria and Turkish samples. These differences between regions were statistically significant. These results can be discussed in the more general context of the biogeography of the Mediterranean Sea.
FST values indicated that the highest differentiation was observed between eastern (Turkish) and western populations and differentia-tion was higher when comparing western samples with Marmara Sea (mean FST = 0.3) than with Aegean Sea (mean FST = 0.22). Such deep genetic break between eastern and western Mediterranean popula-tions has been reported in various species such as fish, molluscs, or the seagrass Posidonia oceanica (Arnaud- Haond et al., 2007; Bahri- Sfar, Lemaire, Hassine, & Bonhomme, 2000; Nikula & Väinölä, 2003). An east–west divergence has been observed for the octocoral P. clavata but with only one sample in the eastern basin (Mokhtar- Jamaï et al., 2011). The Siculo- Tunisian strait is indeed considered as an impor-tant genetic boundary for various marine species (Borsa et al., 1997). Concerning E. cavolini, the strong differentiation between eastern and western Mediterranean samples could be explained by several poten-tial oceanographic barriers, including the Siculo- Tunisian strait, but their exact location remains to be studied (Berline, Rammou, Doglioli, Molcard, & Petrenko, 2014). Additionally, the gaps in the distribution range of E. cavolini between Turkey and Algeria could contribute to this differentiation (Sini, Kipson, Linares, Garrabou, & Koutsoubas, 2014). Isolation by distance could lead to the identification of well- separated clusters as well, if distant populations are analyzed without geographical intermediates (Aurelle & Ledoux, 2013).
F I G U R E 5 Bar plot from the first round of analysis with STRUCTURE, revealing population structure of Eunicella cavolini at the
Mediterranean scale with retained values of K = 2, 3, 4, and 5. One bar corresponds to one individual, and the colors correspond to the different clusters. The proportion of color for each individual corresponds to its membership probabilities for the corresponding clusters
F I G U R E 6 Results of the DAPC analysis of Eunicella cavolini
with K = 15 genetic clusters. Main regions of the Mediterranean are separated by different colors. Green corresponds to Turkish samples, purple to Algerian samples, blue to French samples, and red to the samples from Corsica and Menorca
The North/South differentiation evidenced here has not often been observed in Mediterranean phylogeographic studies but has been tested in three other Mediterranean octocorals. For P. clavata, the southern samples appeared well differentiated from northern ones. But these southern samples were also situated on the western side of the Almeria–Oran front which might contribute to this differen-tiation (Mokhtar- Jamaï et al., 2011). For C. rubrum, northern samples appeared well separated from southern ones (Algeria and Morocco, including samples from the Atlantic side of the Almeria–Oran front; Aurelle et al., 2011). Conversely, the Algerian populations of E.
sin-gularis were partly related to northern samples of the French coasts
(near Spain; Cataneo, 2011). The discrepancy between E. singularis and
E. cavolini might be related to a lower number of loci in the former
compared to our study (five compared to seven), or to intrinsic differ-ent patterns of genetic structure. Here again, the distribution range of E. cavolini could partly explain these differences between E.
sin-gularis and E. cavolini: There is a notable absence of E. cavolini along
Mediterranean Spanish coasts. This could have promoted a North– South coastline connectivity for E. singularis which is more frequent there (Sini et al., 2014). The genetic structure of E. cavolini should be studied along the Italian coasts to test the possibility of connectivity by this way. This North–South differentiation could also correspond to a particular isolation of Algerian populations because of mesoscale eddy systems as proposed for the dusky grouper Epinephelus
margina-tus (Schunter et al., 2011). Nevertheless, this hypothesis alone would
not explain the contrasted results obtained for different Eunicella
species. In all cases, our results and most previous studies point to the genetic distinctiveness of southern octocoral communities.
The samples from Balearic (Menorca) and Corsica islands were identified as a separate cluster without substructure (Appendix S2, Figure S8). The FST between these samples was significant but lower than those observed for some comparisons in the Marseille area for example. The grouping of Menorca samples with Corsica was not con-sistent with the Mediterranean current clusters defined by Berline et al. (2014). The geographical distance and lack of shallow benthic habitats between them are additional factors which could promote divergence. Accordingly, clustering analyses on other octocorals (C. rubrum and
P. clavata) displayed a genetic distinction between Balearic Islands and
Corsica (Ledoux et al., 2010; Mokhtar- Jamaï et al., 2011). The results obtained for E. cavolini could point to a recent divergence between island populations from a common ancestral population.
The Turkish samples from Marmara Sea and Aegean Sea appeared strongly differentiated according to FST value (0.24) and to DAPC. This was not visible with the global STRUCTURE analysis probably because of the reduced number of Turkish samples analyzed. Indeed unbal-anced sampling affects such clustering method (Aurelle & Ledoux, 2013). However, the STRUCTURE analysis on Turkish samples alone clearly identified a genetic break here. A genetic differentiation between Black Sea and the Mediterranean Sea has been demon-strated for example for the mussel Mytilus galloprovincialis (Ladoukakis, Saavedra, Magoulas, & Zouros, 2002), or the anchovy Engraulis
encra-sicolus (Magoulas, Castilho, Caetano, Marcato, & Patarnello, 2006).
T A B L E 6 Results of population assignments in 15 clusters using DAPC analysis
Clusters N 1 2 3 4 5 6 7 8 9 10 11 12 13 14 15 Algeria KIA 1 10 0 0 0 0 15 0 0 0 0 0 0 1 3 30 SPI 0 13 0 0 1 0 15 0 0 0 0 0 0 0 1 30 DDC 0 9 0 0 1 0 16 0 0 0 0 0 0 2 1 29 Islands MEN 1 1 0 0 6 0 0 0 0 0 0 0 2 0 16 26 REV 4 0 0 2 8 4 2 2 0 1 0 0 1 0 11 35 France CAV 4 0 6 4 4 5 0 0 0 0 0 5 1 0 0 29 MEJ 7 0 0 4 2 2 0 3 2 2 0 6 2 0 1 31 MJS 6 1 0 4 4 3 0 1 0 4 0 4 6 0 0 33 POU 7 0 2 4 7 0 0 3 1 4 0 0 2 0 0 30 RID 3 0 5 5 0 2 0 1 7 1 0 0 5 0 2 31 RIS 2 0 1 5 6 1 0 1 6 3 0 3 1 1 2 32 SAM 0 0 2 0 2 8 0 3 11 1 0 2 2 0 1 32 SOM 7 0 5 1 4 4 0 4 0 0 0 0 0 3 2 30 VED 7 0 3 6 2 0 0 2 0 5 0 0 1 1 3 30 VES 5 0 4 4 4 1 0 2 0 2 0 0 3 1 4 30 3PP 2 0 1 3 2 2 0 9 1 9 0 0 0 0 1 30 SAR 9 1 2 5 2 6 0 0 1 2 0 4 0 0 1 33 Turkey AYV 0 0 0 0 1 0 0 0 0 1 0 0 0 23 0 25 SIV 0 0 0 0 0 0 0 0 0 0 25 0 0 4 0 29 N, number of individuals.
Nevertheless, in most cases, the precise location of the genetic break could not be determined, especially its position relative to the Marmara Sea which connects Black Sea and Aegean Sea. Here, we demonstrate an important genetic differentiation between the Marmara Sea and the Aegean Sea for E. cavolini. The Marmara Sea presents a particular circulation pattern with shallow, low- salinity, waters coming from the Black Sea and deeper salty waters coming from the Mediterranean (Beşiktepe et al., 1994). This, along with the strait systems delimiting the Marmara Sea, provides a strong isolating factor for octocorals, which are restrained to deeper locations.
In all cases, considering the important differentiation observed between some of these clusters, especially the eastern–western dif-ferentiation, genetic incompatibilities may contribute to the observed differentiation as well (Bierne, Welch, Loire, Bonhomme, & David, 2011). Genome scan approaches would be useful here to go further on this topic.
4.2 | Genetic structure at regional and local scales
In the Marseille area, the maximum pairwise FST reached 0.07 for pop-ulations separated by 15 km. Such local genetic structure has been demonstrated for other octocorals in this area, with maximum FST reaching 0.2 for C. rubrum (Ledoux et al., 2010) and 0.1 for P. clavata (Mokhtar- Jamaï et al., 2011). This has been linked to reduced disper-sal abilities of the larval stage in Mediterranean octocorals (Martínez- Quintana et al., 2015). In E. verrucosa, the lecithotrophic larvae are supposed to have a short, but unknown life span (Sartoretto & Francour, 2011). In E. singularis, experimental results indicated that in the presence of favorable substrates, settlement could take place in less than 30 hr (Weinberg & Weinberg, 1979). If similar larval traits are present in E. cavolini, this could explain, along with important genetic drift, our observation of a strong local genetic structure.
No significant differentiation was evidenced between samples from different depths within the same sites near Marseille as observed in a preliminary study (Pivotto et al., 2015). This suggests the occur-rence of regular gene flow or low genetic drift that leads to a genetic homogeneity between depths. This was also observed for E. singularis (Cataneo, 2011), but it contrasts with previous findings of genetic structure between depths for C. rubrum (Costantini et al., 2011; Ledoux et al., 2010) and P. clavata (Mokhtar- Jamaï et al., 2011). Such differences between species could be linked to the buoyancy or the vertical movements of the larvae of these species. The precise timing of larval release, relative to the onset of thermocline, could explain these results and would require a precise study of phenology accord-ing to water stratification. The observation of a lack of genetic differ-entiation between depths despite clear thermotolerance differences questions the possibility of local adaptation in E. cavolini (Pivotto et al., 2015). In the Carribean octocoral Eunicea flexuosa, adaptation to different depths coincided with distinct genetic lineages (Prada & Hellberg, 2013). For E. cavolini, an intron locus seems to indicate signif-icant differences according to depth and could be linked to a selected polymorphic locus (Aurelle et al. submitted). It will thus be necessary to study more loci to test for possible genetics–environment associations.
4.3 | Contrasting results between BOTTLENECK and
MSVAR approaches
Concerning demographic history, BOTTLENECK tests and esti-mates of past versus current effective sizes gave contrasting results. Whereas BOTTLENECK indicated either no demographic fluctuation or population expansion, the MSVAR approach suggested a general-ized population decline with different strengths. Such discrepancies between these two methods have been demonstrated by Girod et al. (2011): In a simulation of population decline, these authors observed that MSVAR could indeed detect the correct demographic change, but in some simulation cases with the oldest changes, BOTTLENECK suggested a population expansion. We provide here additional empiri-cal evidence of contrasting results between tests and model- based studies of demographic history. The MSVAR analysis can lead to false inferences of population decline in cases of strong departures from a stepwise mutation model (SMM; Girod et al., 2011; Faurby & Pertoldi, 2012) or in case of underlying genetic structure (Chikhi et al., 2010). Concerning departures from SMM, the inference of demographic decline was coherent along all our loci which present different levels of variability and distributions of allele sizes. Regarding genetic struc-ture, the analysis at the deme level inside regions gave similar results to pooled samples, but the analysis of a single deme can lead to spuri-ous inference of decline as well (Chikhi et al., 2010). A decline, though less strong, was also inferred for a pool of individuals scattered along different demes as suggested by Chikhi et al. (2010). These obser-vations suggest that E. cavolini populations were indeed impacted by a demographic decline, but the estimates of the magnitude of this decline may be biased by population structure. As suggested by Faurby and Pertoldi (2012), we focus the following interpretation of MSVAR results on the inferred relative levels of current effective size. At the deme level, the inferred current effective sizes were much lower in Turkey samples than in other Mediterranean areas.
4.4 | Genetic diversity and inferences on
evolutionary history
E. cavolini is a high diversity species among metazoans (Romiguier
et al., 2014). We evidenced here that this diversity is highly hetero-geneous among regions as a potential result of differences in effec-tive sizes, a result which remained robust when considering estimates of scaled effective size. Turkish samples displayed the lowest levels of genetic diversity, whereas Algerian samples displayed the highest diversity (a twofold difference in allelic richness and a 42% reduction in expected heterozygosity in Turkey compared to Algeria).The lower reduction in heterozygosity compared to allelic richness is expected as a loss of rare alleles has a higher impact on the latter. Differences in the levels of genetic diversity between populations can be the con-sequence of different evolutionary histories (eg, bottleneck) and on differences in effective size for a same history. The lowest levels of genetic diversity in Turkey can be discussed according to the peculiar history of the Marmara Sea. Several scenarios of connection between Black Sea and Mediterranean Sea after the last glacial maximum have
been proposed. Ryan et al. (1997) suggested that during the last gla-cial maximum, the Black Sea became a giant freshwater lake and that the Mediterranean Sea refilled it. A second hypothesis suggested that it was instead the Black Sea that first breached the Bosphorus and overflowed into the Marmara Sea (Aksu et al., 2002). In both cases, they imply recent colonization events for the Marmara Sea and possi-bly for the neighboring part of the Aegean Sea. A reduced diversity of Turkish populations compared to Western Mediterranean populations has also been observed in the red gorgonian P. clavata, but with only one Turkish population considered (Mokhtar- Jamaï et al., 2011). The population density of E. cavolini in the neighboring northern Aegean is also lower than in western Mediterranean, and recruitment frequency seems reduced in eastern populations as well (Sini, Kipson, Linares, Koutsoubas, & Garrabou, 2015). This agrees well with our inferences of lower current effective size and lower diversity in this area. The high level of private allelic richness (second after Algeria) in this area also points to an historical isolation of these populations (Waples, 2010) which could have strengthened the regional loss of diversity.
The highest diversity was observed in Algeria, but no demographic studies have been carried out for southern populations for compari-son with northern ones. The highest private genetic richness observed here also underlines the isolation of this southern cluster. This could indicate that this area corresponded to a glacial refugia (Maggs et al., 2008) or, at least, to an area where the environmental conditions would have allowed a better demographic stability of these popula-tions than in other regions. Quaternary climatic fluctuapopula-tions led to variations in sea temperature and sea level. Winter surface tempera-ture was estimated to be around 7°C in winter in the Gulf of Lion (com-pared to 13°C for present day) and the sea level was 120 m lower than present around French coasts (Hayes et al., 2005; Lambeck & Bard, 2000). These variations could have had different demographic impacts according to location, as the cooling was lower along Algerian coasts (Hayes et al., 2005). If southern areas were refugia for E. cavolini, the recolonization of northern Mediterranean could have led to a “south-ern richness to north“south-ern poverty” (Hewitt, 2000). For E. cavolini, the marked differentiation between northern and southern populations could point to an alternative scenario: There could be a northern refugia more affected by climatic fluctuations than southern one. A higher diversity in southern compared to northern populations has not been observed for other octocoral populations, apart for E. singularis (Aurelle et al., 2011; Cataneo, 2011; Mokhtar- Jamaï et al., 2011). This could suggest different responses of octocorals to climate fluctuations with a higher sensitivity of E. cavolini to past climatic variations.
5 | CONCLUSION
The yellow gorgonian E. cavolini presents distinct genetic units depending on geographical locations with contrasted levels of genetic diversity. Therefore, protection of genetically rich populations (eg, in Algeria) or with an important private diversity (eg, in Turkey) should be a priority. This is particularly important when considering the current pressures on this species. In Turkey, some relatively dense E. cavolini
populations, restricted to few areas in the Marmara Sea, are under various threats such as fisheries (Topçu & Öztürk, 2015). Their genetic particularity could make these populations more vulnerable against such threats that tend to lower their abundance. The impact of local environmental conditions on such species should be considered for protection. Genomic studies of this species could open the way to a better understanding of its evolution and adaptation in a heterogene-ous and fluctuating environment. It would also be useful for a better understanding of the evolutionary history of this species.
ACKNOWLEDGMENTS
We acknowledge the help of the staff of the molecular biology service of the IMBE laboratory. We thank Frédéric Zuberer from the diving unit of the Pythéas Institute and Anne Haguenauer for the sampling of E.
cavolini. We thank Joaquim Garrabou for the samples of Menorca. We
are also deeply indebted to Pr F. Derbal from Annaba University for his help in the realization of submarine dives and sampling of E. cavolini, without forgetting the members of the diving club ‘Hippone’ of Annaba city for their valuable assistance. We acknowledge Didier Forcioli for helpful discussions on cross-species amplifications. This study has been funded by the Algerian – French collaboration program Tassili n°12MDU853 and by the French National Research Agency (ANR) program Adacni (ANR n° ANR-12-ADAP-0016; http://adacni.imbe. fr). Nur Eda Topçu was funded by TUDAV (Turkish Marine Research Foundation). Sampling was done with authorizations from the corre-sponding local authorities. The authors declare no conflict of interest.
DATA ACCESSIBILITY
All genotypes are deposited on Dryad. doi:10.5061/dryad.8vj25.
REFERENCES
Aksu, A. E., Hiscott, R. N., Mudie, P. J., Rochon, A., Kaminski, M. A., Abrajano, T., & Yaar, D. (2002). Persistent Holocene outflow from the Black Sea to the Eastern Mediterranean contradicts Noah’s Flood hypothesis. GSA
Today, 12, 4–10.
Arnaud-Haond, S., & Belkhir, K. (2007). GENCLONE: A computer program to analyse genotypic data, test for clonality and describe spatial clonal organization. Molecular Ecology Notes, 7, 15–17.
Arnaud-Haond, S., Migliaccio, M., Diaz-Almela, E., Teixeira, S., van de Vliet, M. S., Alberto, F., … Serrao, E. A. (2007). Vicariance patterns in the Mediterranean Sea: East–west cleavage and low dispersal in the endemic seagrass Posidonia oceanica. Journal of Biogeography, 34, 963–976.
Aurelle, D., & Ledoux, J.-B. (2013). Interplay between isolation by distance and genetic clusters in the red coral Corallium rubrum: Insights from simulated and empirical data. Conservation Genetics, 14, 705–716. Aurelle, D., Ledoux, J.-B., Rocher, C., Borsa, P., Chenuil, A., & Féral, J.-P. (2011).
Phylogeography of the red coral (Corallium rubrum): Inferences on the evolutionary history of a temperate gorgonian. Genetica, 139, 855–869. Bahri-Sfar, L., Lemaire, C., Hassine, O. K. B., & Bonhomme, F. (2000).
Fragmentation of sea bass populations in the western and east-ern Mediterranean as revealed by microsatellite polymorphism.
Proceedings of the Royal Society of London. Series B: Biological Sciences, 267, 929–935.
Ballesteros, E. (2006). Mediterranean coralligenous assemblages: A synthe-sis of present knowledge. Oceanography and Marine Biology: An Annual
Review, 44, 123–195.
Beaumont, M. A. (1999). Detecting population expansion and decline using microsatellites. Genetics, 153, 2013–2029.
Belkhir, K., Borsa, P., Chikhi, L., Raufaste, N., & Bonhomme, F. (1996). GENETIX 4.05, logiciel sous Windows TM pour la génétique des popu-lations. Laboratoire Génome, Populations, Interactions, CNRS UMR, 5000, 1996–2004.
Benjamini, Y., & Hochberg, Y. (1995). Controlling the false discovery rate: A practical and powerful approach to multiple testing. Journal of the Royal
Statistical Society. Series B (Methodological), 57, 289–300.
Berline, L., Rammou, A.-M., Doglioli, A., Molcard, A., & Petrenko, A. (2014). A connectivity- based eco- regionalization method of the Mediterranean Sea. PLoS ONE, 9, e111978.
Beşiktepe, Ş. T., Sur, H. I., Özsoy, E., Latif, M. A., Oǧuz, T., & Ünlüata, Ü. (1994). The circulation and hydrography of the Marmara Sea. Progress
in Oceanography, 34, 285–334.
Bianchi, C. N., Morri, C., Chiantore, M., Montefalcone, M., Parravicini, V., & Rovere, A. (2012). Mediterranean Sea biodiversity between the legacy from the past and a future of change. Life in the Mediterranean Sea: A
look at habitat changes (pp. 1–55). New York: Nova Science Publishers.
Bierne, N., Welch, J., Loire, E., Bonhomme, F., & David, P. (2011). The cou-pling hypothesis: Why genome scans may fail to map local adaptation genes. Molecular Ecology, 20, 2044–2072.
Borsa, P., Naciri, M., Bahri, L., Chikhi, L., de Garcia Leon, F., Kotoulas, G., & Bonhomme, F. (1997).Zoogéographie infra- spécifique de la mer Méditerranée: Analyse des données génétiques populationnelles sur seize espèces atlanto- méditerranéennes (Poissons et Invertébrés). Vie
et Milieu, 47, 295–305.
Brooks, S. P., & Gelman, A. (1998). General methods for monitoring conver-gence of iterative simulations. Journal of Computational and Graphical
Statistics, 7, 434–455.
Calderon, I., Garrabou, J., & Aurelle, D. (2006). Evaluation of the utility of COI and ITS markers as tools for population genetic studies of tem-perate gorgonians. Journal of Experimental Marine Biology and Ecology,
336, 184–197.
Cannas, R., Sacco, F., Cau, A., Cuccu, D., follesa, M. C., & Cau, A. (2016). Genetic monitoring of deep-water exploited banks of the precious Sardinia coral Corallium rubrum (L., 1758): Useful data for a sustainable management. Aquatic Conservation: Marine and Freshwater Ecosystems,
26, 236–250.
Cataneo, J. (2011). Adaptation d’Eunicella singularis en milieu perturbé:
sym-biose et structuration génétique. Thèse de l’Université de Nice Sophia
Antipolis.
Chapuis, M.-P., & Estoup, A. (2007). Microsatellite null alleles and estima-tion of populaestima-tion differentiaestima-tion. Molecular Biology and Evoluestima-tion, 24, 621–631.
Chikhi, L., Sousa, V. C., Luisi, P., Goossens, B., & Beaumont, M. A. (2010). The confounding effects of population structure, genetic diversity and the sampling scheme on the detection and quantification of population size changes. Genetics, 186, 983–995.
Cornuet, J. M., & Luikart, G. (1996). Description and power analysis of two tests for detecting recent population bottlenecks from allele frequency data. Genetics, 144, 2001–2014.
Costantini, F., Fauvelot, C., & Abbiati, M. (2007a). Fine- scale genetic struc-turing in Corallium rubrum: Evidence of inbreeding and limited effective larval dispersal. Marine Ecology Progress Series, 340, 109–119. Costantini, F., Fauvelot, C., & Abbiati, M. (2007b). Genetic structuring of
the temperate gorgonian coral (Corallium rubrum) across the western Mediterranean Sea revealed by microsatellites and nuclear sequences.
Molecular Ecology, 16, 5168–5182.
Costantini, F., Rossi, S., Pintus, E., Cerrano, C., Gili, J.-M., & Abbiati, M. (2011). Low connectivity and declining genetic variability along a depth gradient in Corallium rubrum populations. Coral Reefs, 30, 991–1003.
Crandall, E. D., Sbrocco, E. J., Deboer, T. S., Barber, P. H., & Carpenter, K. E. (2011). Expansion dating: Calibrating molecular clocks in marine spe-cies from expansions onto the Sunda Shelf following the Last Glacial Maximum. Molecular Biology and Evolution 29, 707–719, msr227. Crawford, N. G. (2010). SMOGD: Software for the measurement of genetic
diversity. Molecular Ecology Resources, 10, 556–557.
Drummond, A. J., Rambaut, A., Shapiro, B., & Pybus, O. G. (2005). Bayesian coalescent inference of past population dynamics from molecular sequences. Molecular Biology and Evolution, 22, 1185–1192.
Earl, D. A. (2012). STRUCTURE HARVESTER: A website and program for visualizing STRUCTURE output and implementing the Evanno method.
Conservation Genetics Resources, 4, 359–361.
Ellegren, H., & Galtier, N. (2016). Determinants of genetic diversity. Nature
Reviews Genetics, 17, 422–433.
Evanno, G., Regnaut, S., & Goudet, J. (2005). Detecting the number of clus-ters of individuals using the software STRUCTURE: A simulation study.
Molecular Ecology, 14, 2611–2620.
Excoffier, L., & Lischer, H. E. (2010). Arlequin suite ver 3.5: A new series of programs to perform population genetics analyses under Linux and Windows. Molecular Ecology Resources, 10, 564–567.
Falush, D., Stephens, M., & Pritchard, J. K. (2003). Inference of population structure using multilocus genotype data: Linked loci and correlated allele frequencies. Genetics, 164, 1567–1587.
Falush, D., Stephens, M., & Pritchard, J. K. (2007). Inference of population structure using multilocus genotype data: Dominant markers and null alleles. Molecular Ecology Notes, 7, 574–578.
Faurby, S., & Pertoldi, C. (2012). The consequences of the unlikely but crit-ical assumption of stepwise mutation in the population genetic soft-ware, MSVAR. Evolutionary Ecology Research, 14, 859–879.
Garrabou, J., Coma, R., Bensoussan, N., Bally, M., Chevaldonné, P., Cigliano, M., … Kersting, D. (2009). Mass mortality in Northwestern Mediterranean rocky benthic communities: Effects of the 2003 heat wave. Global Change Biology, 15, 1090–1103.
Gelman, A., & Rubin, D. B. (1992). Inference from iterative simulation using multiple sequences. Statistical Science, 7, 457–472.
Girod, C., Vitalis, R., Leblois, R., & Fréville, H. (2011). Inferring population decline and expansion from microsatellite data: A simulation- based evaluation of the Msvar method. Genetics, 188, 165–179.
Goudet, J. (2001). FSTAT, a program to estimate and test gene diversities and fixation indices (version 2.9. 3). Institute of Ecology, Lausanne, Switzerland. Retrieved from http://www2. unil. ch/popgen/softwares/fstat.htm. Hayes, A., Kucera, M., Kallel, N., Sbaffi, L., & Rohling, E. J. (2005). Glacial
Mediterranean sea surface temperatures based on planktonic foramin-iferal assemblages. Quaternary Science Reviews, 24, 999–1016. Hewitt, G. (2000). The genetic legacy of the Quaternary ice ages. Nature,
405, 907–913.
Holland, L. P., Dawson, D. A., Horsburgh, G. J., Krupa, A. P., & Stevens, J. R. (2013). Isolation and characterization of fourteen microsatellite loci from the endangered octocoral Eunicella verrucosa (Pallas 1766).
Conservation Genetics Resources, 5, 825–829.
Jakobsson, M., & Rosenberg, N. A. (2007). CLUMPP: A cluster matching and permutation program for dealing with label switching and multimodal-ity in analysis of population structure. Bioinformatics, 23, 1801–1806. Jensen, J. L., Bohonak, A. J., & Kelley, S. T. (2005). Isolation by distance, web
service. BMC Genetics, 6, 13.
Jombart, T. (2008). adegenet: A R package for the multivariate analysis of genetic markers. Bioinformatics, 24, 1403–1405.
Jombart, T., Devillard, S., & Balloux, F. (2010). Discriminant analysis of prin-cipal components: A new method for the analysis of genetically struc-tured populations. BMC Genetics, 11, 94.
Jost, L. (2008). GST and its relatives do not measure differentiation.
Molecular Ecology, 17, 4015–4026.
Kalinowski, S. T. (2005). Hp- rare 1.0: A computer program for performing rarefaction on measures of allelic richness. Molecular Ecology Notes, 5, 187–189.