HAL Id: hal-03147106
https://hal.sorbonne-universite.fr/hal-03147106
Submitted on 19 Feb 2021HAL is a multi-disciplinary open access archive for the deposit and dissemination of sci-entific research documents, whether they are pub-lished or not. The documents may come from teaching and research institutions in France or abroad, or from public or private research centers.
L’archive ouverte pluridisciplinaire HAL, est destinée au dépôt et à la diffusion de documents scientifiques de niveau recherche, publiés ou non, émanant des établissements d’enseignement et de recherche français ou étrangers, des laboratoires publics ou privés.
High-quality carnivoran genomes from roadkill samples
enable comparative species delineation in aardwolf and
bat-eared fox
Rémi Allio, Marie-Ka Tilak, Celine Scornavacca, Nico Avenant, Andrew
Kitchener, Erwan Corre, Benoit Nabholz, Frédéric Delsuc
To cite this version:
Rémi Allio, Marie-Ka Tilak, Celine Scornavacca, Nico Avenant, Andrew Kitchener, et al.. High-quality carnivoran genomes from roadkill samples enable comparative species delineation in aardwolf and bat-eared fox. eLife, eLife Sciences Publication, 2021, 10, �10.7554/eLife.63167�. �hal-03147106�
High-quality carnivoran genomes from roadkill samples enable
1comparative species delineation in aardwolf and bat-eared fox
23
Rémi Allio1*, Marie-Ka Tilak1, Céline Scornavacca1, Nico L. Avenant2, Andrew C. 4
Kitchener3, Erwan Corre4, Benoit Nabholz1,5, and Frédéric Delsuc1* 5
6
1Institut des Sciences de l’Evolution de Montpellier (ISEM), CNRS, IRD, EPHE, Université 7
de Montpellier, France [email protected] [email protected] 8 [email protected] [email protected] 9 [email protected] 10 2
National Museum and Centre for Environmental Management, University of the Free State, 11
Bloemfontein, South Africa [email protected] 12
3
Department of Natural Sciences, National Museums Scotland, Edinburgh, UK 13
4
CNRS, Sorbonne Université, FR2424, ABiMS, Station Biologique de Roscoff, 29680 15
Roscoff, France [email protected] 16
5
Institut Universitaire de France (IUF) 17
18 *
Correspondence: [email protected], [email protected]. 19 20 21 ORCID 22 Allio, Rémi 0000-0003-3885-5410 23 Tilak, Marie-Ka 0000-0001-8995-3462 24 Scornavacca, Céline 25 Avenant, Nico L. 0000-0002-5390-9010 26 Kitchener, Andrew C. 0000-0003-2594-0827 27 Corre, Erwan 0000-0001-6354-2278 28 Nabholz, Benoit 0000-0003-0447-1451 29 Delsuc, Frédéric 0000-0002-6501-6287 30 31 32
Abstract
33In a context of ongoing biodiversity erosion, obtaining genomic resources from wildlife is essential 34
for conservation. The thousands of yearly mammalian roadkill provide a useful source material for 35
genomic surveys. To illustrate the potential of this underexploited resource, we used roadkill samples 36
to study the genomic diversity of the bat-eared fox (Otocyon megalotis) and the aardwolf (Proteles 37
cristatus), both having subspecies with similar disjunct distributions in Eastern and Southern Africa.
38
First, we obtained reference genomes with high contiguity and gene completeness by combining 39
Nanopore long reads and Illumina short reads. Then, we showed that the two subspecies of aardwolf 40
might warrant species status (P. cristatus and P. septentrionalis) by comparing their genome-wide 41
genetic differentiation to pairs of well-defined species across Carnivora with a new Genetic 42
Differentiation index (GDi) based on only a few resequenced individuals. Finally, we obtained a 43
genome-scale Carnivora phylogeny including the new aardwolf species. 44 45 46
Keywords
47Roadkill, Genomics, Population genomics, Phylogenomics, Species delineation, Carnivora, 48
Systematics, Genetic differentiation, Mitogenomes, Africa. 49
Introduction
51In the context of worldwide erosion of biodiversity, obtaining large-scale genomic resources 52
from wildlife is essential for biodiversity assessment and species conservation. An 53
underexploited, but potentially useful, source of material for genomics is the many thousands 54
of annual wildlife fatalities due to collisions with cars. In particular, mammalian roadkill is 55
unfortunately so frequent that several citizen-science surveys have been implemented on this 56
subject in recent decades (Périquet et al., 2018; Shilling et al., 2015). For example, in South 57
Africa alone, over 12,000 wildlife road mortality incidents were recorded by The Endangered 58
Wildlife Trust’s Wildlife and Roads Project from 1949 to 2017 (Endangered Wildlife Trust 59
2017). Initially developed to measure the impact of roads on wildlife, these web-based 60
systems highlight the numbers of car-wildlife collisions. The possibility of retrieving DNA 61
from roadkill tissue samples (Etherington et al., 2020; Maigret, 2019) could provide new 62
opportunities in genomics by giving access not only to a large number of specimens of 63
commonly encountered species, but also to more elusive and endangered species that might 64
be difficult to sample otherwise. 65
Recent advances in the development of high-throughput sequencing technologies 66
have made the sequencing of hundreds or thousands of genetic loci cost-efficient and have 67
offered the possibility of using ethanol-preserved tissues, old DNA extracts, and museum 68
specimens (Blaimer et al., 2016; Guschanski et al., 2013). This method, combined with third-69
generation long-read sequencing technologies, such as Pacific Biosciences (PacBio) and 70
Oxford Nanopore Technologies (ONT) sequencing, have increased the sizes of the sequenced 71
molecules from several kilobases to several megabases. The relatively high level of 72
sequencing errors (10-15%) associated with these technologies can be compensated by 73
sequencing at a high depth-of-coverage to avoid sequencing errors in de novo genome 74
assembly and thus obtain reference genomes with high base accuracy, contiguity, and 75
completeness (Koren et al., 2017; Shafin et al., 2020; Vaser et al., 2017). Originally designed 76
to allow direct sequencing of DNA molecules with simplified library preparation procedures, 77
ONT instruments, such as the MinION (Jain et al., 2016), have been co-opted as a portable 78
sequencing method in the field that proved useful in a diversity of environmental conditions 79
(Blanco et al., 2019; Parker et al., 2017; Pomerantz et al., 2018; Srivathsan et al., 2018). This 80
approach is particularly suitable for sequencing roadkill specimens, for which it is 81
notoriously difficult to obtain a large amount of high-quality DNA because of post-mortem 82
DNA degradation processes in high ambient environmental temperatures. Furthermore, it is 83
possible to correct errors in ONT long reads by combining them with Illumina short reads, 84
either to polish de novo long-read-based genome assemblies (Batra et al., 2019; Jain et al., 85
2018; Nicholls et al., 2019; Walker et al., 2014) or to construct hybrid assemblies (Di Genova 86
et al., 2018; Gan et al., 2019; Tan et al., 2018; Zimin et al., 2013). In hybrid assembly 87
approaches the accuracy of short reads with high depth-of-coverage (50-100x) allows the use 88
of long reads at lower depths of coverage (10-30x) essentially for scaffolding (Armstrong et 89
al., 2020; Kwan et al., 2019). A promising hybrid assembly approach, combining short- and 90
long-read sequencing data has been implemented in MaSuRCA software (Zimin et al., 2017, 91
2013). This approach consists of transforming large numbers of short reads into a much 92
smaller number of longer highly accurate “super reads”, allowing the use of a mixture of read 93
lengths. Furthermore, this method is designed to tolerate a significant level of sequencing 94
error. Initially developed to address short reads from Sanger sequencing and longer reads 95
from 454 Life Sciences instruments, this method has already shown promising results for 96
combining Illumina and ONT/PacBio sequencing data in several taxonomic groups, such as 97
plants (Scott et al., 2020; Wang et al., 2019; Zimin et al., 2017), birds (Gan et al., 2019), and 98
fishes (Jiang et al., 2019; Kadobianskyi et al., 2019; Tan et al., 2018), but not yet in 99
mammals. 100
Here, we studied two of the most frequently encountered mammalian roadkill species 101
in South Africa (Périquet et al., 2018): the bat-eared fox (Otocyon megalotis, Canidae) and 102
the aardwolf (Proteles cristatus, Hyaenidae). These two species are among several African 103
vertebrate taxa disjunct distributions between Southern and Eastern Africa that are separated 104
by more than a thousand kilometres (e.g. ostrich, Miller et al., 2011; ungulates, Lorenzen et 105
al., 2012). Diverse biogeographical scenarios, involving the survival and divergence of 106
populations in isolated savanna refugia during the climatic oscillations of the Pleistocene, 107
have been proposed to explain these disjunct distributions in ungulates (Lorenzen et al., 108
2012). Among the Carnivora subspecies have been defined based on this peculiar allopatric 109
distribution not only for the black-backed jackal (Lupulella mesomelas; Walton and Joly 110
2003) but also for both the bat-eared fox (Clark, 2005) and the aardwolf (Koehler and 111
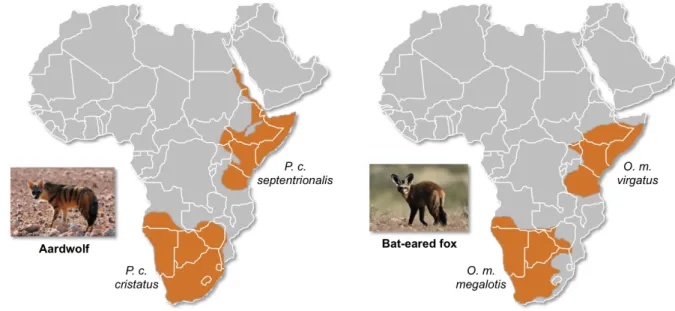
Richardson, 1990) (Fig. 1). The bat-eared fox is divided into the Southern bat-eared fox (O. 112
megalotis megalotis) and the Eastern bat-eared fox (O. megalotis virgatus) (Clark, 2005), and 113
the aardwolf is divided into the Southern aardwolf (P. cristatus cristatus) and the Eastern 114
aardwolf (P. cristatus septentrionalis) (Koehler and Richardson, 1990). However, despite 115
known differences in behaviour between the subspecies of both species groups (Wilson et al., 116
2009), no genetic or genomic assessment of population differentiation has been conducted to 117
date. In other taxa similar allopatric distributions have led to genetic differences between 118
populations and several studies reported substantial intraspecific genetic structuration 119
between Eastern and Southern populations (Atickem et al., 2018; Barnett et al., 2006; 120
Dehghani et al., 2008; Lorenzen et al., 2012; Miller et al., 2011; Rohland et al., 2005). Here, 121
with a novel approach based on a few individuals, we investigate whether significant genetic 122
structuration and population differentiation have occurred between subspecies of bat-eared 123
fox and aardwolf using whole genome data. 124
126
Figure 1. Disjunct distributions of the aardwolf (Proteles cristatus) and the bat-eared fox (Otocyon megalotis) 127
in Eastern and Southern Africa. Within each species, two subspecies have been recognized based on their
128
distributions and morphological differences (Clark, 2005; Koehler and Richardson, 1990). Picture credits:
129
Southern aardwolf (P. cristatus cristatus) copyright Dominik Käuferle; Southern bat-eared fox (O. megalotis
130
megalotis) copyright Derek Keats.
To evaluate the taxonomic status of the proposed subspecies within both O. 132
megalotisand P. cristatus, we first sequenced and assembled two reference genomes from 133
roadkill samples by combining ONT long reads and Illumina short reads using the MaSuRCA 134
hybrid assembler. The quality of our genome assemblies was assessed by comparison to 135
available mammalian genome assemblies. Then, to estimate the genetic diversity of these 136
species and to perform comparative genome-scale species delineation analyses, two 137
additional individuals from the disjunct South African and Tanzanian populations of both 138
species were resequenced at high depth-of-coverage using Illumina short reads. Using these 139
additional individuals, we estimated the genetic diversity and differentiation of each 140
subspecies pair via an FST-like measure, which we called the genetic differentiation index, 141
and compared the results with the genetic differentiation among pairs of well-established 142
carnivoran sister species. Based on measures of genetic differentiation, we found that the two 143
subspecies of P. cristatus warrant separate species status, whereas the subspecies of O. 144
megalotis do not show such differentiation. Our results show that high-quality reference 145
mammalian genomes could be obtained through a combination of short- and long-read 146
sequencing methods providing opportunities for large-scale population genomic studies of 147
mammalian wildlife using (re)sequencing of samples collected from roadkill. 148
149
Results
150Mitochondrial diversity within Carnivora
151
The first dataset, composed of complete carnivoran mitogenomes available in GenBank 152
combined with the newly generated sequences of the two subspecies of P. cristatus, the two 153
subspecies of O. megalotis, Parahyaena brunnea, Speothos venaticus and Vulpes vulpes, plus 154
the sequences extracted from Ultra Conserved Elements (UCE) libraries for Bdeogale 155
nigripes, Fossa fossana, and Viverra tangalunga (see Methods for more details), comprised 156
142 species or subspecies representing all families of Carnivora, including five O. megalotis 157
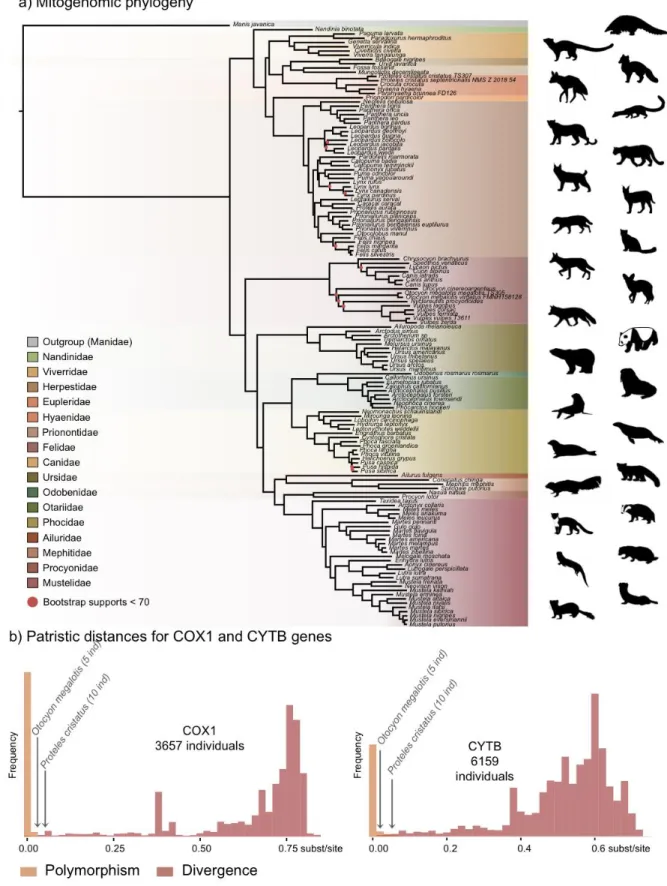
and 10 P. cristatus individuals. Maximum likelihood (ML) analyses reconstructed a robust 158
mitogenomic phylogeny, with 91.4% of the nodes (128 out of 140) recovered with bootstrap 159
support higher than 95% (Fig. 2a). The patristic distances, extracted from the phylogenetic 160
tree inferred with complete mitogenomes between the allopatric subspecies of aardwolf and 161
bat-eared fox, were 0.045 and 0.020 substitutions per site, respectively (Supplementary File 162
1). These genetic distances are comparable to those observed between different well-defined 163
species of Carnivora, such as the red fox (Vulpes vulpes) and the fennec (V. zerda) (0.029) or 164
the steppe polecat (Mustela eversmanii) and the Siberian weasel (M. sibirica) (0.034) (see 165
Supplementary File 1). 166
To further assess the genetic distances between the two pairs of subspecies and 167
compare them to both polymorphism and divergence values observed across Carnivora, two 168
supplemental datasets, including at least two individuals per species, were assembled by 169
retrieving all COX1 and CYTB sequences, which are the two widely sequenced 170
mitochondrial markers for carnivorans, available on GenBank. These datasets include 3,657 171
COX1 sequences for 150 species and 6,159 CYTB sequences for 203 species of Carnivora. 172
After adding the corresponding sequences from the newly assembled mitogenomes, ML 173
phylogenetic inference was conducted on each dataset. The patristic distances between all 174
tips of the resulting phylogenetic trees were measured and classified into two categories: (i) 175
intraspecific variation (polymorphism) for distances inferred among individuals of the same 176
species and (ii) interspecific divergence for distances inferred among individuals of different 177
species. Despite an overlap between polymorphism and divergence in both mitochondrial 178
genes, this analysis revealed a threshold between polymorphism and divergence of 179
approximately 0.02 substitutions per site for Carnivora (Fig. 2b). With a nucleotide distance 180
of 0.054 for both COX1 and CYTB, the genetic distance observed between the two 181
subspecies of aardwolf (Proteles ssp.) was higher than the majority of the intraspecific 182
distances observed across Carnivora. However, with nucleotide distances of 0.020 for COX1 183
and 0.032 for CYTB, the genetic distances observed between the two subspecies of bat-eared 184
fox (Otocyon ssp.) were clearly in the ambiguous zone and did not provide a clear indication 185
of the specific taxonomic status of these populations. 186
Finally, to test whether the two pairs of allopatric subspecies diverged synchronously 187
or in two different time periods, Bayesian molecular dating inferences were performed on the 188
142-taxon ML mitogenomic tree. The resulting divergence times were slightly different 189
depending on the clock model used (strict clock [CL], autocorrelated [LN or TK02] and 190
uncorrelated [UGAM or UCLM]) despite the convergence of the MCMC chains for all 191
models. Cross-validation analyses resulted in the selection of the LN and UGAM models as 192
the models with the best fit based on a higher cross-likelihood score than that of CL (LN and 193
UGAM versus CL mean scores = 35 8). Unfortunately, these two statistically 194
indistinguishable models provided different divergence times for the two pairs of subspecies, 195
with LN favouring a synchronous divergence (approximately 1 Mya [95% credibility interval 196
(CI) : 6.72 - 0.43]; Supplementary File 2), while UGAM favoured an asynchronous 197
divergence (~0.6 [CI: 0.83 - 0.39] Mya for O. megalotis ssp. and ~1.3 [CI: 1.88 - 0.93] Mya 198
for P. cristatus ssp.; Supplementary File 2). However, the three chains performed with the 199
UGAM model recovered highly similar ages for the two nodes of interest with low CI 95% 200
values, whereas the three chains performed with the LN model recovered less similar ages 201
between chains and high CI 95% values (Supplementary File 2). 202
204
Figure 2. Representation of the mitochondrial genetic diversity within the Carnivora with a) the mitogenomic 205
phylogeny inferred from 142 complete Carnivora mitogenomes, including those of the two populations of
206
aardwolf (Proteles cristatus) and bat-eared fox (Otocyon megalotis) and b) intraspecific (orange) and the
207
interspecific (red) genetic diversities observed for the two mitochondrial markers COX1 and CYTB. Silhouettes
208
from http://phylopic.org/. 209
Assembling reference genomes from roadkill
210
Considering the DNA quality and purity required to perform single-molecule sequencing 211
with ONT, a specific protocol to extract DNA from roadkill was developed (Tilak et al., 212
2020). This protocol was designed to specifically select the longest DNA fragments present 213
in the extract, which also contained short degraded fragments resulting from post-mortem 214
DNA degradation processes. This protocol increased the median size of the sequenced raw 215
DNA fragments three-fold in the case of aardwolf (Tilak et al., 2020). In total, after high-216
accuracy basecalling, adapter trimming, and quality filtering, 27.3 Gb of raw Nanopore long 217
reads were sequenced using 16 MinION flow cells for the Southern aardwolf (P. c. cristatus) 218
and 33.0 Gb using 13 flow cells for the Southern bat-eared fox (O. m. megalotis) (Table 1). 219
Owing to quality differences among the extracted tissues for both species, the N50 of the 220
DNA fragment size for P. cristatus (9,175 bp) was about two times higher than the N50 of 221
the DNA fragment size obtained for O. megalotis (4,393 bp). The quality of the reads base-222
called with the high accuracy option of Guppy was significantly higher than the quality of 223
those translated with the fast option, which led to better assemblies (see Appendix 1 – 224
Figure 1). Complementary Illumina sequencing returned 522.8 and 584.4 million quality-225
filtered reads per species corresponding to 129.5 Gb (expected coverage = 51.8x) and 154.8 226
Gb (expected coverage = 61.6x) for P. c. cristatus and O. m. megalotis, respectively. 227
Regarding the resequenced individuals of each species, on average 153.5 Gb were obtained 228
with Illumina resequencing (Table 1). 229
Table 1. Summary of sequencing and assembly statistics of the genomes generated in this study. 231 Asse mbl y st ati sti cs M issi n g d a ta (%) 2 2 .4 3 NA 2 2 .9 6 2 2 .0 2 NA OMM gene s 12,062 12,050 11,981 B usco sc or e 92.8 NA 92.9 N50 ( kb) 1,309 728 Nbr of sc aff . 5,669 11,081 Ge nome size (G b) 2.39 2.75 Oxf or d Na nopo re S eque nc ing Esti mate d cove ra g e 10.9 NA 13.2 NA Ave ra g e size 5,555 3,092 N50 9,175 4,393 Nbr of ba se s (G b) 27.3 33 Nbr of flow ce ll s 16 13 Illum ina Esti mate d cove ra g e 51.8 56.3 53.0 61.6 96.3 40.1 Nbr of gigaba se s 129.50 140.73 132.44 154.81 240.71 100.30 C lea ne d re ads 522.8 526.1 516.2 584.4 820 554.1 R aw r ea ds (M) 716.7 663.8 750.9 710.2 861.2 661.7 Individuals Vouc he r TS30 7 TS49 1 NMS Z201854 TS30 5 TS30 6 F MNH 158128 S ubspe cies cristatus cristatus se ptentr ionalis mega lot is mega lot is virga tus S pe cies Protele s crist atus Protele s crist atus Protele s crist atus Otoc yon me galot is Otoc yon me galot is Otoc yon me galot is 232
The two reference genomes were assembled using MinION long reads and Illumina 233
short reads in combination with MaSuRCA v3.2.9 (Zimin et al., 2013). Hybrid assemblies for 234
both species were obtained with a high degree of contiguity with only 5,669 scaffolds and an 235
N50 of 1.3 Mb for the aardwolf (P. cristatus) and 11,081 scaffolds and an N50 of 728 kb for 236
the bat-eared fox (O. megalotis) (Table 1). Our two new genomes compared favourably with 237
the available carnivoran genome assemblies in terms of (i) contiguity showing slightly less 238
than the median N50 and a lower number of scaffolds than the majority of the other 239
assemblies (Appendix 1 – Figure 2, Supplementary File 3) and (ii) completeness showing 240
high BUSCO scores (see Appendix 1 – Figure 3 and Supplementary File 4 for BUSCO 241
score comparisons among carnivoran genomes). Comparison of two hybrid assemblies with 242
Illumina-only assemblies obtained with SOAPdenovo illustrated the positive effect of 243
introducing Nanopore long reads even at moderate coverage by reducing the number of 244
scaffolds from 409,724 to 5,669 (aardwolf) and from 433,209 to 11,081 (bat-eared fox), 245
while increasing the N50 from 17.3 kb to 1.3 Mb (aardwolf) and from 22.3 kb to 728 kb (bat-246
eared fox). 247
248
Genome-wide analyses of population structure and differentiation
249
To evaluate the population structure between the subspecies of P. cristatus and O. megalotis, 250
the number of shared heterozygous sites, unique heterozygous sites, and homozygous sites 251
between individuals was computed to estimate an FST-like statistic (hereafter called the 252
genetic differentiation index or GDI). Since we were in possession of two individuals for the 253
Southern subspecies and only one for the Eastern subspecies of both species, the genetic 254
differentiation between the two individuals within the Southern subspecies and between the 255
Southern and Eastern subspecies was computed. To account for the variation across the 256
genome, 10 replicates of 100 regions with a length of 100 kb were randomly chosen to 257
estimate genetic differentiation. Interestingly, in both species the mean heterozygosity was 258
higher in the Southern subspecies than in the Eastern subspecies. For the aardwolf the mean 259
heterozygosity was 0.189 per kb (sd = 0.010) in the Southern population and 0.121 per kb (sd 260
= 0.008) in the Eastern population. For the bat-eared fox the mean heterozygosity was 0.209 261
per kb (sd = 0.013) in the Southern population and 0.127 per kb (sd = 0.003) in the Eastern 262
population. This heterozygosity level is low compared to that of other large mammals (Díez-263
del-Molino et al., 2018) and is comparable to that of the Iberian lynx, the cheetah or the 264
brown hyaena, which have notoriously low genetic diversity (Abascal et al., 2016; Casas-265
Marce et al., 2013; Westbury et al., 2018). 266
Since we had very limited power to fit the evolution of the genetic differentiation 267
statistics with a hypothetical demographic scenario because of our limited sample size (n = 268
3), we chose a comparative approach and applied the same analyses to four well-defined 269
species pairs of carnivorans, for which similar individual sampling was available. The genetic 270
differentiation estimates between the two individuals belonging to the same subspecies 271
(Southern populations in both cases) were on average equal to 0.005 and 0.014 for P. c. 272
cristatus and O. m. megalotis, respectively. This indicated that the polymorphism observed in 273
the two individuals within the Southern subspecies of each species was comparable (genetic 274
differentiation index close to 0) and thus that these two subpopulations are likely panmictic 275
(Fig. 3 - Figure supplement 1). In contrast, the genetic differentiation estimates for the two 276
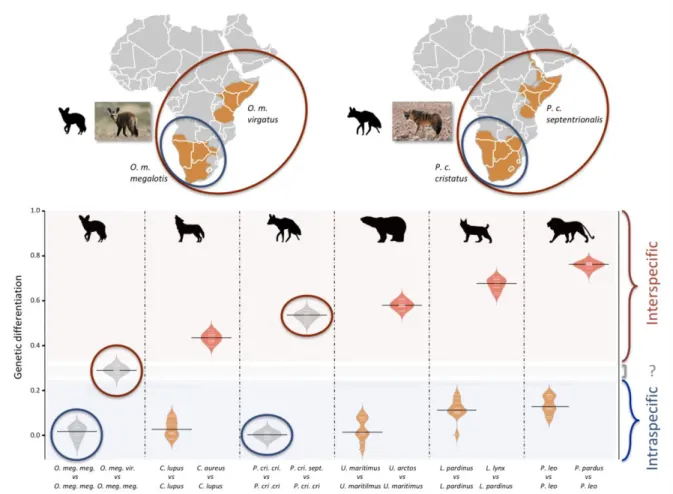
pairs of individuals belonging to the different subspecies were respectively equal to on 277
average 0.533 and 0.294 for P. cristatus ssp. and O. megalotis ssp., indicating that the two 278
disjunct populations are genetically structured. To contextualize these results, the same 279
genetic differentiation measures were estimated using three individuals for four other well-280
defined species pairs (Fig. 3 - Figure supplement 1). First, the comparison of the 281
polymorphism of two individuals of the same species led to intraspecific GDIs ranging from 282
0.029 on average for polar bear (Ursus maritimus) to 0.137 for lion (Panthera leo). As 283
expected, comparing the polymorphisms of two individuals between closely related species 284
led to a higher interspecific GDI ranging from 0.437 on average for the wolf/golden jackal 285
(Canis lupus/Canis aureus) pair to 0.760 for the lion/leopard (P. leo/Panthera pardus) pair 286
(Fig. 3). The genetic differentiation indices between the grey wolf (C. lupus) and the golden 287
jackal (C. aureus) averaged 0.44, indicating that the two subspecies of aardwolf (GDI = 288
0.533) are genetically more differentiated than these two well-defined species, and only 289
slightly less differentiated than the brown bear and the polar bear. Conversely, the genetic 290
differentiation obtained between the bat-eared fox subspecies (GDI = 0.294) was lower than 291
the genetic differentiation estimates obtained for any of the four reference species pairs 292
evaluated here (Fig. 3 - Figure supplement 1). We verified that differences in depth-of-293
coverage among individuals did not bias our genetic differentiation estimates by subsampling 294
reads at 15x (Fig. 3 - Figure supplement 1). We also checked that randomly sampling only 295
three individuals was enough to accurately estimate genetic differentiation in the case of the 296
brown vs. polar bear comparison (Fig. 3 - Figure supplement 2). 297
299
Figure 3. Genetic differentiation indices obtained from a comparison of intraspecific (orange) and interspecific 300
(red) polymorphisms in four pairs of well-defined Carnivora species and for the subspecies of aardwolf
301
(Proteles cristatus) and bat-eared fox (Otocyon megalotis) (grey). Silhouettes from http://phylopic.org/.
302
303 304
Effective population size reconstructions
305
We used the pairwise sequential Markovian coalescent (PSMC) model to estimate the 306
ancestral effective population size (Ne) trajectory over time for each sequenced individual. 307
For both the aardwolf and the bat-eared fox the individual from Eastern African populations 308
showed a continuous decrease in Ne over time, leading to the recent Ne being lower than that 309
in Southern African populations (Fig. 4). This is in agreement with the lower heterozygosity 310
observed in the Eastern individuals of both species. For the bat-eared fox the trajectories of 311
the three sampled individuals were synchronised approximately 200 kya ago (Fig. 4a), which 312
could correspond to the time of divergence between the Southern and Eastern populations. In 313
contrast, Ne trajectories for the aardwolf populations did not synchronise over the whole 314
period (~2 Myrs). Interestingly, the Southern populations of both species showed a marked 315
increase in population size between ~10-30 kya before sharply decreasing in more recent 316
times (Fig. 4). 317
319
Figure 4. PSMC estimates of changes in effective population size over time for the Eastern (orange) and 320
Southern (blue and purple) populations of a) bat-eared fox and ) aardwolf. mu = mutation rate of 10-8 mutations
321
per site per generation and g = generation time of 2 years. Vertical red lines indicate 20 kyrs and 40 kyrs.
322
Silhouettes from http://phylopic.org/.
323 324
Phylogenomics of the Carnivora
325
Phylogenetic relationships within the Carnivora were inferred from a phylogenomic dataset 326
comprising 52 carnivoran species (including the likely new Proteles septentrionalis species), 327
representing all but two families of the Carnivora (Nandiniidae and Prionodontidae). The 328
non-annotated genome assemblies of these different species were annotated with a median of 329
18,131 functional protein-coding genes recovered for each species. Then, single-copy 330
orthologous gene identification resulted in a median of 12,062 out of the 14,509 single-copy 331
orthologues extracted from the OrthoMaM database for each species, ranging from a 332
minimum of 6,305 genes for the California sea lion (Zalophus californianus) and a maximum 333
of 13,808 for the dog (Canis familiaris) (Supplementary File 5). Our new hybrid assemblies 334
allowed the recovery of 12,062 genes for the Southern aardwolf (P. c. cristatus), 12,050 for 335
the Eastern aardwolf (P. c. septentrionalis), and 11,981 for the Southern bat-eared fox (O. m. 336
megalotis) (Table 1). These gene sets were used to create a supermatrix consisting of 14,307 337
genes representing a total of 24,041,987 nucleotide sites with 6,495,611 distinct patterns 338
(27.0%) and 22.8% gaps or undetermined nucleotides. 339
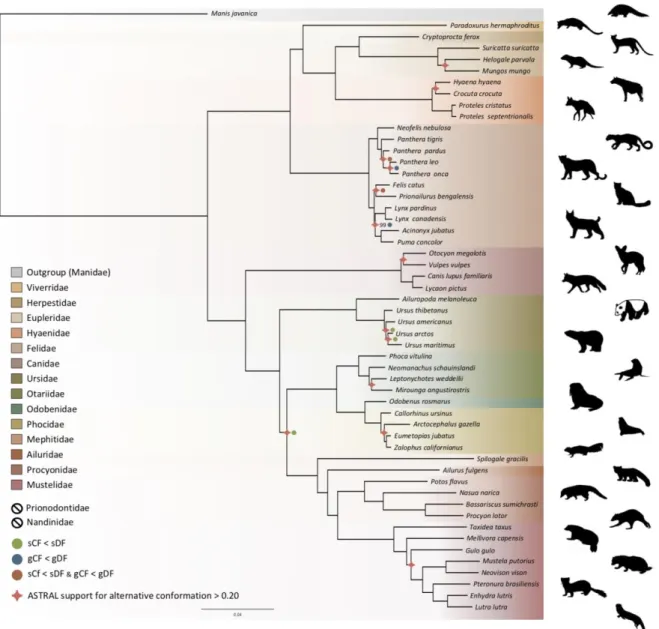
Phylogenomic inference was first performed on the whole supermatrix using ML. The 340
resulting phylogenetic tree was highly supported, with all but one node being supported by 341
maximum bootstrap (UFBS) values (Fig. 5). To further dissect the phylogenetic signal 342
underlying this ML concatenated topology, we measured gene concordance (gCF) and site 343
concordance (sCF) factors to complement traditional bootstrap node-support values. For each 344
node, the proportion of genes (gCF) or sites (sCF) that supported the node inferred with the 345
whole supermatrix was compared to the proportion of the genes (gDF) or sites (sDF) that 346
supported an alternative resolution of the node (Fig. 5). Finally, a coalescent-based 347
approximate species tree inference was performed using ASTRAL-III based on individual 348
gene trees. Overall, the three different analyses provided well-supported and almost identical 349
results (Fig. 5). The order Carnivora was divided into two distinct suborders: a cat-related 350
clade (Feliformia) and a dog-related clade (Caniformia). Within the Feliformia the first split 351
separated the Felidae (felids) from the Viverroidea, a clade composed of the four families 352
Viverridae (civets and genets), Eupleridae (fossa), Herpestidae (mongooses), and Hyaenidae 353
(hyaenas). In hyaenids the two species of termite-eating aardwolves (P. cristatus and P. 354
septentrionalis) were the sister-group of a clade composed of the carnivorous spotted 355
(Crocuta crocuta) and striped (Hyaena hyaena) hyaenas. Congruent phylogenetic 356
relationships among Feliformia families and within hyaenids were also retrieved with the 357
mitogenomic data set (Fig. 2a). The short internal nodes of the Felidae were the principal 358
source of incongruence among the three different analyses with concordance factor analyses 359
pointing to three nodes for which many sites and genes support alternative topologies (Fig. 360
5), including one node for which the coalescent-based approximate species tree inference 361
supported an alternative topology to the one obtained with ML on the concatenated 362
supermatrix. In the Viverroidea the Viverridae split early from the Herpestoidea, regrouping 363
the Hyaenidae, Herpestidae, and Eupleridae, within which the Herpestidae and Eupleridae 364
formed a sister clade to the Hyaenidae. Within the Caniformia the Canidae (canids) was 365
recovered as a sister group to the Arctoidea. Within the Canidae, in accordance with the 366
mitogenomic phylogeny, the Vulpini tribe, represented by O. megalotis and V. vulpes, was 367
recovered as the sister clade of the Canini tribe, represented here by Lycaon pictus and C. 368
familiaris. The Arctoidea was recovered as a major clade composed of eight families grouped 369
into three subclades: Ursoidea (Ursidae), Pinnipedia (Otariidae, Odobedinae, and Phocidae), 370
and Musteloidea, composed of Ailuridae (red pandas), Mephitidae (skunks), Procyonidae 371
(raccoons), and Mustelidae (badgers, martens, weasels, and otters). Within the Arctoidea the 372
ML phylogenetic inference on the concatenation provided support for grouping the 373
Pinnipedia and the Musteloidea to the exclusion of the Ursidae (bears) with maximum 374
bootstrap support (Fig. 5), as in the mitogenomic tree (Fig. 2a). However, the concordance 375
factor analyses revealed that many sites and many genes actually supported alternative 376
topological conformations for this node characterised by a very short branch length (sCF = 377
34.1, SDF1 = 29.2, sDF2 = 36.7, gCF = 46.9, gDF1 = 18.6, gDF2 = 18.2, gDFP = 16.3) (Fig. 378
5). In the Pinnipedia the clade Odobenidae (walruses) plus Otariidae (eared seals) was 379
recovered to the exclusion of the Phocidae (true seals), which was also in agreement with the 380
mitogenomic scenario (Fig. 2a). Finally, within the Musteloidea the Mephitidae represented 381
the first offshoot, followed by the Ailuridae, and a clade grouping the Procyonidae and the 382
Mustelidae. Phylogenetic relationships within Musteloidea were incongruent with the 383
mitogenomic tree, which alternatively supported the grouping of the Ailuridae and the 384
Mephitidae (Fig. 2a). 385
386 387
388
Figure 5. Phylogenomic tree reconstructed from the nucleotide supermatrix composed of 14,307 single-copy 389
orthologous genes for 52 species of Carnivora plus one outgroup (Manis javanica). The family names in the
390
legend are ordered as in the phylogeny. Silhouettes from http://phylopic.org/.
391
392 393
Discussion
394High-quality mammalian genomes from roadkill using MaSuRCA hybrid assembly
395
With an increasing number of species being threatened worldwide, obtaining genomic 396
resources from mammalian wildlife can be difficult. We decided to test the potential of using 397
roadkill samples, an abundant and valuable resource in ecological studies (Schwartz et al., 398
2020) but a currently underexploited source material for genomics (Etherington et al., 2020; 399
Maigret, 2019). Roadkill are indeed relatively easy to survey and the potential coordination 400
with ongoing monitoring and citizen science projects (e.g. Périquet et al., 2018; Waetjen and 401
Shilling, 2017) could potentially give access to large numbers of tissue samples for frequently 402
encountered species. Even though roadkill may represent a biased sample of species 403
populations (Brown and Bomberger Brown, 2013; Loughry and McDonough, 1996), they can 404
also be relevant to generate reference genomes for elusive species that could hardly be 405
sampled otherwise. Despite limited knowledge and difficulties associated with de novo 406
assembly of non-model species (Etherington et al., 2020), we designed a protocol to produce 407
DNA extracts of suitable quality for Nanopore long-read sequencing from roadkill (Tilak et 408
al., 2020). Additionally, we tested the impact of the accuracy of the MinION base-calling step 409
on the quality of the resulting MaSuRCA hybrid assemblies. In line with previous studies 410
(Wenger et al., 2019; Wick et al., 2019) we found that using the high accuracy option rather 411
than the fast option of Guppy 3.1.5 leads to more contiguous assemblies by increasing the 412
N50 value. By relying on this protocol, we were able to generate two hybrid assemblies by 413
combining Illumina reads at relatively high coverage (80x) and MinION long reads at 414
relatively moderate coverage (12x), which provided genomes with high contiguity and 415
completeness. These represent the first two mammalian genomes obtained with such a hybrid 416
Illumina/Nanopore approach using the MaSuRCA assembler for non-model carnivoran 417
species: the aardwolf (P. cristatus) and the bat-eared fox (O. megalotis). Despite the use of 418
roadkill samples our assemblies compare favourably, in terms of both contiguity and 419
completeness, with the best carnivoran genomes obtained so far from classical genome 420
sequencing approaches that do not rely on complementary optical mapping or chromatin 421
conformation approaches. Overall, our carnivoran hybrid assemblies are fairly comparable to 422
those obtained using the classic Illumina-based genome sequencing protocol involving the 423
sequencing of both paired-end and mate-paired libraries (Li et al., 2010). The benefit of 424
adding Nanopore long reads is demonstrated by the fact that our hybrid assemblies are of 425
better quality than all the draft genome assemblies generated using the DISCOVAR de novo 426
protocol based on a PCR-free single Illumina 250 bp paired-end library (Weisenfeld et al., 427
2014; DISCOVAR) used in the 200 Mammals Project of the Broad Genome Institute 428
(Zoonomia consortium, 2020). These results confirm the capacity of the MaSuRCA hybrid 429
assembler to produce quality assemblies for large and complex genomes by leveraging the 430
power of long Nanopore reads (Wang et al., 2020). Moreover, these two hybrid assemblies 431
could form the basis for future chromosome-length assemblies by adding complementary 432
HiC data (van Berkum et al., 2010) as proposed in initiatives such as the Vertebrate Genome 433
Project (Koepfli et al., 2015) and the DNA Zoo (Dudchenko et al., 2017). Our results 434
demonstrate the feasibility of producing high-quality mammalian genome assemblies at 435
moderate cost ($5,000-10,000 USD for each of our Carnivora genomes) using roadkill and 436
should encourage genome sequencing of non-model mammalian species in ecology and 437
evolution laboratories. 438
439
Genomic evidence for two distinct species of aardwolves
440
The mitogenomic distances inferred between the subspecies of O. megalotis and P. cristatus 441
were comparable to those observed for other well-defined species within the Carnivora. 442
Furthermore, by comparing the genetic diversity between several well-defined species 443
(divergence) and several individuals of the same species (polymorphism) based on the COX1 444
and CYTB genes across Carnivora, we were able to pinpoint a threshold of approximately 445
0.02 substitutions per base separating divergence from polymorphism, which is in accordance 446
with a recent study of naturally occurring hybrids in Carnivora (Allen et al., 2020). This 447
method, also known as the barcoding-gap method (Meyer and Paulay, 2005), allowed us to 448
show that the two subspecies of P. cristatus present a genetic divergence greater than the 449
threshold, whereas the divergence is slightly lower for the two subspecies of O. megalotis. 450
These results seem to indicate that the subspecies P. c. septentrionalis should be elevated to 451
species level (P. septentrionalis). Conversely, for O. megalotis, this first genetic indicator 452
seems to confirm the distinction at the subspecies level. However, mitochondrial markers 453
have some well-identified limitations (Galtier et al., 2009), and it is difficult to properly 454
determine a threshold between polymorphism and divergence across the Carnivora. The 455
measure of mtDNA sequence distances can thus be seen only as a first useful indicator for 456
species delineation. The examination of variation at multiple genomic loci in a phylogenetic 457
context, combined with morphological, behavioural and ecological data, is required to 458
establish accurate species boundaries. 459
The newly generated reference genomes allowed us to perform genome-wide 460
evaluation of the genetic differentiation between subspecies using short-read resequencing 461
data of a few additional individuals of both species. Traditionally, the reduction in 462
polymorphism in two subdivided populations (p within) compared to the population at large 463
(p between) is measured with several individuals per population (FST; Hudson et al., 1992). 464
However, given that the two alleles of one individual are the results of the combination of 465
two a priori non-related individuals of the population (i.e., the parents), with a large number 466
of SNPs, the measurement of heterozygosity can be extended to estimation of the 467
(sub)population polymorphism. Furthermore, in a panmictic population with recombination 468
along the genome, different chromosomal regions can be considered to be independent and 469
can be used as replicates for heterozygosity estimation. In this way, genome-wide analyses of 470
heterozygosity provide a way to assess the level of polymorphism in a population and a way 471
to compare genetic differentiation between two populations. If we hypothesize that the two 472
compared populations are panmictic, picking one individual or another of the population has 473
no effect (i.e., there is no individual with excess homozygous alleles due to mating preference 474
across the population), and the population structure can be assessed by comparing the 475
heterozygosity of the individuals of each population compared to the heterozygosity observed 476
for two individuals of the same population (see Methods). Such an index of genetic 477
differentiation, by measuring the level of population structure, could provide support to 478
establish accurate species boundaries. In fact, delineating species has been and still is a 479
complex task in evolutionary biology (Galtier, 2019; Ravinet et al., 2016; Roux et al., 2016). 480
Given that accurately defining the species taxonomic level is essential for a number of 481
research fields, such as macroevolution (Faurby et al., 2016) or conservation (Frankham et 482
al., 2012), defining thresholds to discriminate between populations or subspecies in different 483
species is an important challenge in biology. However, due to the disagreement on the 484
definition of species, the different routes of speciation observed in natura and the different 485
amounts of data available among taxa, adapting a standardised procedure for species 486
delineation seems complicated (Galtier, 2019). 487
As proposed by Galtier (2019), we decided to test the taxonomic level of the P. 488
cristatus and O. megalotis subspecies by comparing the genetic differentiation observed 489
between Eastern and Southern populations within these species to the genetic differentiation 490
measured for well-defined Carnivora species. Indeed, estimation of the genetic differentiation 491
either within well-defined species (polymorphism) or between two closely related species 492
(divergence) allowed us to define a threshold between genetic polymorphism and genetic 493
divergence across the Carnivora (Fig. 5). Given these estimates, and in accordance with 494
mitochondrial data, the two subspecies of P. cristatus (1) present more genetic differentiation 495
between each other than the two well-defined species of golden jackal (Canis aureus) and 496
wolf (C. lupus), and (2) present more genetic differentiation than the more polymorphic 497
species of the dataset, the lion (P. leo). Despite known cases of natural hybridisation reported 498
between C. aureus and C. lupus (Galov et al., 2015; Gopalakrishnan et al., 2018), the 499
taxonomic rank of these two species is well accepted. In that sense, given the species used as 500
a reference, both subspecies of P. cristatus seem to deserve to be elevated to species level. 501
The situation is less clear regarding the subspecies of O. megalotis. Indeed, while the genetic 502
differentiation observed between the two subspecies is significantly higher than the 503
polymorphic distances observed for all the well-defined species of the dataset, there is no 504
species in our dataset that exhibits equivalent or lower genetic divergence than a closely 505
related species. This illustrates the limits of delineating closely related species due to the 506
continuous nature of the divergence process (De Queiroz, 2007). The subspecies of O. 507
megalotis fall into the “grey zone” of the speciation continuum (De Queiroz, 2007; Roux et 508
al., 2016) and are likely undergoing speciation due to their vicariant distributions. To be 509
congruent with the genetic divergence observed across closely related species of the 510
Carnivora (according to our dataset), we thus propose that (1) the taxonomic level of the P. 511
cristatus subspecies be reconsidered by elevating the two subspecies P. c. cristatus and P. c. 512
septentrionalis to species level, and (2) the taxonomic level for the two subspecies of O. 513
megalotis be maintained. 514
Although there is a distinct genetic difference between Eastern and Southern 515
aardwolves, the evidence for a clear morphological difference is less obvious (Fig. 6, 516
Appendix 2 – Figure 1-3, Supplementary File 6-7). The earliest available name for the East 517
African aardwolf subspecies is P. c. septentrionalis (Rothschild, 1902). This subspecies was 518
first distinguished based on pelage characteristics of a specimen from Somaliland, which has 519
a creamy white pelage without any grey tinge, but washed slightly with buff in the neck and 520
side of the rump (Rothschild, 1902). Also, the striping pattern is less well defined and breaks 521
up into spots on the neck. In contrast, the Southern aardwolf subspecies P. c. cristatus was 522
described as ashy grey, front and sides of neck greyish white, black stripes broad and well 523
defined (Rothschild, 1902). Drake-Brockman (1910) also described Somali aardwolves as 524
pale buff with a dark greyish-buff head, but Cabrera (1910) was the first to ascribe diagnostic 525
characters to distinguish between the Eastern and Southern populations. He described a new 526
subspecies P. c. pallidior from Suakin (Sudan) as a very pale yellowish cream, almost white 527
ventrally and on the forehead. This contrasts with the grizzled grey of the forehead of P. c. 528
cristatus (Fig. 6). Cabrera (1910) also described how the fur of P. c. pallidior is unicoloured 529
and lacks the brown base of P. c. cristatus. This latter character appears to be consistent in an 530
Ethiopian specimen compared with three skins of Namibian and South African origin in the 531
collections of National Museums Scotland, although it would appear to be a difference in the 532
coloration of the underfur. However, a further specimen from Zimbabwe also has pale 533
underfur. In reviewing georeferenced photographs of aardwolves from throughout the range, 534
the striping pattern appeared to be variable, but overall East African specimens tended to be 535
paler, with more contrasting stripes with a pale forehead compared with the longer, greyer or 536
ochre-grey fur in Southern African specimens, which have less distinctive stripes (A.C.K. 537
pers. obs.). However, fur length and hence stripe distinctiveness may just be a phenotypic 538
response to lower temperatures at higher latitudes compared with equatorial East African 539
specimens. Cabrera (1910) also proposed differences in a skull measurement between Eastern 540
and Southern African aardwolves. Three specimens from Eastern Africa had a wider inter-541
orbital breadth than two from Southern Africa. However, his measurements also showed that 542
Eastern African aardwolves have larger postorbital breadths, brain case widths, and maxillary 543
widths at the canines. Adding in measurements of skulls from the literature (Allen et al., 544
1909; Heller, 1913; Hollister, 1918; Roberts, 1951, 1932) confirmed that postorbital breadth 545
is significantly greater in P. c. septentrionalis than P. c. cristatus but revealed no significant 546
differences between other skull measurements including condylobasal length of skull 547
(Appendix 2 – Figure 2-3, Supplementary File 7). However, as noted above from skins, 548
sample sizes are very limited and thus these morphological differences remain tentative 549
subject to examination of a much larger sample with more powerful geometric 550
morphometrics methods.These preliminary observations should nevertheless prompt a deeper 551
investigation of morphological and behavioural differences that have been reported between 552
the two proposed subspecies of aardwolf to formally validate our newly proposed taxonomic 553
arrangement. Our results might also have conservation implications, as the status of the two 554
distinct aardwolf species will have to be re-evaluated separately in the International Union for 555
Conservation of Nature (IUCN) Red List of Threatened Species (IUCN, 2020). 556
557
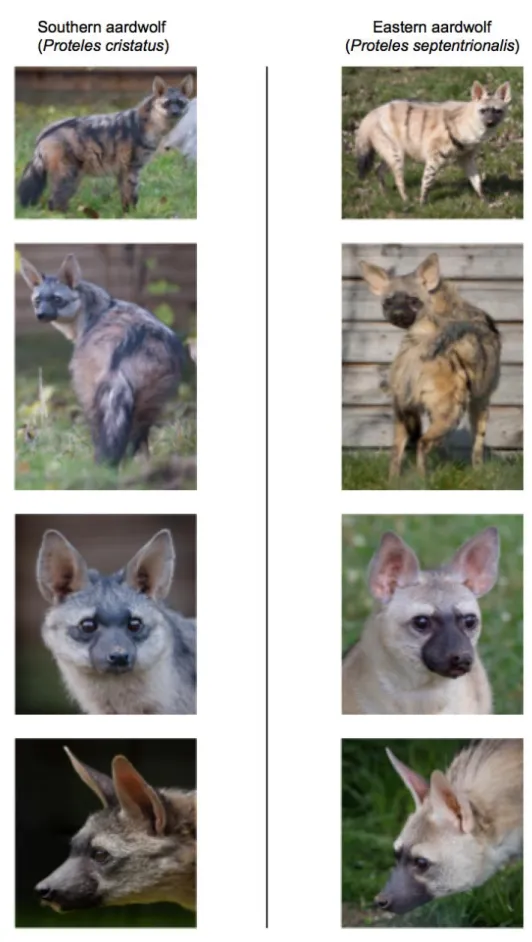
Figure 6. Phenotypic comparisons, highlighting the differences in fur coloration and stripe pattern, between 558
captive individuals of Eastern (P. septentrionalis) and Southern (P. cristatus) aardwolves held at Hamerton Zoo
559
Park (UK). All pictures copyright and used with permission from Robb Cadd.
561
Population size variation and environmental change
562
The Pairwise Sequentially Markovian Coalescent (PSMC) analyses revealed that the 563
Southern and Eastern African populations have different effective population-size estimates 564
over time, confirming that they have been genetically isolated for several thousand years, 565
which is more so for the aardwolf than for the bat-eared fox. This supports the hypothesis of 566
two separate events leading to the same disjunct distributions for the two taxa, in accordance 567
with mitochondrial dating. Nevertheless, the population trends are rather similar and are 568
characterized by continuous declines between 1 Mya and 100-200 kya that are followed by an 569
increase that is much more pronounced in the Southern populations of both species between 570
30-10 kya. The similar trajectories exhibited by both species suggest that they were under the 571
influence of similar environmental factors, such as climate and vegetation variations. 572
Aardwolves and bat-eared foxes live in open environments including short-grass 573
plains, shrubland, and open and tree savannas, and both are highly dependent on herbivorous 574
termites for their diet. Therefore, the fluctuation of their populations could reflect the 575
evolution of these semi-arid ecosystems determining prey abundance during the last million 576
years. However, the global long-term Plio-Pleistocene African climate is still debated. For 577
Eastern Africa, some studies have suggested an evolution towards increased aridity 578
(deMenocal, 2004, 1995), whereas others have proposed the opposite (Grant et al., 2017; 579
Maslin et al., 2014; Trauth et al., 2009). Therefore, our data support the latter hypothesis, as a 580
global long-term tendency towards a wetter climate in East Africa could have been less 581
favourable for species living in open environments. 582
Southern populations exhibit a similar decreasing trend between 1 Mya and 100 kya. 583
Once again, the relevant records appear contradictory. This could be the result of regional 584
variation across South Africa, with aridification in the Southwestern part and wetter 585
conditions in the Southeast (Caley et al., 2018; Johnson et al., 2016). Finally, the 30-10 kya 586
period appears to have been more humid (Chase et al., 2019; Chevalier and Chase, 2015; Lim 587
et al., 2016). This seems inconsistent with the large population increase detected in Southern 588
populations of both species; however, the large regions of the Namib Desert that are currently 589
unsuitable could have been more favourable in wetter conditions. 590
The global decrease in population size detected in the Southern and Eastern 591
populations could also reflect the fragmentation of a continuous ancestral range. The global 592
trend towards a wetter climate may have favoured the development of the tropical rainforest 593
in central Africa, creating a belt of unsuitable habitat. This is in line with previous studies 594
describing diverse biogeographical scenarios involving the survival and divergence of 595
ungulate populations in isolated savanna refuges during Pleistocene climatic oscillations 596
(Lorenzen et al., 2012). In this respect, it could be interesting to study population trends in 597
other species living in semi-arid environments and having a similar range as disconnected 598
populations. Interestingly, several bird species also have similar distributions including the 599
Orange River francolin (Scleroptila gutturalis), the greater kestrel (Falco rupicoloides), the 600
double-banded courser (Smutsornis africanus), the red-fronted tinkerbird (Pogoniulus 601
pusillus), the Cape crow (Corvus capensis) and the black-faced waxbill (Estrilda 602
erythronotos), supporting the role of the environment in the appearance of these disjunct 603
distributions. Finally, these new demographic results, showing recent population size declines 604
in both regions in both species, might be taken into account when assessing the conservation 605
status of the two distinct aardwolf species and bat-eared fox subspecies. 606
607
Genome-scale phylogeny of Carnivora
608
In this study, we provide a new phylogeny of Carnivora including the newly recognized 609
species of aardwolf (P. septentrionalis). The resulting phylogeny is fully resolved with all 610
nodes supported with UFBS values greater than 95% and is congruent with previous studies 611
(Doronina et al., 2015; Eizirik et al., 2010) (Fig. 5). Across the Carnivora the monophyly of 612
all superfamilies are strongly supported (Flynn et al., 2010) and are divided into two distinct 613
suborders: a cat-related clade (Feliformia) and a dog-related clade (Caniformia). On the one 614
hand, within the Feliformia, the different families and their relative relationships are well 615
supported and are in accordance with previous studies (Eizirik et al., 2010). There is one 616
interesting point regarding the Felidae. While almost all the nodes of the phylogeny were 617
recovered as strongly supported from the three phylogenetic inference analyses (ML 618
inferences, concordance factor analyses and coalescent-based inferences), one third of the 619
nodes (3 out of 9) within the Felidae show controversial node supports. This result is not 620
surprising and is consistent with previous studies arguing for ancient hybridisation among the 621
Felidae (Li et al., 2019, 2016). Another interesting point regarding the Feliformia and 622
particularly the Hyaenidae is the relationship of the two aardwolves. The two species, P. 623
cristasta and P. septentrionalis form a sister clade to the clade composed of the striped 624
hyaena (H. hyaena) and the spotted hyaena (C. crocuta), in accordance with previous studies 625
(Koepfli et al., 2006; Westbury et al., 2018) and the two subfamilies Protelinae and 626
Hyaeninae that have been proposed for these two clades, respectively. However, although the 627
phylogenetic inferences based on the supermatrix of 14,307 single-copy orthologues led to a 628
robust resolution of this node according to the bootstrap supports, both concordance factors 629
and coalescent-based analyses revealed conflicting signals with support for alternative 630
topologies. In this sense, the description and acceptance of the Hyaeninae and Protelinae 631
subfamilies still require further analyses, including genomic data for the brown hyaena 632
(Parahyena brunnea) (Westbury et al., 2018). 633
On the other hand, within the Caniformia, the first split separates the Canidae from 634
the Arctoidea. Within the Canidae the bat-eared fox (O. megalotis) is grouped with the red 635
fox (Vulpes vulpes) and the other representative of the Vulpini, but with a very short branch, 636
and concordance analyses indicate conflicting signals on this node. Regarding the Arctoidea, 637
historically the relationships between the three superfamilies of arctoids have been 638
contradictory and debated. The least supported scenario from the literature is that in which 639
the clade Ursoidea/Musteloidea is a sister group of the Pinnipedia (Flynn and Nedbal, 1998). 640
Based on different types of phylogenetic characters, previous studies found support for both 641
the clade Ursoidea/Pinnipedia (Agnarsson et al., 2010; Meredith et al., 2011; Rybczynski et 642
al., 2009) and the clade Pinnipedia/Musteloidea (Arnason et al., 2007; Eizirik et al., 2010; 643
Flynn et al., 2005; Sato et al., 2009, 2006; Schröder et al., 2009). However, investigations of 644
the insertion patterns of retroposed elements revealed the occurrence of incomplete lineage 645
sorting (ILS) at this node (Doronina et al., 2015). With a phylogeny inferred from 14,307 646
single-copy orthologous genes, our study, based on both gene trees and supermatrix 647
approaches, gives support to the variant Pinnipedia/Musteloidea excluding the Ursoidea as 648
the best supported conformation for the Arctoidea tree (Doronina et al., 2015; Eizirik et al., 649
2010; Sato et al., 2006). Interestingly, in agreement with Doronina et al. (2015), our 650
concordance factor analysis supports the idea that the different conformations of the 651
Arctoidea tree are probably due to incomplete lineage sorting by finding almost the same 652
number of sites supporting each of the three conformations (34.11%, 29.61% and 36.73%). 653
However, although trifurcation of this node is supported by these proportions of sites, a 654
majority of genes taken independently (gene concordance factors: 6,624 out of 14,307 genes) 655
and the coalescent-based species tree approach (quartet posterior probabilities q1 = 0.53, q2 = 656
0.24, q3 = 0.24) support the clade Pinnipedia/Musteloidea, excluding the Ursoidea. 657
Considering these results, the difficulty of resolving this trifurcation among the Carnivora 658
(Delisle and Strobeck, 2005) has likely been contradictory due to the ILS observed among 659
these three subfamilies (Doronina et al., 2015), which led to different phylogenetic scenarios 660
depending on the methods (Peng et al., 2007) or markers (Yu and Zhang, 2006) used. 661
Another controversial point, likely due to ILS (Doronina et al., 2015) within the Carnivora, is 662
the question regarding which of the Ailuridae and Mephitidae is the most basal family of the 663
Musteloidea (Doronina et al., 2015; Eizirik et al., 2010; Flynn et al., 2005; Sato et al., 2009). 664
Interestingly, our phylogenetic reconstruction based on mitogenomic data recovered the clade 665
Ailuridae/Mephitidae as a sister clade to all other Musteloidea families. The phylogenomic 666
inferences based on the genome-scale supermatrix recovered the Mephitidae as the most 667
basal family of the Musteloidea. This result is supported by both coalescent-based inferences 668
and concordance factors. In that sense, despite incomplete lineage sorting (Doronina et al., 669
2015), at the genomic level, it seems that the Mephitidae is the sister-group to all other 670
Musteloidea families. 671
Overall, the phylogenomic inference based on 14,307 single-copy orthologous genes 672
provides a new vision of the evolution of Carnivora. The addition of information from both 673
concordance factor analyses (Minh et al., 2020) and coalescent-based inference (Zhang et al., 674
2018) supports previous analyses showing controversial nodes in the Carnivora phylogeny. 675
Indeed, this additional information seems essential in phylogenomic analyses based on 676
thousands of markers, which can lead to highly resolved and well-supported phylogenies 677
despite support for alternative topological conformations for controversial nodes (Allio et al., 678
2020b; Jeffroy et al., 2006; Kumar et al., 2012). 679
680
Conclusions
681The protocol developed here to extract the best part of the DNA from roadkill samples 682
provides a good way to obtain genomic data from wildlife. Combining Illumina sequencing 683
data and Oxford Nanopore long-read sequencing data using the MaSuRCA hybrid assembler 684
allowed us to generate high-quality reference genomes for the Southern aardwolf (P. c. 685
cristatus) and the Southern bat-eared fox (O. m. megalotis). This cost-effective strategy 686
provides opportunities for large-scale population genomic studies of mammalian wildlife 687
using resequencing of samples collected from roadkill and opportunistic field collection. 688
Indeed, by defining a genetic differentiation index based on only three individuals, we 689
illustrated the potential of the approach for comparative genome-scale species delineation in 690
both species for which subspecies have been defined based on disjunct distributions and 691
morphological differences. Our results, based on both mitochondrial and nuclear genome 692
analyses, indicate that the two subspecies of aardwolf warrant elevation to species level (P. 693
cristatus and P. septentrionalis), but the O. megalotis subspecies do not warrant this status. 694
Hence, by generating reference genomes with high contiguity and completeness, this study 695
shows a practical application for genomics of roadkill samples. 696 697
Methods
698 Biological samples 699We conducted fieldwork in the Free State province of South Africa in October 2016 and 700
October 2018. While driving along the roads, we opportunistically collected tissue samples 701
from four roadkill specimens, from which we sampled ear tissue preserved in 95% ethanol: 702
two Southern bat-eared foxes (O. megalotis megalotis NMB 12639, GPS: 29°1’52”S, 703
25°9’38”E and NMB 12640, GPS: 29°2’33”S, 25°10’26”E), and two Southern aardwolves 704
(P. cristatus cristatus NMB 12641, GPS: 29°48’45”S, 26°15’0”E and NMB 12667, GPS: 705
29°8’42”S, 25°39’4”E). As aardwolf specimen NMB 12641 was still very fresh, we also 706
sampled muscle and salivary gland and preserved them in RNAlater™ stabilization solution 707
(Thermo Fisher Scientific). These roadkill specimens were sampled under standing permit 708
number S03016 issued by the Department of National Affairs in Pretoria (South Africa) 709
granted to the National Museum, Bloemfontein. These samples have been sent to France 710