HAL Id: hal-01201684
https://hal-mines-nantes.archives-ouvertes.fr/hal-01201684
Submitted on 23 Mar 2018
HAL is a multi-disciplinary open access
archive for the deposit and dissemination of
sci-entific research documents, whether they are
pub-lished or not. The documents may come from
teaching and research institutions in France or
abroad, or from public or private research centers.
L’archive ouverte pluridisciplinaire HAL, est
destinée au dépôt et à la diffusion de documents
scientifiques de niveau recherche, publiés ou non,
émanant des établissements d’enseignement et de
recherche français ou étrangers, des laboratoires
publics ou privés.
Thick wood particle pyrolysis in an oxidative atmosphere
Elias Daouk, Laurent Steene, Frederic Paviet, Sylvain Salvador
To cite this version:
Elias Daouk, Laurent Steene, Frederic Paviet, Sylvain Salvador.
Thick wood particle
pyroly-sis in an oxidative atmosphere.
Chemical Engineering Science, Elsevier, 2015, 126, pp.608-615.
Thick wood particle pyrolysis in an oxidative atmosphere
Elias Daouk
a,b,n, Laurent Van de Steene
a, Frederic Paviet
b, Sylvain Salvador
c aCIRAD UPR114 BioWooEB, 73 Avenue Jean-François Breton, 34398 Montpellier Cedex 5, FrancebGEPEA, UMR 6144 CNRS, Université de Nantes, Ecole des Mines de Nantes, ENITIAA, DSEE, 4 rue Alfred Kastler, BP 20722, 44307 Nantes Cedex 3, France cRAPSODEE, CNRS UMR 5203, Mines-Albi, Campus Jarlard, 81013 Albi Cedex 09, France
H I G H L I G H T S
! The oxidative pyrolysis was studied in thermally thin and thick regimes. ! The oxygen has a significant influence on oxidative pyrolysis.
! The effect of particle size was studied in thermally thick regime conditions. ! The temperatures inside a particle highlighted the exothermicity of the process.
Keywords: Wood Particle Oxidative pyrolysis Thermo-gravimetric analysis
a b s t r a c t
Oxidative pyrolysis of pine wood particles was analysed thermo-gravimetrically. The effects of the concentration of oxygen in the surrounding gas and of particle size were investigated. Three different oxygen concentrations (0%, 10% and 20% v/v) and three different sized cylindrical pine wood samples (4 mm, 8 mm and 12 mm in diameter and 15 mm long) were tested. Two types of Macro-TG apparatuses were used; the first was non-isothermal and was used at a heating rate of 20 1C/min, and the second was isothermal used at two temperatures, 400 1C and 600 1C. In the low heating rate non-isothermal apparatus, results showed that oxygen had a strong influence on pyrolysis behaviour, but particle size did not. In the high heating rate isothermal apparatus, particle size had a significant influence on conversion: transfer phenomena limit oxidative pyrolysis.
1. Introduction
Biomass for energy production is of growing importance worldwide due to its potentially influence on greenhouse gas effect reduction if substituted to fossil fuels. Biomass is one of the few renewable sources which can be stored and consequently does not suffer from inter-mittency, unlike wind or sun. In addition, biomass can be trans-ported over long distances, unlike hydro and geothermal power. The main challenge today is using renewable biomass fuels with much higher efficiencies than achieved in their traditional uses. Thermo-chemical conversion of biomass has been the subject increasing attention, particularly gasification, which enables conversion of biomass into combustible gas, mechanical and electrical power and synthetic fuels and chemicals (Di Blasi, 2000).
Fixed bed technologies are particularly suitable for gasification in small power plants because of their high efficiency (o5 MWth). The gasification process involves a series of thermo-chemical
transformations: biomass drying and pyrolysis, oxidation of vola-tile matter and char gasification. Staged fixed bed technologies were recently developed to optimize the process by limiting tar content. The NOTARsgasifier sold by XyloWatt is one example of this technology. The two main steps, pyrolysis of the biomass and gasification of the char are performed in two separate reactors inside the staged fixed bed gasifier. Understanding and controlling pyrolysis is crucial for process optimisation as the yields and the quality of the different pyrolysis products – gas, tar and char – have a major impact on the process as a whole. One of the main challenges of this step in process optimisation is supplying the necessary energy. One solution is burning part of the biomass by introducing a small amount of air into the pyrolysis reactor to provide the energy needed for the process. This solution is pro table with respect to both the efficiency of the thermal process and gas quality. This type of process is called “auto-thermal” and this type of pyrolysis is called “oxidative pyrolysis”. In the literature, it is reported that the presence of oxygen greatly affects the behaviour of the pyrolysis (Amutio et al., 2012; Chaos et al., 2012; Chen et al., 2011; Su et al., 2012).
This study focuses on the oxidative pyrolysis of a thick wood particle. It should be noted that the fixed bed process operation is
nCorresponding author at: CIRAD UPR114 BioWooEB, 73 Avenue Jean-François
Breton, 34398 Montpellier Cedex 5, France. E-mail address:elias.daouk@cirad.fr(E. Daouk).
limited by the size of the particle, which has to be more than a few millimetres to avoid too high pressure drop through the char bed when the conversion progresses. In addition, the use of thick wood particles as a feedstock reduces grinding costs.
Many studies have been conducted under inert atmosphere to investigate the intrinsic kinetics of pyrolysis (Di Blasi, 2008; Gu et al., 2013; Lu et al., 2013; Ranzi et al., 2008). This is the case of thermally thin regime. Recently, there has been an increase in studies on oxidative pyrolysis (Amutio et al., 2012; Anca-Couce et al., 2012; Branca and Di Blasi, 2004; Lautenberger and Fernandez-Pello, 2009;
Shen et al., 2009; Su et al., 2012; Takashi and Hidesaburo, 1992). The
studies have been carried out in thermo-balance with different oxygen concentrations in the inlet gas stream to study the effect of oxygen on the biomass pyrolysis process. Other authors compared these results with those obtained under inert atmosphere (Amutio
et al., 2012; Branca and Di Blasi, 2004; Takashi and Hidesaburo, 1992).
In oxidative atmosphere, the pyrolysis start at lower temperature and the degradation is faster than in inert atmosphere. In thermo-gravimetric experiments, DTG curves of biomass oxidative pyrolysis showed two separate peaks versus one peak in inert conditions: the first peak was attributed to simultaneous pyrolysis and oxidation of the raw material and the second peak logically to weight loss during oxidation of the char.Shen et al. (2009)reported that the DTG curves were separated into two stages, with the first stage (low temperature region) in the range of 200–370 1C and the second stage (high temperature region) in the range of 370–490 1C. According to
Branca and Di Blasi (2004), for the low temperature region,
degrada-tion characteristics were qualitatively similar to those observed in pure nitrogen. From a quantitative point of view, the presence of oxygen has been reported to predict and increase the devolatilization peaks: the DTG peaks were about 1.5 times higher than without oxygen. These results have been confirmed by other authors (Amutio et al., 2012; Su et al., 2012). In all these studies of oxidative pyrolysis, small milled samples of biomass were used for the experiments in order to reduce the effects of heat and mass transfer limitations.
At the particle scale, the internal temperature and mass gradi-ents can be significant and transport phenomena need to be taken into account along with kinetics derived from the thermally thin regime studies. The Biot number as defined in Eq.(1)can determine whether or not the temperature inside the wood particle will vary significantly:
Bi ¼hdλ ð1Þ
where h is the external heat transfer coefficient, is the thermal conductivity of wood and d is the wood particle diameter.
Bryden and Hagge (2003) defined three regimes of wood
pyrolysis using Biot number:
!
Bio0.2, thermally thin regime, the particle temperature is nearly uniform,!
0.2oBio10, thermally thick regime, the internal and external rates of heat transfer are of comparable magnitude,!
Bi410, thermal wave regime, the internal rate of heat transfer is slow relative to the external rate of heat transfer.Many studies have reported on the pyrolysis of mm size particle under inert atmosphere (Haydary et al., 2012; Johansson et al., 2007;
Larfeldt et al., 2000; Peters and Bruch, 2003; Sadhukhan et al., 2008).
The objective of this study was to investigate the effect of oxygen during oxidative pyrolysis of a thick wood particle. As a consequence, we paid particular attention to the influence of the size of the particle, the concentration of oxygen, the heating rate and tempera-ture on oxidative pyrolysis. The second objective of this study was to create a database which can be used to validate a comprehensive model of oxidative pyrolysis or to determine apparent reactivities.
Experimental determination of apparent reactivities, which take both intrinsic kinetics and heat and mass transfer into account, offers an appropriate solution to the problem of integrating phenomena at particle scale in a complex reactor model at fixed bed scale (Blondeau
and Jeanmart, 2011; Teixeira et al., 2014). Consequently, the research
work presented in this paper is also the first step in modelling auto-thermal pyrolysis reactors.
2. Experimental devices and procedures
The samples consisted of cylindrical pine wood particles. Because cylindrical samples are homogeneous in size and compo-sition, they make it easier to obtain repeatable results during experiments than wood chips. Our samples were all 15 mm long. We used three different diameters: 4, 8 and 12 mm to study the influence of particle size on pyrolysis. The orientation of the fibres is parallel to the sample axis. The particle diameter selected was representative of the thickness of wood chips, which has pre-viously been shown to be a characteristic dimension for gasifica-tion (Van de steene et al., 2011). The range of diameters was large enough to study the influence of particle size on oxidative pyrolysis. The results of proximate and ultimate analyses of the pine wood used are listed inTable 1.
Two different types of experiments were carried out in this study. For the first, we used a low heating rate thermo-gravimetric (TG) analyser at CIRAD, France. A thermally thin regime occurs during these experiments. For the second type, we used a high heating rate macro-TG apparatus at Mines-Albi, France, making it possible to reach thermally thick regime with 0.2oBio10. From additional experiments, we can estimate a Biot number 0.3oBio7 for the 400 1C experiments and 0.3oBio10 for the 600 1C experi-ments. Conducting the experiments in a TG apparatus allows us to compare the effect of oxygen on a thick particle with results obtained in the literature at a micro scale, i.e. with milled samples. 2.1. Thermally thin regime experiments
Fig. 1shows the experimental setup used for the experiments. The
mass loss of the sample and the temperature were simultaneously recorded as a function of time. The temperature of the surrounding particle atmosphere was measured a few millimetres below the crucible. The equipment consisted of a micro-balance (Rubotherm), a reactor, a furnace and a thermocouple. The diameter of the reactor was 25 mm. This device made it possible to reach a maximum heating rate of 20 1C/min. Nitrogen 4.5 (99.995% purity) and a mixture 80:20 (80% nitrogen, 20% oxygen) were each connected to a mass flow meter-controller with a range of 0–400 N ml/min enabling control of flow rates of the incoming gas and hence the desired oxygen content in the owing gas. Three oxygen concentrations (0%, 10% and 20%) were
Table 1
Proximate and ultimate analysis of biomass pine wood sample on a dry basis.
Parameters Moisture content (%) 10.570.2 Proximate analysis (wt%) Volatile matter 83.370.5 Fixed carbon 15.470.7 Ash 1.370.2 Ultimate analysis (wt%) C 52.270.5 H 670.25 N 0.170.05 O (by difference) 41.770.75 LHV (MJ/kg) 19.670.12
tested. The choice of the gas flow rate of 400 N ml/min is discussed below inSection 3.2.2. All measurement of mass loss, temperatures and flow rates were performed by an acquisition system with 0.2 Hz frequency. Thermocouples and flow-meters were connected to an ISK 200 converter/amplifier located upstream from the computer.
Samples were suspended in a grid basket above a crucible in the reactor (see Section 3.2.1). The sample axis is perpendicular to the furnace axis. The crucible had a dual role: it allowed recovery of small fragments that may break away from the particle during conversion and it served as ballast. In the experiments, the samples were heated from room temperature to 120 1C followed by a plateau of 30 min (drying phase), and from this temperature to 800 1C (degradation phase). All the experiments were carried out under a constant heating rate of 20 1C/min.
2.2. Thermally thick regime experiments
The main drawback of the previously described equipment is the low heating rate compared to that used in industrial reactors.
Milhé et al. (2013)found a heating rate in the order of 120–180 1C/
min in their continuous fixed bed reactor (CFiBR). The apparatus, whose principle is similar to the one depicted inFig. 1is described in detail in a previous work (Guizani et al., 2013). In this device, transfer phenomena are more limiting and can affect the pyrolysis conversion.
The macro-TG apparatus consists of three major parts – the heating system including a gas preheater and an electrically-heated reactor, the gas flow control system consisted of two mass-flow meters/controllers and the weighing system that com-prises an electronic scale with an accuracy of 70.1 mg, a stand and a basket to hold the samples. The diameter of the reactor was 75 mm. The temperature was controlled to ensure good tempera-ture homogeneity throughout the furnace. The mass loss was performed by an acquisition system with 10 Hz frequency.
Here, after heating the reactor to the desired temperature (400 1C or 600 1C), the grid basket with the dried sample was rapidly placed in the hot furnace, in less than 15 s, and the sample was pyrolysed. Oxygen content in the reactive gas was adjusted to 0%, 10% or 20%.
A repeatability test was conducted before each apparatus was used. These tests confirmed the good repeatability of the TG curves needed to make this study.
Additional experiments were carried out to measure changes in the temperature inside a thick particle at different radii during the oxidative pyrolysis in both apparatus. Two thin thermocouples of 0.5 mm diameter were inserted 7 mm in the axial direction of a 12 mm particle. One is at the centre of the particle. The second is 2 mm from the lateral surface. Mass loss was not measured at the same time as changes in temperature, because the thermocouples may disturb the mass loss measurement.
3. Results and discussion 3.1. TG and DTG curves
3.1.1. Thermally thin regime experiments
For each experiment, TG and DTG curves were drawn as a function of temperature. TG curves represent the ratio of the sample weight (m) to the initial weight (mi) after drying. To analyse and to compare the results, DTG curves were numerically obtained using the time derivative of the TG curves. As the noise of the mass signal is amplified by derivation, DTG curves were numerically smoothed using the moving average technique with a filter width n¼10. Typical examples of TG and DTG for oxidative pyrolysis are shown inFig. 2. In an oxidative environment, three steps were identified in the TG and DTG curves, as reported in the literature (Amutio et al., 2012; Shen et al., 2009; Su et al., 2012). These were defined as dehydration, oxidative pyrolysis and char oxidation.
To compare experimental results concerning the oxidative pyrolysis step,Su et al. (2012)defined several temperature indexes as shown in Fig. 2. “Ts” is the start temperature, “Te”is the end temperature and “Tp” is the peak temperature of the oxidative pyrolysis phase. Two other indexes were defined as the pyrolysis reactivity index “Rp¼(d(m/mi)/dt)max” and the average reaction rate “Re”defined as the ratio of mass loss fraction to time with respect to the temperature range [Ts–Te].
3.1.2. Thermally thick regime experiments
TG and DTG curves were drawn as a function of time. In this case, the noise in the TG curves is higher because of the disconti-nuities observed in the experimental mass loss curves, which are discussed in detail inGuizani et al. (2013). These discontinuities are one consequence of the balance. In our case, TG and DTG curves were numerically smoothed using the polynomial smoothing tech-nique in a least-squares sense. For the TG curves, a filter width n¼150 was used. The derivative of the TG curves was calculated using the smoothed TG curves and then DTG curves are smoothed with a filter width n¼50.
Fig. 1. Schematic diagram of the experimental setup.
0 0.001 0.002 0.003 0.004 0.005 0.006 0 0.2 0.4 0.6 0.8 1 1.2 0 100 200 300 400 500 600 700 800 DTG (s -1) TG (m/m i ) Temperature (°C) TG DTG 1ststep dehydration 2ndstep oxidative pyrolysis 3rdstep char oxidation Ts Tp Te
3.2. Experimental calibrations 3.2.1. Effect of the crucible
The presence of a crucible can influence the degradation of samples in TGA experiments. Indeed, if the particle is placed directly in the crucible, the sweeping gas cannot reach the entire surface of the particle. With respect to heat and mass transfer, there is thus a risk that the thermochemical situation is not that of the isolated particle. So, to observe the effect of the crucible on pyrolysis, a grid basket was designed and installed in each apparatus.
Thermally thin regime experiments. Two experiments were carried out with a particle diameter of 4 mm in an atmosphere with 10% O2v/v. In the first experiment, the sample wood particle was placed in the crucible, and in the second experiment, the wood particle was placed on the grid basket. The results are shown
in Fig. 3. It can be seen that the difference between the two
experiments was not negligible: the curves shifted to the low temperature range, and oxidative pyrolysis reactivity (first peak of DTG) increased when the grid basket was used. In this case, we can say that degradation of the biomass sample was limited by external transfer phenomena due to crucible.
Thermally thick regime experiments. Similar tests were per-formed in the apparatus in which the particle was placed on a grid basket above the crucible. The same effect was observed as in the thermally thin regime experiments. As a consequence, a grid basket was used for both devices.
3.2.2. Determination of the sweeping gas flow
In experiments under inert atmosphere, the gas flow rate has no influence on the degradation process. However, in an oxidative atmosphere, the sweeping gas flow rate has to be high enough to avoid limiting oxygen transfer to the particle surface.
To determine the minimum flow rate in the thermally thin regime macro-TG apparatus, four tests were carried out with a varying gas flow rate: 50, 250, 400 and 800 N ml/min. A particle diameter of 12 mm and an oxygen concentration of 10% were used. The results inFig. 4show that above 400 ml/min, varying the gas flow rate had no influence on the TG and DTG curves. We can thus consider that above this value, the gas flow rate does not affect degradation. This justified the choice of a sweeping gas flow rate of 400 ml/min for the tests. Additional tests were carried out to determine the flow rate in the thermally thick regime apparatus and a gas flow rate of 10 N l/min was chosen for this type of tests. 3.3. Effect of oxygen on conversion
The oxygen fraction had a significant influence on pyrolysis kinetics of wood particles. Fig. 5 shows the thermogravimetric
mass change curve (TG) and the derivative thermogravimetric curve (DTG) under different atmospheres (inert, 10% and 20% vol% O2), for the 4 mm diameter particles, as a function of temperature, from thermally thin regime experiments. Characteristic pyrolysis parameters, as described in Section 3.1, are summarized inTable 2
for all particle sizes and atmospheres. We observed that the oxidative pyrolysis phase occurred in a lower temperature range when the oxygen concentration in the sweeping gas was increased, as shown by the decrease in Ts, Tpand Te. For example, for the 4 mm particles, Te was about 421 1C under inert atmo-sphere and about 374 1C in a 20%O2atmosphere, i.e. 47 1C lower. This difference increased with an increase in the size of the particle. For example, for the 12 mm particles, Te was about
0 0.001 0.002 0.003 0.004 0.005 0.006 0 0.2 0.4 0.6 0.8 1 1.2 0 200 400 600 800 D T G (s -1) T G (m /mi ) Temperature (°C) crucible grid
Fig. 3. Effect of the crucible on pyrolysis.
0 0.001 0.002 0.003 0.004 0.005 0.006 0 0.2 0.4 0.6 0.8 1 1.2 0 200 400 600 800 DTG (s -1) T G (m /mi ) Temperature (°C) 50 ml/min 250 ml/min 400 ml/min 800 ml/min
Fig. 4. Influence of sweeping gas flow rate with an oxygen concentration of 10%.
0 0.2 0.4 0.6 0.8 1 1.2 0 200 400 600 800 T G (m /mi ) Temperature (°C) 0% O2 10% O2 20% O2 0 0.001 0.002 0.003 0.004 0.005 0.006 0.007 0.008 0 200 400 600 800 DTG (s -1) Temperature (°C) 0% O2 10% O2 20% O2
Fig. 5. Influence of oxygen concentration on conversion of 4 mm particles at low HR.
472 1C under inert atmosphere and 399 1C in a 20%O2atmosphere, i.e. 73 1C lower.
Moreover, the DTG peak of the oxidative pyrolysis phase, which represents the maximum reaction rate, was higher when the oxygen concentration increased. In a 20%O2 atmosphere, the maximum reaction rate was about 1.5 times higher than under inert atmosphere as can be seen by comparing the Rpvalues in
Table 2. Our results are in a good agreement with those in the
literature (Amutio et al., 2012; Anca-Couce et al., 2012; Branca and
Di Blasi, 2004; Chen et al., 2011; Su et al., 2012), where the same
effect of increased DTG peak was observed which an increase in the oxygen concentration. Ohlemiller, cited in Carvalho et al.
(2002), explained that the oxidative pyrolysis phase consists of
two reactions: wood pyrolysis and wood oxidation, as wood oxidation is exothermic, it speeds up pyrolysis.
Woody biomass has three main components, hemicellulose, cellulose, lignin and smaller amounts of extractives and ash
(Burhenne et al., 2013; Carrier et al., 2011; Gao et al., 2013; Ranzi
et al., 2008).Branca and Di Blasi (2004)andGrønli (1996)linked
the shoulder that appears at the beginning of the DTG curve with hemicellulose degradation and the peak with cellulose degrada-tion. Under inert atmosphere, our results (Fig. 5) show that the pyrolysis of hemicellulose mainly occurred between 220 1C and 340 1C and the pyrolysis of cellulose between 340 1C and 410 1C. These results are in good agreement with those of Yang et al.
(2007). In an oxidative atmosphere, our results revealed a less
clear hemicellulose shoulder than under inert atmosphere.
Anca-Couce et al. (2012)put this down to an overlap of the cellulose and
hemicellulose peaks, causing a higher maximum reaction rate in presence of oxygen.
3.4. Effect of particle size on conversion
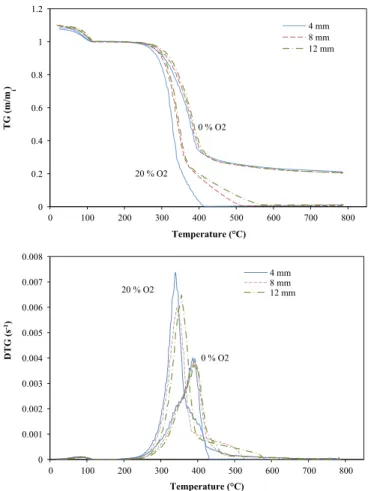
Fig. 6 shows TG and DTG curves for the different particle
diameters in the two atmospheres, 0% and 20% O2, for the thermally thin regime experiments. Generally, particle size had no significant influence on the oxidative pyrolysis phase at a heating rate of 20 1C/min in this range of diameters. This can be explained by a slow heating rate and the particle temperature is nearly uniform. Fig. 6 shows a short delay in the TG and DTG curves with an increase in the diameter of the particle. For example, Te increased from 374 1C to 391 1C and 399 1C for the particle sizes 4 mm, 8 mm and 12 mm, respectively, in an atmo-sphere with 20% O2. When Rpand Reare compared between the results obtained with 4 mm and 12 mm particles, the differences are more significant. In the case of a 4 mm particle, two peaks appeared in DTG curve revealing the oxidative pyrolysis and char oxidation. The characteristic parameters are similar to those reported by Su et al. (2012) for intrinsic kinetics. Table 2 also shows that, under the same atmosphere, the maximum reaction
rate (Rp) was the same for the three particle sizes. In the oxidative environments, smaller Rpwere obtained.
From the literature, we can deduce, that particle size has a significant effect on thermo degradation behaviour at high heating temperatures (Di Blasi, 2008) corresponding to a higher Biot number greater than 0.2. In order to demonstrate the effect of particle size on oxidative pyrolysis, thermally thick regime experi-ments were performed using the Mines-Albi Macro-TG apparatus with 0.2oBio10. Figs. 7 and 8 show the results obtained at furnace temperature of 600 1C and 400 1C in the different atmo-spheres and with the 4 and 12 mm diameter particles, respec-tively. In contrast to previous experiments, the particle size had a significant effect on conversion. At a furnace temperature of 600 1C, the reaction kinetics slowed down with an increase in the particle diameter. Conversion time for 12 mm particles was around twice that of that required for 4 mm particles. The same qualitative results were obtained byHaydary et al. (2012)with tire particles with diameters ranging between 4 and 8 mm. In the experiments at 400 1C, the conversion time was twice longer than at 600 1C. In addition, the DTG curves show that the peak was smaller when the particle size was increased. In the experiments at 600 1C, the peaks were about three times smaller for 12 mm particles than for 4 mm particles. At 400 1C, DTG peaks were obtained that were about 2–3 times smaller than those obtained at 600 1C, and the peaks for 12 mm particles were about 1.5 times smaller than for 4 mm particles. When the thermally thick regime occurs, heat and mass transfer limitations have a significant impact on conversion and logically, the impact is higher when the particle size is increased and the Biot number increased. Also the oxidation could lead to a higher porosity and thus a better mass transfer.
Table 2
Characteristic parameters of pyrolysis under different conditions, in the low HR experiments. Parameters Ts(1C) Te(1C) Tp(1C) Rp(s% 1) Re(s% 1) 4 mm Inert 218 421 392 0.004 0.00113 10%O2 209 396 354 0.0053 0.00166 20%O2 208 374 339 0.0074 0.00171 8 mm Inert 216 463 391 0.0038 0.00098 10%O2 213 412 363 0.0048 0.00123 20%O2 209 391 350 0.006 0.00146 12 mm Inert 221 472 394 0.0037 0.00097 10%O2 221 421 368 0.005 0.00123 20%O2 221 399 356 0.0065 0.00149 0 0.2 0.4 0.6 0.8 1 1.2 0 100 200 300 400 500 600 700 800 TG (m/m i ) Temperature (°C) 4 mm 8 mm 12 mm 0 % O2 20 % O2 0 0.001 0.002 0.003 0.004 0.005 0.006 0.007 0.008 0 100 200 300 400 500 600 700 800 DTG (s -1) Temperature (°C) 4 mm 8 mm 12 mm 0 % O2 20 % O2
Fig. 6. Influence of particle size on conversion under inert atmosphere and in an atmosphere with 20% O2at low HR.
3.5. Temperature changes inside a thick particle
In this section, we present the results of temperature measure-ments inside a 12 mm thick particle in the two types of experi-ments, thermally thick and thermally thin regimes.Figs. 9 and 10
show the measured temperature profiles at the centre of the particle and at a distance of 2 mm from the lateral surface of the particle in an atmosphere with 10% O2:Fig. 9shows the thermally thin regime experiment with a heating rate of 20 1C/min and
Fig. 10shows the thermally thick regime experiment at 600 1C.
For the thermally thin regime experiment, the temperature first increased until it reached an inflexion point at the end of oxidative pyrolysis phase, then increased strongly until it reached a small plateau. Subsequently, the temperature increased linearly throughout the char oxidation phase. During the oxidative pyr-olysis phase, the particle was isothermal. At the end of oxidative pyrolysis a difference between the two temperatures appeared, and a difference of 30–40 1C was observed during char oxidation.
In Fig. 9, the centre temperature exceeds the surrounding
tem-perature at a certain time during the final phase of oxidative pyrolysis. This can be explained by the exothermic reactions from the pyrolysis degradation contribution (Larsen et al., 2006; Park
et al., 2010) or from the oxidative reactions contribution.
Park et al. (2010)showed that the temperature profiles during
pyrolysis in inert atmosphere, inside a spherical wood particle, can be divided in two distinct sequential thermal regimes. The first
one is an endothermic reaction that causes a plateau of tempera-ture at the particle centre. The second is exothermic reaction that causes a steep temperature increase after the plateau. The exothermic period corresponds to the conversion of the inter-mediate solid to final char. Solid mass show a weak decrease during this “exothermic period”.Larsen et al. (2006)confirmed this point, by saying that the observed rise in temperature can be a consequence of an exothermic reaction during the pyrolysis phase.
Figs. 11 and 12, for the thermally thin and thick regimes respectively,
Fig. 7. High HR results at a furnace temperature of 600 1C: influence of particle size on thermal degradation in different atmospheres.
Fig. 8. High HR results at a furnace temperature of 400 1C: influence of particle size on thermal degradation in different atmospheres.
0 0.1 0.2 0.3 0.4 0.5 0.6 0.7 0.8 0.9 1 0 150 300 450 600 750 900 2500 2700 2900 3100 3300 3500 3700 3900 T G (m /mi ) Temperature (°C) Time (s) surrounding Temperature 2 mm from the surface centre TG Char oxidation Oxidative pyrolysis Heating
Fig. 9. Temperature profile inside a particle with a diameter of 12 mm and TG curve for an atmosphere containing 10% O2in the low HR apparatus.
show the contribution of the oxygen to the exothermic reactions, by comparing temperatures at the centre in inert and oxidative atmo-spheres. Oxygen has a major contribution to the exothermic reaction period. The maximum temperature at the centre, at the end of the oxidative pyrolysis phase, is about 480 1C for inert atmosphere, 520 1C for 10% O2 and 530 1C for 20% O2, for the thermally thin regime experiments.
For the thermally thick regime experiment, the temperature first increased until it reached an inflexion point around t¼70 s, then increased strongly until it was higher than the furnace temperature: overheating of the particle was also observed for the thermally thick regime experiments. The oxygen had also, in this case, a major role on the exothermic reactions. As we can see
fromFig. 12, the maximum temperature is about 590 1C in an inert
atmosphere, and 685 1C and 820 1C when respectively 10% and 20% of O2 are injected. The heating rates at the centre of the particle were estimated to be 350 1C/min, and at a distance of 2 mm from the lateral surface of the particle, to be around 400 1C/min. Significant differences between the two thermocouples were recorded. This confirms the strong transfer limiting phenomena in the case of the thermally thick regime when Bi40.2 from the beginning of the experiment. The rise in temperature at the end of oxidative pyrolysis phase appears clearly in the centre of the particle and less at 2 mm from the lateral surface. It could be observed inside the particle thanks to the limitation of internal heat transfer of the particle which delayed the temperature increase caused by external heat transfers, below the ambient temperature. 4. Conclusions
The aim of this work was to analyse the influence of oxygen concentration, particle size and temperature on oxidative pyrolysis of wood, using two different Macro-TG apparatuses capable of operating with thermally thin and thick regime.
Preliminary experiments showed that placing the particle in a crucible influenced the degradation of the sample as it limited by heat/mass transfer, so a grid basket was used to hold the particle instead. In an oxidative atmosphere, a minimum sweeping gas flow was determined to prevent O2availability limiting the conversion. At a heating rate of 20 1C/min, thermally thin regime can be assumed even for particle until 12 mm diameter.
Thermally thin regime experiments revealed that oxygen has a significant influence on oxidative pyrolysis. We observed that the peak of wood pyrolysis was higher and appeared at a lower temperature when the oxygen concentration was increased. In oxidative pyrolysis, the hemicellulose degradation shoulder was less clear than under inert atmosphere.
Thermally thick regime experiments, with 0.2oBio10 high-lighted the effect of particle size on oxidative pyrolysis. The oxidative pyrolysis phase was slower with bigger particles. For example, at a furnace temperature of 600 1C, the 12 mm particle took twice as long to complete the oxidative pyrolysis phase than the 4 mm particle. In addition, the peak in the DTG curve was about 3 times smaller for the 12 mm particles than for the 4 mm particles. At a furnace tempera-ture of 400 1C, the effect of particle size was qualitatively the same as at 600 1C.
The temperature measurements at the centre of a thick particle and close to the lateral surface of the particle showed that heat transfer was only limited when thermally thick regime occurs. In addition, we highlighted the high exothermicity of the wood oxidative pyrolysis in both thermally thin and thick regimes.
These experimental results on the evolution of the conversion rate and of the temperature inside the particle are original and should facilitate the development of numerical models of the oxidative pyrolysis of biomass particles.
Nomenclature and units
λ sample conductivity (W/m K) d sample diameter (m)
h heat transfer coefficient (W/m2K) LHV lower heating value (MJ/kg) m sample weight (kg)
mi initial sample weight after drying (kg) Re average reaction rate (s% 1)
Rp pyrolysis reactivity index (s% 1) t time (s) 0 0.1 0.2 0.3 0.4 0.5 0.6 0.7 0.8 0.9 1 0 150 300 450 600 750 0 50 100 150 200 TG (m/m i ) Temperature (°C) Time (s)
2 mm from the surface centre
TG
Oxidative
pyrolysis Char oxidation
Fig. 10. Temperature profile inside a particle with a diameter of 12 mm and TG curve in an atmosphere containing 10% O2at 600 1C in the high HR apparatus.
0 100 200 300 400 500 600 700 800 900 2500 2700 2900 3100 3300 3500 Temperature (°C) Time (s) 0 %O2 10 %O2 20 %O2
Fig. 11. The centre temperature in the three different atmospheres for a 12 mm particle in thermally thin regime.
0 100 200 300 400 500 600 700 800 900 1000 0 20 40 60 80 100 120 140 Temperature (°C) Time (s) 0% O2 10% O2 20% O2
Fig. 12. The centre temperature in the three different atmospheres for a 12 mm particle in thermally thick regime at 600 1C.
Te end temperature (1C) Tp peak temperature (1C) Ts start temperature (1C) Bi Biot number
TG thermogravimetric mass change curve DTG derivative thermogravimetric curve HR heating rate
Acknowledgements
This research was partly funded by CIRAD (French agricultural research centre for development) and Mines-Nantes (French graduated school of engineering), in collaboration with Mines-Albi (French graduated school of engineering).
References
Amutio, M., Lopez, G., Aguado, R., Artetxe, M., Bilbao, J., Olazar, M., 2012. Kinetic study of lignocellulosic biomass oxidative pyrolysis. Fuel 95, 305–311.
Anca-Couce, A., Zobel, N., Berger, A., Behrendt, F., 2012. Smouldering of pine wood: kinetics and reaction heats. Combust. Flame 159, 1708–1719.
Blondeau, J., Jeanmart, H., 2011. Biomass pyrolysis in pulverized-fuel boilers: derivation of apparent kinetic parameters for inclusion in CFD codes. Proc. Combust. Inst. 33, 1787–1794.
Branca, C., Di Blasi, C., 2004. Global interinsic kinetics of wood oxidation. Fuel 83, 81–87.
Bryden, K.M., Hagge, M.J., 2003. Modeling the combined impact of moisture and char shrinkage on the pyrolysis of a biomass particle☆. Fuel 82, 1633–1644.
Burhenne, L., Messmer, J., Aicher, T., Laborie, M.-P., 2013. The effect of the biomass components lignin, cellulose and hemicellulose on TGA and fixed bed pyrolysis. J. Anal. Appl. Pyrolysis.
Carrier, M., Loppinet-Serani, A., Denux, D., Lasnier, J.-M., Ham-Pichavant, F., Cansell, F., Aymonier, C., 2011. Thermogravimetric analysis as a new method to determine the lignocellulosic composition of biomass. Biomass Bioenergy 35, 298–307.
Carvalho, E.R., Gurgel Veras, C.A., CarvalhoJr, J.A., 2002. Experimental investigation of smouldering in biomass. Biomass Bioenergy 22, 283–294.
Chaos, M., Khan, M.M., Dorofeev, S.B., 2012. Pyrolysis of corrugated cardboard in inert and oxidative environments. Proc. Combust. Inst..
Chen, H., Zhao, W., Liu, N., 2011. Thermal analysis and decomposition kinetics of Chinese forest peat under nitrogen and air atmospheres. Energy Fuels 25, 797–803.
Di Blasi, C., 2000. Dynamic behaviour of stratified downdraft gasifiers. Chem. Eng. Sci. 55, 2931–2944.
Di Blasi, C., 2008. Modeling chemical and physical processes of wood and biomass pyrolysis. Prog. Energy Combust. Sci. 34, 47–90.
Gao, N., Li, A., Quan, C., Du, L., Duan, Y., 2013. TG–FTIR and Py–GC/MS analysis on pyrolysis and combustion of pine sawdust. J. Anal. Appl. Pyrolysis 100, 26–32.
Grønli, M.G., 1996. A Theoretical and Experimental Study of the Thermal Degrada-tion of Biomass. Norwegian University of Science and Technology.
Gu, X., Ma, X., Li, L., Liu, C., Cheng, K., Li, Z., 2013. Pyrolysis of poplar wood sawdust by TG-FTIR and Py–GC/MS. J. Anal. Appl. Pyrolysis 102, 16–23.
Guizani, C., Escudero Sanz, F.J., Salvador, S., 2013. The gasification reactivity of high-heating-rate chars in single and mixed atmospheres of H2O and CO2. Fuel 108,
812–823.
Haydary, J., Jelemenský, Ľ., Gašparovič, L., Markoš, J., 2012. Influence of particle size and kinetic parameters on tire pyrolysis. J. Anal. Appl. Pyrolysis 97, 73–79.
Johansson, R., Thunman, H., Leckner, B., 2007. Influence of intraparticle gradients in modeling of fixed bed combustion. Combust. Flame 149, 49–62.
Larfeldt, J., Leckner, B., Melaaen, M.C., 2000. Modelling and measurements of the pyrolysis of large wood particles. Fuel 79, 1637–1643.
Larsen, M.B., Schultz, L., Glarborg, P., Skaarup-Jensen, L., Dam-Johansen, K., Frandsen, F., Henriksen, U., 2006. Devolatilization characteristics of large particles of tyre rubber under combustion conditions. Fuel 85, 1335–1345.
Lautenberger, C., Fernandez-Pello, C., 2009. A model for the oxidative pyrolysis of wood. Combust. Flame 156, 1503–1513.
Lu, K.-M., Lee, W.-J., Chen, W.-H., Lin, T.-C., 2013. Thermogravimetric analysis and kinetics of co-pyrolysis of raw/torrefied wood and coal blends. Appl. Energy 105, 57–65.
Milhé, M., vandeSteene, L., Haube, M., Commandré, J.-M., Fassinou, W.-F., Flamant, G., 2013. Autothermal and allothermal pyrolysis in a continuous fixed bed reactor. J. Anal. Appl. Pyrolysis. 103, 102–111.
Park, W.C., Atreya, A., Baum, H.R., 2010. Experimental and theoretical investigation of heat and mass transfer processes during wood pyrolysis. Combust. Flame 157, 481–494.
Peters, B., Bruch, C., 2003. Drying and pyrolysis of wood particles: experiments and simulation. J. Anal. Appl. Pyrolysis 70, 233–250.
Ranzi, E., Cuoci, A., Faravelli, T., Frassoldati, A., Migliavacca, G., Pierucci, S., Sommariva, S., 2008. Chemical kinetics of biomass pyrolysis. Energy Fuels 22, 4292–4300.
Sadhukhan, A.K., Gupta, P., Saha, R.K., 2008. Modelling and experimental studies on pyrolysis of biomass particles. J. Anal. Appl. Pyrolysis 81, 183–192.
Shen, D.K., Gu, S., Luo, K.H., Bridgwater, A.V., Fang, M.X., 2009. Kinetic study on thermal decomposition of woods in oxidative environment. Fuel 88, 1024–1030.
Su, Y., Luo, Y., Wu, W., Zhang, Y., Zhao, S., 2012. Characteristics of pine wood oxidative pyrolysis: degradation behavior, carbon oxide production and heat properties. J. Anal. Appl. Pyrolysis 98, 137–143.
Takashi, K., Hidesaburo, N., 1992. Global kinetic constants for thermal oxidative degradation of a cellulosic paper. Combust. Flame 88, 345–368.
Teixeira, G., Van de steene, L., Ponthieux, A., Salvador, S., 2014. Prediction of the gasification kinetics of a single wood char particle from a limited set of parameters. Fuel 123, 194–204.
Van de steene, L., Tagutchou, J.P., Escudero Sanz, F.J., Salvador, S., 2011. Gasification of woodchip particles: experimental and numerical study of char–H2O, char–
CO2, and char–O2reactions. Chem. Eng. Sci. 66, 4499–4509.
Yang, H., Yan, R., Chen, H., Lee, D.H., Zheng, C., 2007. Characteristics of hemi-cellulose, cellulose and lignin pyrolysis. Fuel 86, 1781–1788.