WP 1130-80 May 1980
System Dynamics Group
Alfred P. Sloan School of Management Massachusetts Institute of Technology
The financial support of the Office of Analytical Services,
Policy and Evaluation, U.S. Department of Energy is gratefully acknowledged.
TABLE OF CONTENTS
I. The Importance of Energy-Economy Interactions 4
II. The Need for an Integrating Framework 7
II. 1 Common Assumptions of Energy Supply Models 7 II.2 Characteristics of Energy-Economy Models 11
III. Structure of the Model 18
IV. Simulation Results 25
IV. 1. Reference Run 27
IV.2 The Importance of Substitution 43
IV.3 The Importance of Delays 48
V. An Example of Energy Policy Analysis 54
VI. Conclusion 59
APPENDIX 61
THE EFFECT OF ENERGY DEPLETION ON ECONOMIC GROWTH
I. THE IMPORTANCE OF ENERGY-ECONOMY INTERACTIONS
The 1970s might well be called the decade of energy. In 1970, domestic production of oil peaked; natural gas production peaked in 1972.
Both oil and gas output stood lower at the end of the decade than at its start. During the '70s, OPEC rose to dominance in world energy markets, coal was again hailed as king but failed to ascend the throne, and nuclear power generated a critical mass of safety, envirornmental, and ethical opposition which has brought its development to a virtual standstill.
Depletion of energy resources has emerged as one of the major problems facing the world for the remainder of the century. At the same time, the economy of the United States has not fared well. The '70s saw economic growth falter from the 3.7% per year rate of the '50s and '60s to
2.7% per year. The nation experienced the deepest recession since the Great Depression, rising unemployment, and the most severe peacetime
inflation in U.S. history. While not all the nation's economic woes can be traced to energy, the impact of energy on the economic health of the nation is undeniable. The unemployment, factory shutdowns, and hardship caused by the OPEC embargo of 1973, natural gas shortages of 1976, coal strike of
1978, and gasoline shortages of 1979 all testify to the direct importance of energy in maintaining a modern industrial economy. But energy also
affects the economy in more subtle ways: energy prices have outpaced
sectors of the economy; financial markets strain to accomodate
petrodollars; and the dollar falls in value as OPEC prices rise, leading to still higher prices.
The health of the economy depends critically on energy. Economic policy can no longer be made without considering its impact on the energy crisis. Energy policy can no longer be made without regard to its economic repercussions. Yet there is little agreement on the nature, strength, and relative importance of the myriad interconnections between energy and the economy. A framework is needed to integrate in a consistent and realistic manner the long-term effects of energy depletion and rising energy costs on investment, economic growth, unemployment, the standard of living, and inflation.
This paper seeks to demonstrate the feasibility of such an integrating framework. The framework consists of a system dynamics model of the national economy (the ENECON model). The purpose, structure, and assumptions of the model will be described. The relevance of the approach for policy analysis will be demonstrated by evaluating the impact of energy depletion on economic activity, investment, and the standard of living. In particular, the following questions will be addressed:
o What is the relationship between GNP and energy use?
o Can depletion of energy resources cause or worsen an-economic downturn?
o How do lags in the substitution process affect economic performance?.
o Is shortage of capital (financial and physical) likely to constrain the expansion of energy supplies?
D-3216 7
II. THE NEED FOR AN INTEGRATING FRAMEWORK
Since 1973 many energy models have been constructed and numerous studies have been undertaken to address the energy crisis. In what way does the ENECON model differ from other energy models? Why is there a need for an integrating framework to examine interactions between energy and the economy?
II.1 Common Assumptions of Energy Supply Models:
Because the energy crisis was initially perceived as a supply problem, early energy models focused primarily on supply and treated the energy sector in isolation from the rest of the economy.* Table 1 presents several common assumptions of energy supply models. While these
assumptions simplify analysis of future energy supplies and prices, they are quite unrealistic:
GNP Growth is Exogenous:
Imagine the effect on GNP of a full embargo of all imported oil (50% of consumption). Massive unemployment, shutdown of factories, widespread bankruptcy, and political turmoil would follow, whether the price system or rationing were used to clear the energy market. It is the fear of just such an embargo that led to the creation of the Strategic
Petroleum Reserve. Yet in energy supply models GNP would be unaffected.
TABLE 1
COMMON
ASSUMPTIONS OF ENERGY SUPPLY
MODELS
GNP GROWTH IS
EXOGENOUS
CAPITAL COSTS OF NEW TECHNOLOGIES ARE EXOGENOUS
INVESTMENT IN
OTHER SECTORS
ENERGY UNCONSTRAINED BY
INVESTMENT
NEEDS OF
OF THE ECONOMY
INTEREST RATES ARE EXOGENOUS
INFLATION IS UNAFFECTED BY ENERGY PRICES AND AVAILABILITY
WORLD OIL PRICES ARE UNAFFECTED BY DOMESTIC IMPORT
REQUIREMENTS OR ENERGY POLICIES
Representative models include: PIES, FOSSIL1 and FOSSIL2, DFI, Livermore Energy Policy Model, Baughman-Joskow, and Bechtel Energy Supply Planning Model.
D-3216 9
Capital Costs of New Technologies are Exogenous:
The capital costs of technologies such as coal liquefaction and gasification, shale oil, and nuclear power have risen over the past decade in real terms, often (as in the case of shale oil) faster than the price of oil itself! Such behavior is not surprising since these technologies are extremely energy- and capital-intensive. When energy costs rise, the costs of producing steel and concrete rise as do the costs of fuel and
feedstocks. Yet these interdependencies are ignored by the supply models.
Investment in Energy Unconstrained by Investment Needs of Other Sectors of the Economy:
As the economy grows, the "pie" of national output to be divided among consumption, investment and government spending grows. But because the pie, though growing, is limited, the increasing capital requirements of the energy sector can only be satisfied at the expense of investment in some other sector or at the expense of consumption. The assumption that GNP is unaffected by the energy sector implies investment in non-energy sectors and consumption can be maintained in the face of rising energy sector needs, and therefore that the energy sector cannot increase its share of the pie. No capital constraints exist in the supply models: energy industries do not compete for investment against the rest of the economy. Thus the supply models let the economy have its "pie" and eat it too.
Interest Rates are Exogenous:
Growing investment requirements of the energy sector put upward pressure on interest rates. As interest rates rise, investments earning only marginal returns will become unprofitable and will be crowded out,
reducing capital investment in other sectors. Energy projects on the edge of profitability may become unprofitable, requiring government subsidies for completion.
Inflation is Unaffected by Energy Prices and Availability: In the supply models inflation is exogenous. Yet energy prices rose faster than the consumer price index during the '70s, adding to
inflationary pressure. As the price of energy rises, the cost of producing every good and service in the economy rises (including the costs of
energy production). Higher costs are passed into prices, possibly
triggering a wage-price spiral, reducing the standard of living, and adding to the demand for credit and to government deficits; each of these adds to inflationary pressure. Energy projects with long lead times are
particularly vulnerable to inflation. Regulated industries such as
electric utilities are also vulnerable because allowed rates of return are based on historical costs, not replacement costs.
World Oil Prices are Unaffected by Domestic Import Requirements or Energy Policies:
Large oil imports worsen the balance of payments and weaken the dollar; as the dollar drops in value OPEC raises the price of oil to compensate for the loss in purchasing power, creating a vicious circle of
D-3216 11
escalating price hikes and devaluation. If import requirements were reduced, the vicious circle would be weakened and OPEC's grip on the world oil market would loosen. Indeed, one major benefit of reduced imports may be a softening in OPEC prices (DOE, 1979). But the coupling between OPEC and the domestic energy system is only one-way in the supply models.
Summary:
The assumptions commonly made in energy supply models are not only contradicted by recent trends but ignore potentially important
interdependencies among energy costs, capital formation, growth, and
inflation. The results of these models are therefore called into question, and their utility for energy policy-making compromised.
II.2 Characteristics of Energy-Economy Models:
In the past few years, a variety of models have been constructed to address the deficiencies noted in the supply-oriented models.* These "energy-economy" models are primarily designed to assess the impact of energy availability and price on economic growth. The models employ a wide range of techniques, from linear programming to econometrics to
input/output analysis. However, the models fail to capture important energy-economy interactions in a manner that recognizes the imperfect nature of energy markets and the complex dynamics underlying macroeconomic change. Table 2 lists some of the properties of the major energy-economy models. These properties are discussed below.
* For a comprehensive summary of research into Energy-Economy interactions to 1979, see DOE/EIA (1979).
Table 2
CHARACTERISTICS OF ENERGY-ECONOMY MODELS
EQUILIBRILU
ORIENTATION
[1] [3] [4] [7]NO REBALANCING OF FACTORS OR FINAL DEMAND
[1] [3] [5] [7]
IMPACT OF THE ECONOMY ON THE ENERGY SECTOR IGNORED
[1] [5]
PHYSICAL AND FINANCIAL FLOWS NOT CONSERVED
PRODUCTION INDEPENDENT OF ENERGY
[5] [6]
[5]
[3] [5] [6] [7]
WORKFORCE PARTICIPATION IS EXOGENOUS
[1]
[2]
[3]
[4][5]
[6]
[7] [1] [2] [4] [5] [6] [7]Elephant-Rabbit, Hogan and Manne (1977) ETA-MACRO, Manne (1977)
PILOT, Parikh (1976)
Hudson-Jorgenson LITM, Hudson and Jorgenson (1978) DRI, Hull (1979) and Forrester and Mass (1979) Wharton Annual Energy Model, WEFA (1978)
Reister-Edmonds Two Sector Model, Reister and Edmonds (1977)
D-3216 13
Equilibrium Orientation:
Energy markets have been heavily regulated for decades,
introducing market imperfections by distorting and biasing the information that normally would cause consumers and firms to respond to the growing scarcity of energy. Thus, the assumption in many models of a market-determined equilibrium is not defensible.
Yet even without government-imposed imperfections, the energy system does not conform to the usual assumptions of equilibrium economics. The energy system is characterized by extremely long delays. It takes upwards of 15 years to build a nuclear power plant, 5 to 8 years to build coal and shale plants, 3 to 5 years to develop offshore oil and gas.
Automobiles last 5 to 10 years. Houses, factories, and offices last 20 to 50 years or more. Modern settlement patterns, transportation networks, agricultural and industrial techniques, and lifestyles evolved over even longer periods and will respond only slowly to changes in energy prices and availability. On the government side, the record of the past few years demonstrates the existence of substantial delays in developing and
implementing energy policies.
Thus, it will take decades for the economy to fully reconcile itself to the end of the era of cheap energy. In the interim period, while adjustments to the new order are incomplete, the impact of high energy prices may be more severe than in the long run. Models (including
Elephant-Rabbit, PILOT, Hudson-Jorgenson, and Reister-Edmonds) that only yield an equilibrium snapshot of the economy at some future date are quite
limited in their ability to realistically assess the consequences of
delays, capital turnover, and long lead times. The question "where are we going?" is crucial, but equally so are the questions "can we get there from here?" and "how long will it take?"
No Rebalancing of Factors or Final Demand
As the price of energy rises relative to prices of other factors of production and other goods, use of the less expensive inputs will increase and energy use will be reduced. Firms will substitute labor and energy-efficient capital for energy-intensive capital. Consumers will favor products with less energy content over more expensive energy-rich items. These rebalancing effects may have significant impacts on
unemployment, wages, relative prices, the mix of goods and services produced, and lifestyles. Models that ignore these effects exclude a potentially powerful set of forces which may mitigate the effect of higher energy prices.
Impact of the Economy on the Energy Sector Ignored:
Several of the models (such as the Elephant-Rabbit model) treat capital and investment in energy production exogenously or have exogenous energy prices. Yet capital production (primary metals, construction, shipbuilding, etc.) is an energy-intensive sector of the economy and thus highly dependent on the price and availability of energy. Further, the ability of the economy to generate enough capital to satisfy the growing needs of the energy sector is a key question. By treating capital
exogenously, these models assume away an important economic dimension of the energy problem.
D-3216 15
Physical and Financial Flows not Conserved:
It is extremely important to conserve both physical factors (capital, labor, energy) and financial flows (wage payments, profits, taxes) so the full effects of depletion and energy policies are captured. For example, a government subsidy for production of synthetic fuels must either raise tax rates, reduce government transfers or expenditures, or increase the deficit; each of these will have a detrimental impact on the economy, possibly offsetting the beneficial impact of the subsidy. The
DRI and Wharton models ignore the budgetary implications of energy policies.
Production Independent of Energy:
In several models, especially econometric models such a the DRI model, energy is not required for the production of goods. In such a model a reduction in energy input has no direct effect on output. But as
mentioned above, a full embargo of imported oil would result in widespread disruptions and a large reduction in output. Models that ignore the
physical dependence of production on energy cannot be used to evaluate the impact of energy on economic performance.
Lack of Robustness
Many energy-economy models are not robust in the sense that they behave implausibly under extreme conditions. For examnple, in a recent application of the DRI model (Hull 1979), the long-run elasticity of oil demand (based on historical data), was 0.2. Thus, to reduce oil
barrel. Yet at that price, the annual oil bill would be $2.3 trillion, a sum larger than GNP in 1979.* A model must behave plausibly outside the range of historical experience if it is to be useful for policy analysis since changing conditions and policies may result in previously unobserved behavior. A model that only makes sense in historical ranges of behavior can only be used to analyze historical policies.
Workforce Participation is Exogenous:
Labor is a major determinant of GNP. To treat labor input exogen-ously implies GNP is largely determined without regard to the effects of
energy prices and availability on wages, incomes, unemployment, and life-style changes which may affect the decision to participate in the work-force. The energy crisis could foster new low-consumption lifestyles in which people spend more time working for themselves and less in the workforce. Models with exogenous labor force participation include the Elephant-Rabbit, ETA-MACRO, Hudson-Jorgensen, DRI, and Reister-Edmonds.
* Assuming current oil consumption of approximately 16 MMBD at an average price of $25 per barrel. GNP in 1979 was approximately $2.1 trillion.
D-3216 17
Summary:
The models currently available are inadequate representations of the complex interdependencies between energy and the economy. To assess the importance of these interactions properly, a model should capture the feedbacks between the energy sector and the rest of the economy. It should generate and allocate the productive resources of the economy endogenously and represent the shifting balance between these resources. Important delays and disequilibrium effects should be included. Physical and financial flows must be conserved. It should not rely on exogenous time series to generate its behavior. Finally, the model should be robust under extreme conditions. Such a model can then begin to shed light on the
magnitude of the problem, the severity of potential tradeoffs, and the efficacy of policy initiatives.
III. STRUCTURE OF THE MODEL
A system dynamics model (the ENECON model) has been constructed for the analysis. Based on the System Dynamics National Model, the model is designed to capture the decision-making structure of the economy.* The model represents a first framework for the analysis of energy-economy
interactions and will undergo further development. The simulations
presented here are intended to illustrate the use of the model and to point out important areas for future model development. An overview of the model structure appears in Figure 1. There are five basic sectors: production, household, financial, government, and OPEC.
The production sector actually consists of three individual production sectors: one each to produce energy, capital plant and equipment, and consumer goods and services. A sector represents many
firms, each producing similar types of output. Each production sector has the same basic or generic structure which constitutes a theory of the firm.
Investment and capacity acquisition, hiring and firing policy, pricing, production scheduling, and financial management are all represented
explicitly. Though the three producing sectors share a common structure, each sector is calibrated to represent a particular type of output (such as consumer goods or energy). For example, the initial ratio of capital to labor, energy intensity of production, and debt-equity ratio of the sectors differ to capture their differing production technologies and financial characteristics.
* For a description of the system dynamics methodology, see Forrester (1961); for a description of the National Model see Forrester, Mass, and Ryan (1976).
D-3216 19
Each production sector employs three factors of production--labor, capital, and energy. These inputs are combined through a production
function to yield the output of the sector. Similarly, the household sector uses four factors to generate "utility" or well-being: labor, capital (representing housing), consumer goods and services, and energy
(which is necessary to utilize household capital and goods). The three production sectors and the household interact through orders for output,
shipments, and payments, all of which are represented separately. Figure 2 shows the physical flows of energy, capital, and consumer goods that
connect the production and household sectors.
The energy sector differs from the other sectors in two important respects. First, energy production depends on non-renewable resources. As the easily exploited resources are consumed, the productivity of the
energy sector declines. Second, if the energy sector is unable to meet the total demand for energy, it will attempt to import the difference from the OPEC sector.
The OPEC sector uses its revenues to purchase current output of the domestic economy and to invest in the productive assets of the economy, that is, to purchase claims to future output.
At this stage, the energy sector produces a single type of energy. There is no distinction between different fuel types. Interfuel substitu-tion, therefore, is not treated.
D-3216 2121
Figure 2
The financial sector is the source of external financing for production sectors and the household, and is the repository for savings. The financial sector allocates available funds for investment among competing demands for credit, sets interest rates, and balances the aggregate portfolio of the economy as the relative profitability of the
production sectors changes. For example, if return on investment is higher than average in a sector, the sector will be able to attract funds for investment at the expense of other sectors. The financial sector also includes the Federal Reserve and can influence the money supply through open market operations.
The government sector sets tax rates, makes transfer payments, and determines fiscal and monetary policy. Energy policies are also the
province of the government sector.
Table 3 summarizes the major variables in the model, dividing them into those endogenous to the model, those exogenous, and those that are outside the scope of the study. The last category is of particular
interest. Energy depletion and the subsequent adjustment of the economy is a process requiring decades. By comparison, adjustments in inventories of consumer goods and energy are short-term phenomena and can thus be ignored without compromising the conclusions of the study. As a result, the model does not deal with short-term business cycle behavior.* International trade, except energy imports from OPEC, is excluded for simplicity. While
* Mass (1975) presents a theory of business cycles based on interactions. between inventory management and employment policies.
D-3216 23
Table 3
SUMMARY OF MAJOR VARIABLES
ENDOGENOUS
GNP
CONSUMPTION
INVESTMENT
SAVINGS
STANDARD OF LIVING
PRICES (NOMINAL AND REAL)
CONSUMER PRICE INDEX
WAGES (NOMINAL AND REAL)
LABOR FORCE PARTICIPATION
EMPLOYMENT
UNEMPLOYMENT
INTEREST RATES
MONEY SUPPLY
DEBT (PRIVATE AND GOVERNMENT)
TAX RATES
ENERGY PRODUCTION
ENERGY DEMAND
ENERGY IMPORTS
ENERGY RESOURCES
EXOGENOUS
POPULATION
OPEC PRODUCTION
REAL OPEC PRICE
D(CLUDE
INVENTORIES
ENVIRONMENTAL
CONSTRAI NTS,
COSTS
NON-ENERGY
RESOURCES'
INTERNATIONAL
TRADE (EXCEPT
WITH OPEC)
DISTRIBUTIONAL
EQUITY
TECHNOLOGICAL
PROGRESS
the exchange rate, international capital flows, and terms of trade affect the economy, they are not of primary importance in assessing the impact of energy on the economy. The nature of environmental constraints (such as clean air standards) and possible scarcity of non-energy resources (such as water for synfuel development) are quite important but, again, for
simplicity have been excluded from the study. Finally, the effect of rising energy prices on distributional equity is an issue with important political consequences; though it deserves study, it is beyond the scope of the research presented here.
The appendix describes the nature and determinants of equilibrium in the model and reviews initial conditions.
D-3216 25
IV. SIMULATION RESULTS
The ultimate goal of developing the framework described above is policy analysis: the model will be used to evaluate the efficacy and
potential side effects of various energy policies. A necessary prelude to policy analysis, however, is the identification and exploration of the channels through which energy influences the economic health of the nation.
The strength of the various relationships must be estimated, and potential tradeoffs evaluated.
Several simplifying assumptions have been introduced to aid the investigation. First, the model is initialized to represent an economy in a stationary equilibrium. Population growth and technological progress have been excluded. Second, since the focus is on investment, output, and the standard of living--all real quantities--the money supply is kept
constant, preventing long-run inflation. Third, the tax rate (personal and corporate) is held constant, and the government is assumed to balance its budget. Fourth, OPEC is assumed always to satisfy the demand for energy
imports (embargoes and supply interruptions are excluded). OPEC is assumed to recirculate its revenues by purchasing consumer goods from the domestic economy. Finally, the real costs of energy production are assumed to
increase smoothly but at an increasing rate as depletion occurs until the price of a backstop technology is reached.* In the model, the backstop technology is available in unlimited quantities and without any extra
* Depletion paths and the concept of a backstop technology are discussed in Nordhaus (1973) and Solow (1974).
development or construction delays. Such an assunption will underestimate the effects of depletion on the economy, especially in the short run.
A caveat must be entered here. The real world does involve a growing economy, inflation, government deficits, supply interruptions, and development delays. But the purpose is not to reproduce the actual history of the economy or predict its future, but to understand how energy
depletion affects the performance of the economy. By setting up a model of the economy incorporating these assumptions, controlled experiments can be performed which reveal the impact of depletion alone. As understanding improves, simplifying assumptions can be relaxed.
In the simulations no attempt has been made to reproduce the year-by-year performance of the economy. While the initial conditions, parameters, and configuration of the model correspond to those of the
United States during the post-war period, the nunerical values shown in the simulation should not be interpreted as predictions or forecasts. Rather, the initial equilibrium should be used as a point of comparison for
evaluating the simulation results. Subsequent tests should be contrasted against the reference run discussed below. It is the relative magnitude of the effects, the overall behavior mode of the economy that is important. The uncertainty and confusion over the effect of depletion on economic performance is so great that great precision is unwarranted.
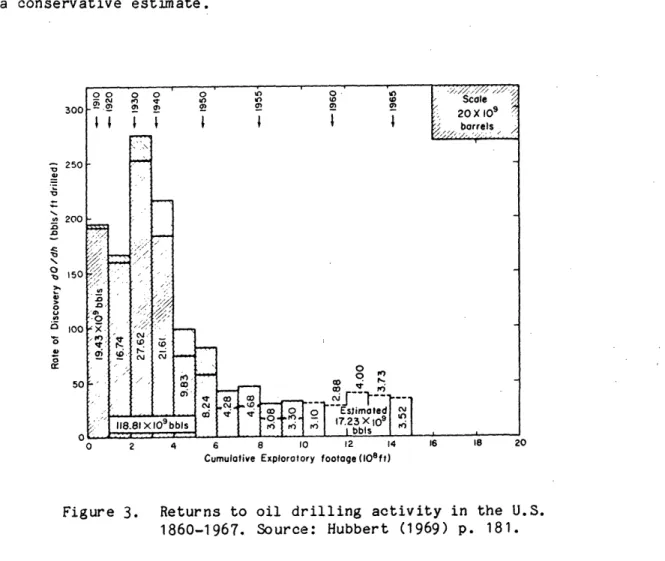
In the first simulation the resource base is assumed equivalent to about 50 years of consumption at the original usage rate. As depletion proceeds, the productivity of the energy sector declines, reaching a final level only one-quarter as great as the original. Thus, the backstop tech-nology is assumed to be four times more expensive in real terms than the original cost of the non-renewable resource. Figure 3 shows the returns to oil drilling activity in the U.S. The return, in barrels per foot drilled, declined by more than a factor of four up to the late 1960s, indicating the factor of 4 increase in costs due to depletion assumed in the simulations is a conservative estimate. 2 -0N, 0 "OZ!, 0 0 11 0 2 0 Cr 0 2 4 6 8 10 Iz 14 10 io ,u
Cumulative Exploratory footage (108ft)
Figure 3. Returns to oil drilling activity in the U.S. 1860-1967. Source: Hubbert (1969) p. 181.
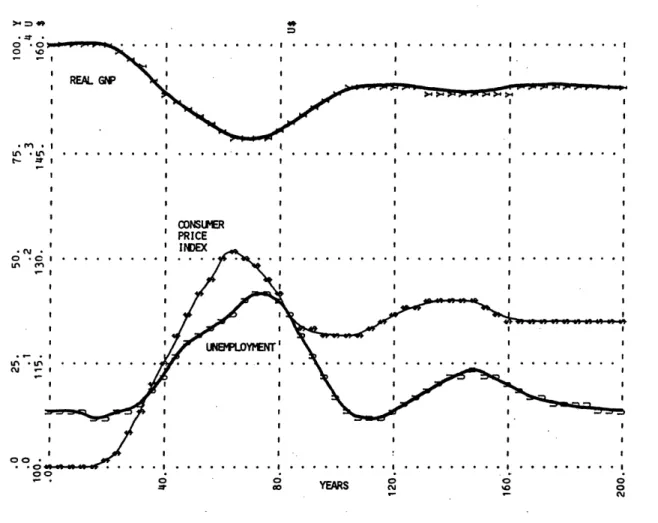
The simulation results are presented in Figure 4. Depletion becomes significant in the 20th year; conversion to the backstop occurs shortly before the 80th year. Real gross national product declines to nearly three-quarters of its initial value and then recovers somewhat, reaching equilibrium after 120 years at only 90% of the initial level. The consumer price index (CPI) rises steeply in the period of depletion to 130% of its initial level, then declines from the peak to equilibrium at 120%.
I . ,f I I r I I I ' II RE· f'e I I I I I I PRICE ,Iuraw I I I I U., U.,'N 9 a CARS s a
Figure 4. The Reference Run: Real GNP and the Consumer Price Index as a percent of their initial values; unemployment
D-3216 29
Unemployment declines initially but then rises to a peak of more than 15%; in equilibrium unemployment has returned to the initial 5% rate.
Two aspects of the behavior are notable. First, real GNP is reduced in equilibrium, indicating a reduction in the material standard of
living. Second, the adjustment to equilibrium required more than half a century once the backstop was reached. The impact of depletion on GNP, unemployment, and the price level is much more severe during the adjustment
period than in the final equilibrium.
The essence of depletion is an increase in the effort required to find, develop, and produce each additional barrel of oil or cubic foot of gas. The real costs of energy production rise, or equivalently, the productivity of the energy sector declines. Since the economy has only limited productive resources at its command, (ultimately a reflection of a limited supply of labor), a decline in energy sector productivity
necessarily implies a decline in the productivity of the economy as a whole. The nation becomes poorer.
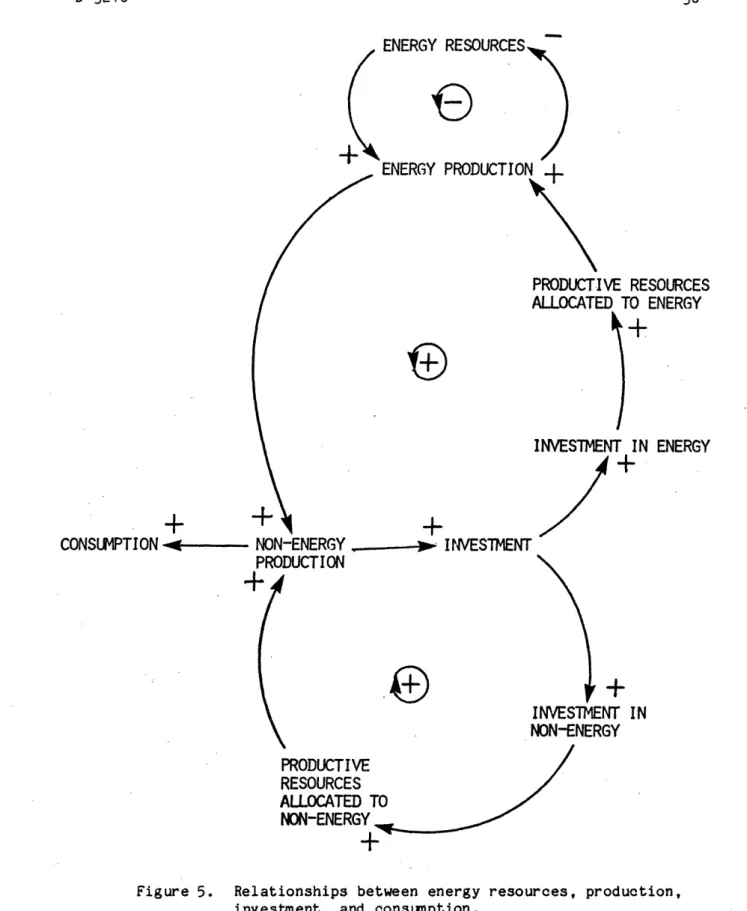
Figure 5 illustrates the basic relationships between energy resources, production, investment, and consumption that produce the
behavior in Figure 4. Non-energy production, or GNP, depends on inputs of energy as well as capital and labor. Given the initial capital stock, labor force, and energy consumption in the energy sector, energy production
ENERGY RESOURCES
rkIrn )nratEa f
tNtKi(Y rKI-JUA I UN
+
N
CONSIHPTION
*I
NON-ENERGY
.
I NVESTMENT
PRODUCTION
O
r
+
PRODUCTIVE RESOURCES
ALLOCATED TO ENERGY
i+
INVESTMENT IN ENERGY
j/+
+
INVESTMENT IN
NON-ENERGY
ffPRODUCTIVE
RESOURCES
ALLOCATED TO
NON-ENERGY
t
Figure 5. Relationships between energy resources, production, investment, and consumption.
N.B. The causal loop diagrams presented here are
energy production will tend to fall. If investment patterns do not change and productive resources are not reallocated to energy production, GNP and consumption will fall as energy production declines. Energy imports do not provide a way out of the dilemma. If imports are used to make up the
difference between production and demand, the standard of living must still decline as current output or claims to future output are transferred to
OPEC in payment for oil.
If, on the other hand, capital and labor are diverted into the energy sector to offset the effect of depletion, GNP and consumption will decline as these resources are drained from the other sectors of the economy. In terms of Figure 5, investment in energy will increase at the expense of investment in the non-energy sectors essential for growth.
Thus, depletion inevitably reduces the material standard of living below what it would otherwise have been, regardless of how the resources of the economy are allocated. The question becomes not "does energy affect economic growth?", but "how strong is the effect?"
Other analysts, especially (Hogan 1978), (Hogan and Manne 1977), and (Manne 1978) have argued the severity of the impact depends strongly on the relative importance of energy as an input to production. Since energy historically accounted for only 5% of the costs of production throughout the economy, an increase in the energy sector's factor requirements should have a small effect on the economy. Hogan and Manne liken the energy
sector to a rabbit in an "elephant and rabbit stew": just as adding another rabbit to the stew will still leave elephant as the dominant flavor, so an increase in the energy sector's share of the productive resources of the economy should have a small effect on overall economic performance. Hogan and Manne go on to argue that given the relative size of the energy sector, the magnitude of the impact of depletion depends
strongly on the ability of firms and consumers to substitute labor and energy-efficient capital for energy. If other inputs can easily be
substituted for energy then the impact should be negligible. At the other extreme, if no substitution is possible, that is, if energy and output move in lockstep, the impact will be severe. In terms of Figure 5, the relative size of the energy sector and the potential for substitution determine the necessary degree of reallocation of resources between energy and non-energy production. The severity of the tradeoff increases as the ability to substitute declines.
In the reference run (Figure 4), the long-run elasticity of substitution between energy and other inputs was assumed to be unity. If energy accounts for roughly 5% of the costs of production throughout the economy, (a value consistent with pre-1973 experience), then an elasticity of one implies a 1% reduction in energy use can be offset with only a .06% increase in capital and labor, leaving output unchanged. Economnetric
studies have generated widely divergent estimates of the elasticity. Hogan and Fromholzer (1977) and Hogan and Weyant (1978) report several attempts to estimate the elasticity; Berndt and Wood (1977) review principal estimation efforts through 1977. Berndt and Wood (1979) sumnarize the
D-3216
33
controversy by noting that the estimates supporting substitutability (an elasticity near unity) generally derive from cross-sectional data or engineering process analysis, while estimates supporting complementarity (an elasticity near zero) generally derive from aggregate time-series data. The reference run employs an elasticity of unity, representing the high end of the range; a later simulation (Section IV.2) eliminates substitution of capital and labor for energy to test the sensitivity of the results to uncertainty in the value of the elasticity.
* oco o LA '0 LA Cm = U11 EnM N I I 0 . . .. . .. . . . . . O I I I I YEARS o 0a liu yV
Figure 6. Reference Run: Real Energy Price (ratio to initial value) and Energy/GNP ratio (percent of initial value).
. I I I I I I I I . . . .
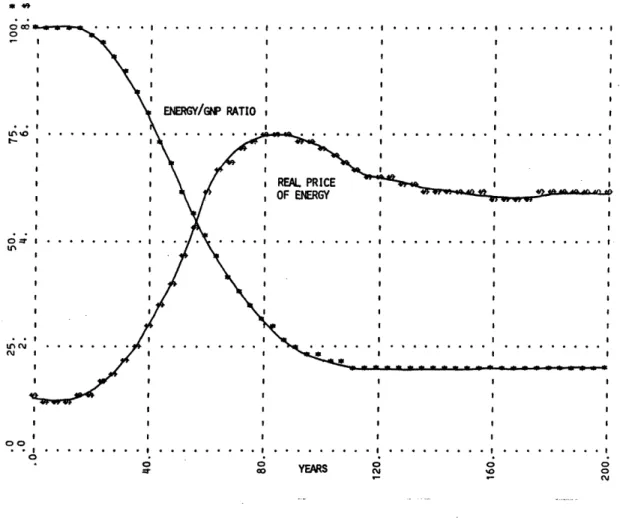
Figure 6 shows the real energy price and energy/GNP ratio from the base run. The real price of energy rises as depletion occurs, reaching a maximum 6 times its initial level before dropping back to an equilibrium
almost five times greater. Note that the real price of energy rose by a factor of five while the productivity of the energy sector declined by only a factor of four. The extra increase in energy price is due to indirect factor requirements of the energy sector: as real energy prices rise, real capital costs also increase, raising the costs of energy production still further (see below).
As the price of energy rises, substitution efforts reduce the energy intensity of the economy, and the ratio of energy use to GNP begins to drop. In equilibrium, the ratio stands at one-fifth of its initial value, reflecting the unit elasticity of substitution.
According to the Elephant-Rabbit model (Hogan and Manne 1977), an elasticity of unity implies higher energy costs have virtually no impact on GNP. Yet the simulation results show a 10% decline in real activity
resulting from a four-fold decline in energy sector productivity. The explanation for the difference in conclusions lies in the differences between the structure of the two models. In the Elephant-Rabbit model, capital and labor are exogenous. Labor, capital, and energy are not required to produce capital, and energy is not needed to produce energy. Further, because capital is exogenous, investors are assumed to supply capital services for production regardless of the rate of return earned on that capital.
D-3216 35
In the ENECON model, each sector uses labor, capital, and energy as factors of production. The capital sector needs capital; the energy sector needs energy. Plant and equipment are required to produce equipment and erect buildings; energy is used to mine coal, drill for oil, and
especially to convert primary fuels such as oil to electricity. Investors are assumed to require a target rate of return on their investment and will raise prices to cover that target return and their operating costs.
In the reference run, the elasticity of substitution in each sector is one. If capital and labor were exogenous, as in the
Elephant-Rabbit model, the magnitude of the GNP reduction would also be small. But capital is not exogenous. The desired capital stock in each sector depends on the cost of capital plant and equipment relative to the costs of labor and energy. Because energy is required to produce capital, the cost of plant and equipment rises relative to labor. Unlike the Elephant-Rabbit model, capital prices rise to cover the higher energy costs and to insure the target rate of return for investors. As a result, the goods, capital, energy, and household sectors become relatively less capital intensive and more labor intensive. Since the labor supply is fixed, the increase in labor intensity results from a reduction in output beyond the reduction induced directly by higher energy costs.
In addition, three mutually reinforcing relationships worsen the impact still further (Figure 7). First, the energy sector requires energy to produce. With energy five times more expensive, the energy sector cuts back on its energy use and attempts to substitute even more capital and
ENERGY REQUIREMENTS
OF ENERGY SECTOR
+
+
ENERGY REQUIREMEN
OF CAPITAL SECT(
+
ITS
)R
+
CAPITAL REQUI-REMENTS
OF ENERGY SECTOR
FOR CAPITAL
TwIT\
CAPITAL REQUIREMENTS
OF CAPITAL SECTOR
Indirect effects of increasing energy sector capital requirements.
Figure 7.
D-3216 37
labor. Thus, the labor intensity of the energy sector is increased directly while the increase in capital intensity indirectly raises the labor requirements of the energy sector by requiring the capital sector to expand and use more labor. Again, since the labor supply is fixed,
equilibrium output.is reduced even further below the Elephant-Rabbit level.
Second, the capital sector uses capital as a factor of production, creating another reinforcing relationship. Higher energy costs raise
capital production costs and make capital even more expensive relative to labor. Thus, the capital sector becomes still more labor intensive, further reducing equilibrium output.
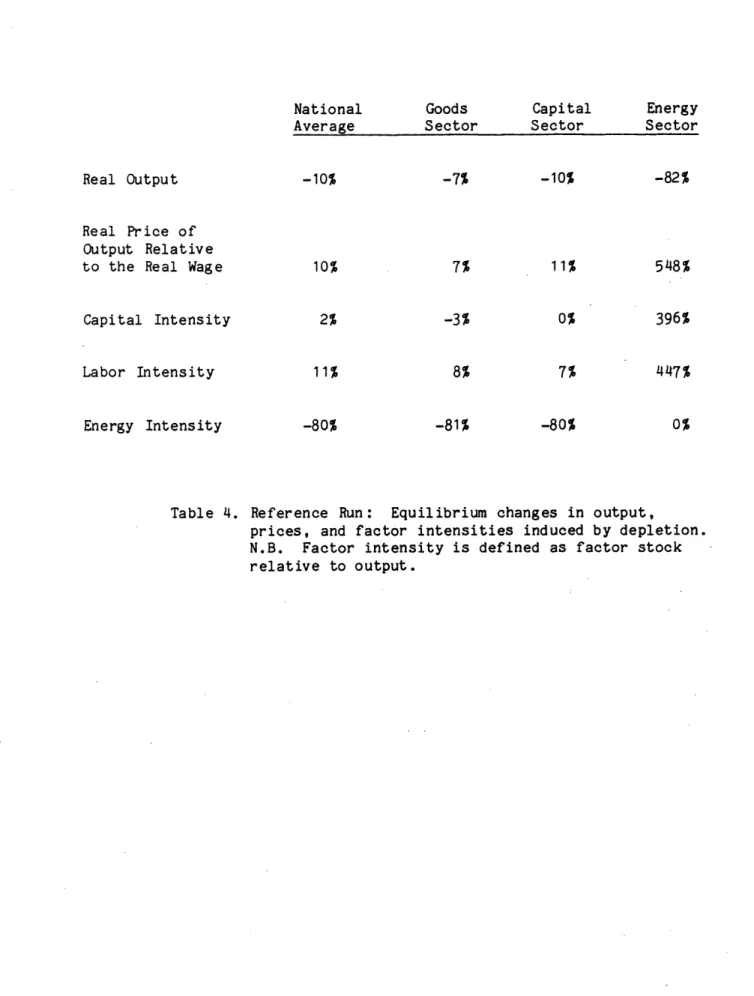
Finally, the energy sector requires capital to produce and the capital sector requires energy. As depletion increases the capital intensity of the energy sector, the indirect energy requirements of the energy sector also grow. Because energy becomes so much more expensive, capital becomes less attractive, further increasing the labor intensity of the energy and capital sectors and reducing equilibrium output. Table 4 shows the changes in output, real prices relative to the real wage, and factor intensities in each sector caused by depletion in the reference run. Capital intensity in the economy as a whole increases less than labor
intensity. Capital intensity remains unchanged in the capital sector and actually declines in the goods sector. In the energy sector, capital intensity increases only 88% as much as labor intensity.
Real Output
Real Price of Output Relative to the Real Wage
Capital Intensity
Labor Intensity
Energy Intensity
Table 4. Reference Run: Equilibrium changes in output,
prices, and factor intensities induced by depletion. N.B. Factor intensity is defined as factor stock relative to output. National Average Goods Sector -7% 7% -3% 8% -81% -10% 10% 2% 11% -80% Capital Sector -10% 11% 0% 7% -80% Energy Sector -82% 548% 396% 447% 0% . -
-D-3216 39
In summary, the differences in the equilibrium impact of depletion on GNP between the Elephant-Rabbit and ENECON models are due to two major factors. First, energy and capital production are exogenous to the
Elephant-Rabbit model; they are endogenous to the ENECON model. The stock of capital in each sector depends on the cost of capital and the target rate of return demanded by investors. Since capital production depends on energy in ENECON, the price of capital rises relative to labor as depletion raises energy prices. As a result, capital is reduced relative to labor, reducing equilibrium output. In the Elephant-Rabbit, capital is fixed regardless of the rate of return earned.
Second, the indirect factor requirements of capital and energy production are captured in the ENECON model. These reinforcing
relationships magnify the direct impacts of depletion but are not captured in the Elephant-Rabbit model
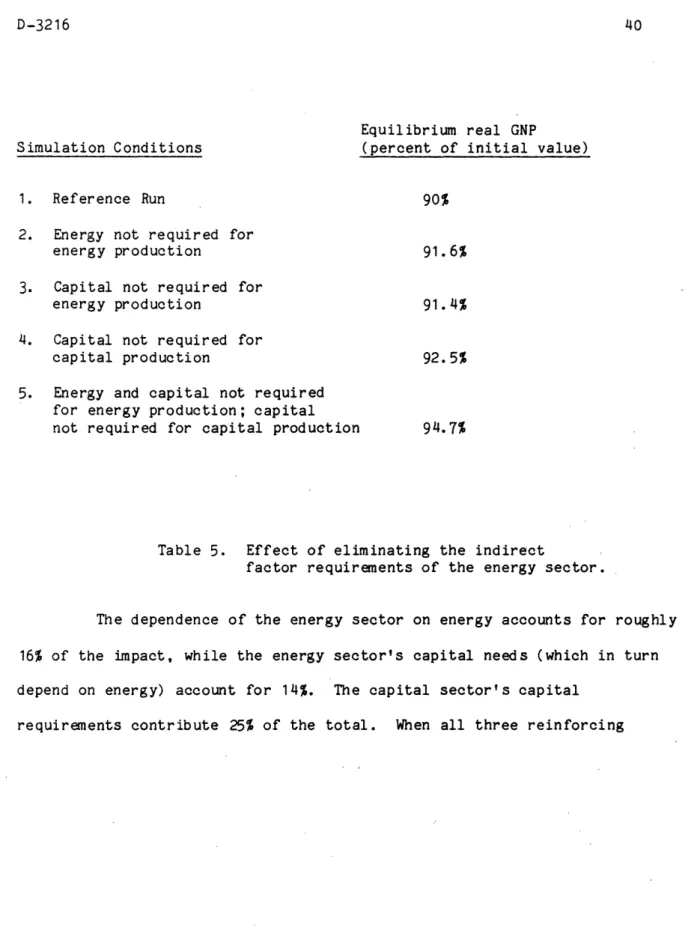
Sensitivity analysis was performed to verify the analysis above and gauge the contribution of the indirect energy and capital requirements to the reduction in GNP. Table 5 presents the equilibrium GNP from the reference run compared to the value from runs in which the three
Equilibrium real GNP
Simulation Conditions (percent of initial value)
1. Reference Run 90%
2. Energy not required for
energy production 91.6%
3. Capital not required for
energy production 91.4%
4. Capital not required for
capital production 92.5%
5. Energy and capital not required for energy production; capital
not required for capital production 94.7%
Table 5. Effect of eliminating the indirect
factor requirements of the energy sector.
The dependence of the energy sector on energy accounts for roughly 16% of the impact, while the energy sector's capital needs (which in turn depend on energy) account for 14%. The capital sector's capital
D-3216 41
relationships are eliminated, the impact of depletion is reduced by nearly 50%.* The remainder of the impact is due to the assumption that capital intensities adjust to yield the target rate of return for investors.
A second set of sensitivity tests were performed to determine the effect of the initial capital and labor intensities on the impact of
depletion. Table 6 demonstrates that the equilibrium reduction in real GNP caused by depletion is not sensitive to the value shares of capital and labor. Reducing the value share of capital in the goods, capital, and energy sectors by 66%, 50%, and 33% respectively, adds only two percentage points to the equilibrium GNP. Increasing the value share of capital has a correspondingly small effect.
* Due to interactions between the three reinforcing loops, the combined effect is less than the sum of the individual effects.
Value Share of Factors of Production Equilibrium Real GNP (Percent of initial value) 1. Reference Run: Capital Labor Goods Sector Capital Sector Energy Sector .30 .40 .60 .675 .565 .250
2. Reduced Capital Intensity: Capital Labor Goods Sector Capital Sector Energy Sector .10 .20 .40 .875 .765 .450
3. Increased Capital Intensity: Capital Labor Goods Sector Capital Sector Energy Sector .40 .50 .70 .575 .465 . 150 90% Energy .025 .035 .150 92% Energy .025 .035 .150 89% Energy .025 .035 .150
Table 6. Sensitivity of final GNP to capital and labor intensities.
D-3216
43
IV.2 The Importance of Substitution
To test the sensitivity of the results shown in Figures 4-7 to the substitution potential of the economy, the model was simulated under the assumption that no substitution of capital and labor for energy is
possible. In Figure 8, energy and output march in lockstep: if energy use declines 1%, output must decline 1%.
.I . . . .I . . . I I I I I I I I I I I I I I I. I I
~~~~~~~
-.?-I - I I~~ I-1 I I I I I I I I I I I . I . . . . I I I I I I I I I I I I . II III~~~~~~~~~~~~~ III~~~~~~~~~~~~~~ III~~~~~~~~~~~~~~ ,' _' __Figure 8. Fixed energy/GNP ratio: effect of eliminating substitution for energy.
14 . . I . . . . I I I I I 0 u -
~2
1u I? t t- -; '·1N' tn~?
U; - UC' REAL GP l . I . . . . . . . . . , I I I . . .. . . . . CDNSLM I~ PRICE IEXD I I I I I I I o o 0 & I · 6 c U >- D I . - . . . ... .. . I I I I~~
sl~~~lq~~ · · I~~ llQ YC~~~~~~~~~~~~~~~lr
~~~~~~~~~91~~~
I I I I I -4zo-Gross national product declines sharply to only 60% of its
original value before recovering, after a century, to 78% of the starting level. Consumer prices overshoot their final equilibrium, exceeding 160% of the initial price level for fifteen years. Unemployment also rises
dramatically to almost 25% before returning to normal values after the 120th year. Comparing Figures 4 and 8 reveals that the impact of depletion is sensitive to the potential for substitution. The difference is most severe during the adjustment period: in equilibrium, GNP with no
substitution for energy is only 12 percentage points less than in the reference run and unemployment is the same. In contrast, the depression created by depletion during the adjustment period reduces GNP by nearly 20 points more than the reference run, boosts unemployment from 15% to nearly 25%, and delays the recovery to equilibrium by nearly two decades.
Because substitution is not possible in the second simulation, the fraction of national income devoted to energy production rises very sharply as energy prices rise and a much greater fraction of total investment is diverted to energy industries. The inflexibility of energy demand forces the real price of energy up faster and higher than in the base run
45 IO · ·... I . ·.. . . ... ·I .I . . ... I I ! I I I I I I I I I I I I I I I I ; ' ,,,+ '' REALPRICE :~
~
~
' \ OF ENERGY'
' /
': _
I I I n I 'r -I ' /I t = I I I I . I I I XI : a I t1 AS t I I I o_ . I I I O O * - 0° YEARS Figure 9. .I I . . I I I I I I I I I I I Zt I I I I I Io I I I 10 . . . I I I I I I I . . . . I I 4} I 1 . . . .II o oI .. . . . ..~~~~~~~~~~~~~~~
... . . ..;~~~~~~~~~~~~~~~I
Fixed energy/GNP ratio: Real price of energy
(ratio to initial value).
able to expand, thus making capital still less available.* The capital shortage constrains the expansion of the energy sector, causing a much larger dependence on energy imports and subsequent loss of GNP as current output is used to pay for OPEC oil. As in the base run, the mutual
dependency of the capital and energy sectors, their need to bootstrap themselves and each other to higher levels of activity, triggers a set of vicious circles that delay the adjustment to depletion and worsen its
impact.
* The assumption of a fixed money supply may affect the magnitude of the capital shortage in the short run, but since the problem is ultimately a reduction in the real resources available for investment, the long-run results would not change significantly were the money supply allowed to expand. In that case, inflation would be added to the other problems
facing the economy. See Sterman (1980). D-3216
I
A related set of positive feedback loops worsens the problem by forcing the prices of energy and capital to overshoot their equilibrium level. Figure 10 shows how depletion can trigger vicious circles causing increases in the prices of energy and capital: As depletion raises the price of conventional sources, the energy costs of investments in new energy technologies rise, raising total energy prices further. Rising energy prices also raise the production costs and thus the price of capital plant and equipment, further increasing the costs of energy production.
And as the prices of capital plant and equipment increase, the costs of new investment in plant and equipment grow as well, adding a third vicious circle. These positive feedback loops will sustain price increases in energy and capital and help cause the real price of energy in the second simulation (Figure 10) to overshoot its equilibrium value by more than 30%. The price overshoot is more severe in the second run than the base for without substitution an important set of forces that acted to control the vicious circles is lost.
The strength of the feedback loops shown in Figure 10 depends on the energy and capital intensities of energy and capital industries. The more energy- and capital-intensive these industries are, the stronger the vicious circles. The dramatic rise in the real costs of technologies such
as coal liquefaction, shale oil, and nuclear power can be traced, in part, to their massive energy and capital requirements. Figure 10 suggests energy policies based on these technologies such as a government-sponsored synfuels program may be self-defeating. By triggering further price
D-3216
ENERGY RESOURCES
-ENERGY PRODUCTION
I
ENERGY t
PRICES "'
±it
+
PRODUCTIVITY OF
ENERGY SECTOR
I
COST OF ENERGY
PROn KIT ONCOST-
OF CAPITAL
PRICE OF CAPITAL
PLANT AND ---
PLANT AND
EQUIPMENT
+EQUIPMENT +
+
-CAPITAL REQUIREMENTS
OF ENERGY SECTOR
DEMAND FOR CAPITAL
PLANT AND EQUIPMENT
Figure 10. Depletion triggers vicious circles causing price increases in energy
47
f
-F
---
-..--- I
overruns, delays, and reduced profitability. Added government subsidies would be required to complete the program. In contrast, an energy policy based on conservation and renewable technologies with relatively low
capital and energy requirements would be less likely to trigger the vicious circles. By reducing the overall dependence of energy and capital
production on capital and conventional energy, the strength of the vicious circles will be reduced as well, thus helping to protect the economy from unexpected increases in energy costs.
IV.3 The Importance of Delays
The second notable aspect of the reference run was the long adjustment period required before equilibrium is re-established. During the adjustment period, GNP is reduced below its long-run equilibrium, consumer prices rise above their final value, and unemployment more than triples. Indeed, the transient consequences of depletion are much more
important than the equilibrium consequences.
Long delays cause the slow adjustment. There are very long delays in replacing the original capital plant with energy-efficient capital and adjusting production technologies to higher energy prices. In addition, as depletion proceeds, the demand for capital grows, but it takes time for the capital sector to expand sufficiently to satisfy the extra demand as well as supply the extra capital it needs for itself. Workforce participation adjusts slowly to changing wage and employment conditions, a reflection of the difficult lifestyle changes implicit in the decision to work for
D-3216 49
yourself (as a housewife or subsistence farmer, for example) or enter the workforce (as a factory or farm worker).
The delay in substituting new capital for old is one of the most important sources of the more severe intermediate-term impact. In the base run, two decades (the average life of capital) are required to replace old capital with energy-efficient capital. Thus, even though the price of energy reaches its equilibrium value by about the 60th year of the simula-tion, the energy/GNP ratio continues to decline for half a century before reaching equilibrium (Figure 6). Because of the long life of capital, energy demand is relatively inelastic in the short run, resulting in a transient increase in the fraction of national income devoted to energy production. Figure 11 shows that expenditures on energy as a fraction of GNP rise in the reference run from nearly 6% to a peak of more than 15% before settling back to the original level. The fraction of total
investment going to the energy sector more than doubles in the same period. Expenditures are sustained above normal for a period of 80 years as old capital is slowly replaced with energy-efficient plant, equipment, and housing. Thus, the delay in replacing existing capital directly
contributes to the length and severity of the adjustment period by reducing the discretionary income of households and firms.
· I I I I I I I I I I I I I .I I . . . .I . . . . I I I I I I I I I I I I EPENDITUES ON ENERGY AS A FRACTION OF GP I I I I I I I I I B I I I I I I I I I I I I I I I I I I I I BI~~~~~~~~~ I I B B I B I I B B I I 0 ' I * ' I - · · · " · -. . . * . · · I · · · · 0 __r 0 0 0 0 OD YEARS oao~~~~~~~~~~~~~~~~~~~~C I 0 g o g o g~~~~~~~~~~~~~~~~~~~~~n
Figure 11. Reference Run: Productive Resources of the economy are diverted into the energy sector due to delays in substitution.
The reduction in discretionary income worsens the intermediate-term impact in yet another way. As productive resources are diverted to the energy sector, the ability of the economy to purchase needed capital is depressed. Further, the ability of the capital sector to purchase the
capital it needs is reduced. Reduced investment and availability of
capital delays substitution of energy-efficient capital for old, sustaining energy consumption and worsening depletion. A vicious circle is started (Figure 12) in which high energy costs reduce the ability of firms and households to substitute away from energy, worsening depletion and pushing
'I I I I I Ir I I I I LA U11 I I I I I I I I I I I
D-3216 51
energy costs up still faster. By reducing the resources available to
invest in efficient capital, depletion undermines the very forces acting to control it, causing a further decline in well-being. The vicious circle
shown in Figure 12 stretches out the adjustment period and causes the price level, real price of energy, and unemployment to overshoot (and GNP to
undershoot) their long-run values.
-- INVESTMENT IN
RGY
DEMAN
ENERGY
E--NERGY DEMAND
+
+
ITOTAL ·
INVESTMENT-"+
---
--- REAL INCOME
Figure 12. Rising energy prices reduce real income and investment in energy efficient capital, delay substitution, and maintain energy demand, causing further price increases. r-r1-Tr1Trr ADfrnl
r-1-I- I , C1I I %, F I ML
rf-"wL "' T/"Ir"
Reducing the magnitude of the intermediate-term downturn and smoothing the transition becomes an extremely important area for energy policy. To determine the role of the delay in reducing the energy
intensity of production, the model was simulated under the assumption that energy intensity can be reduced twice as fast as in the base run, or in half the lifetime of capital. Such an assunption might reflect an
intensive conservation and retrofit program. The long-run elasticity of substitution is unity, as in the base run. Figure 13 compares GNP and unemployment in the two runs.
0 0 I I . ... . . . · .. . . .. . .· .. . . .. . .. . . . · .. . e ~ - s i BASE RUN I I I I ACCELERATED RETROFIT AM COINSERVATION I I I I *c'J 0 · · · ·. · · ·. ·.· ·..· .'. .· . 0.I.~~~~~~~~~~~~~~~~~~~~~~~~~~~~~~~~~~~~~~~~~~~~~~~~~~~~~~~~~~~~~~~~~~~~ I I , I I I I 1
~~
~I
I I O~ (U. c~ J I I I I II I I I I 00 ... . . I... .. 0o EA0 0 0 t ao EARS N Iv '0 y, 0Figure 13. Effect of reducing delays in improving energy efficiency on GNP (percent of initial value) and unemployment (percent of workforce).
intensity to energy prices significantly reduces the undershoot of GNP and overshoot of unemployment. More rapid conservation lowers the fraction of resources devoted to the energy sector in the short term, thereby reducing the strength of the vicious circles that drive output below its long run value.
V. AN EXAMPLE OF ENERGY POLICY ANALYSIS
Energy policy has been hampered by the inability of existing models to assess the macroeconomic impacts of policy initiatives. The macroeconomic effects of policies such as price controls, rationing,
subsidies for synthetic fuels, taxes, and import quotas are poorly understood. Many policies generate forces that oppose or undermine the intent of the policy. For example, government subsidies for production of synthetic fuels may increase the supply of oil, but in order to finance the program the government must either raise taxes, cut spending in other
areas, or increase the deficit. The first two choices benefit the energy sector at the expense of the rest of the economy; the last contributes to inflation, thereby reducing the real value of the subsidy and causing a need for even higher subsidies.
A tax on energy use with a fully compensating income tax reduction was chosen to demonstrate the ability of the ENECON model to evaluate
energy policies in the context of the economy as a whole.
A tax on energy use directly affects incentives for energy con-sumption and production; rebating the proceeds by reducing tax rates
creates incentives in other sectors of the economy to rebalance the mix of productive factors and the composition of final demand. Thus, such a tax provides a good test of the model's ability to capture important macro-economic and social feedbacks.
--(---D-3216 55
The tax proposal tested in the model consists of a fixed BTU surcharge on energy use matched by a reduction in both corporate and personal income tax rates sufficient to offset the revenues generated by the tax. Thus, government revenues are initially unchanged. The reduced income tax rates allow consumers to purchase the same market basket of goods as before the tax, though, of course, it is to their advantage to use less energy-intensive items. Similarly, firms will be able to achieve roughly the same after-tax return on investment despite higher unit costs.
If large enough, the tax would create strong incentives to reduce energy use and increase use of other factors, particularly labor.
Several simplifying assumptions have been made in representing the tax. First, it is imposed in one step, while a phased introduction would probably be required in reality. Second, income tax rates are held
constant at the new, lower level; as energy use (hence tax revenues) declines, government spending is assumed to drop correspondingly. Third, the tax is levied on all energy; in reality only oil and gas would be taxed, thus stimulating production of coal and renewable alternatives.
The initial conditions are the same as those used to produce the reference run. In the 40th year of the simulation, a BTU tax sufficient to
cut both personal and corporate income tax rates by 20% is imposed. The result, shown in Figure 14, is a transient reduction in GNP and increase in unemployment relative to the base case followed by a long-term adjustment
>- 5 .,. v-I ISE II BASERL I I I I .o, U (:3.. N% . . . . 0 c0 YEARS gN g 0
Figure 14. Effect on GNP and employment of an energy tax with compensating reduction in income taxes (GNP as a
percent of initial value; unemployment as a percent of the workforce.)
to an equilibrium GNP some 10% higher than the base. In equilibrium, real GNP is restored to its original level. The long-run effect of the tax is to increase real GNP (and consumption) by reducing energy demand,
increasing capital intensity, and increasing workforce participation. The
I I I I I I
D-3216 57
reduction in energy demand frees labor and capital from the least produc-tive sector for use in other sectors. Capital intensity increases
becausethe after-tax cost of capital services is reduced. Workforce participation increases because the after-tax wage has increased;
employment increases because labor becomes relatively less expensive than energy.
The cause of the transient reduction in GNP lies in the pricing policies of the production sectors. In the model, prices are determined by both unit costs and a traditional profit margin or markup on unit costs, along with supply and demand pressures. Even though reducing the corporate tax rate allows the same after-tax return on investment despite higher unit costs, it will take time for managers to become accustomed to the lower markup required to achieve the target after-tax return. Before the adjustment to a new markup level is made, prices are pushed above their long-run equilibrium level, reducing real income, aggregate demand, and employment.
The effect of traditional rules of thumb for markup on prices and GNP illustrates the importance of capturing managerial decision making in a model. By including a representation of the price setting process that does not rely on equilibrium assumptions, a potential source of managerial resistance to the policy initiative has been identified. The tax policy can then be improved by designing ways to overcome such institutional resistance.
The effect of the tax policy on GNP under the assumption of a speedy adjustment to the new markup levels is shown in Figure 15. Here
the long-run benefit is the same, but the transient decline in GNP below the reference run is eliminated and the transient increase in unemployment
is substantially reduced.
0c. o
r
.t, I I I I
' BASE RUN&
I I I I
: J[~riGY TAX WITH
REDUCTION IN
I r
~~~~~I
: INCOME TAXES AM)N*I~~~
~~~QUICK
MARKUP.· .. . u.'r. .. .. ' o ·· oI · · ··· ··· ·· · · ·· · ·· · ° DLUSWENT ° Lu !\ '
~~~I
I I I I-C1 . . . .. . . .~~~~. . . . I I oo I · · · · · · · · ·· I · * * * · ,, I I 00 0 g co YEARSFigure 15. Effect of energy tax with compensating income tax reduction and swift adjustment of profit margins.