HAL Id: tel-02293182
https://tel.archives-ouvertes.fr/tel-02293182
Submitted on 20 Sep 2019HAL is a multi-disciplinary open access
archive for the deposit and dissemination of sci-entific research documents, whether they are pub-lished or not. The documents may come from teaching and research institutions in France or abroad, or from public or private research centers.
L’archive ouverte pluridisciplinaire HAL, est destinée au dépôt et à la diffusion de documents scientifiques de niveau recherche, publiés ou non, émanant des établissements d’enseignement et de recherche français ou étrangers, des laboratoires publics ou privés.
Economic growth, unemployment and skills in South
Africa : An Analysis of different recycling schemes of
carbon tax revenue
Jules Schers
To cite this version:
Jules Schers. Economic growth, unemployment and skills in South Africa : An Analysis of different recycling schemes of carbon tax revenue. Economics and Finance. Université Paris Saclay (COmUE), 2018. English. �NNT : 2018SACLA039�. �tel-02293182�
Economic growth, unemployment
and skills in South Africa: An analysis
of different recycling schemes
of carbon tax revenue
Croissance, chômage et compétences en Afrique du Sud :
Analyse de plusieurs plans de recyclage
des revenus d’une taxe carbone
Thèse de doctorat de l'Université Paris-Saclay
préparée à AgroParisTech (l'Institut des sciences
et industries du vivant et de l’environnement)
École doctorale n°581: agriculture, alimentation, biologie,
environnement et santé (ABIES)
Spécialité de doctorat: Sciences économiques
Thèse présentée et soutenue à Nogent-sur-Marne, le 21 Décembre 2018, par
Jules Christian SCHERS
Composition du Jury :
Frédéric LANTZ
Professeur, IFP School Président, Rapporteur
Emilio Lèbre LA ROVERE
Professeur, Université de Rio de Janeiro (COPPE) Rapporteur Hyun Jin Julie YU
Research Officer, CEA-Saclay (I-Tésé) Examinateur Rob DAVIES
Research Fellow, TIPS South Africa Examinateur
Franck LECOCQ
ICPEF, AgroParisTech (UMR 8568 CIRED) Directeur de thèse Frédéric GHERSI
Chargé de recherche, CNRS (UMR 8568 CIRED) Coencadrant de thèse
NNT
:
2
0
1
8
S
A
CL
A
0
3
9
Université Paris-Saclay Espace Technologique / Immeuble Discovery
i
Economic growth, unemployment
and skills in South Africa:
Analysis of different recycling schemes
of carbon tax revenue
Croissance, chômage et compétences en Afrique du Sud :
Analyse de plusieurs plans de recyclage des revenus d’une taxe carbone
PhD thesis of Jules Christian SCHERS
ABIES doctoral school, AgroParisTech (Université Paris-Saclay)
Supervisors: Franck LECOCQ and Frédéric GHERSI
Centre International de Recherche sur l’Environnement et le
Développement –CIRED (UMR 8568 : CNRS, ENPC, CIRAD
AgroParisTech et EHESS)
ii
à Georgia, who supported my PhD all the way, ... en aan Max, whose smile put everything into perspective.
iii
Abstract
This PhD thesis gives a numerical illustration of how a carbon tax affects South African GDP, employment, CO2 emissions and socio-economic inequality. It uses a “hybrid” computable general equilibrium model of an open economy in a one-step projection from 2005 to 2035. It models second-best economies, notably skill-related rigidities in the labour market and in production of electricity. Seven scenarios for recycling of carbon tax revenue are analysed, plus an option to invest a part of tax revenue in improvement of skills of labour.
The analysis shows that under conventional assumptions about technological change, a carbon tax of around 100 ZAR2005 (18 USD2013) per tonne of CO2 will have little negative consequences for GDP and employment, when combined with the right type of tax revenue recycling: Labour subsidies and company profit tax reduction likely lead to the best macro-economic outcomes, though do not reduce inequality. Additional measures are needed to reduce “energy poverty”. To achieve South Africa’s NDC of the Paris Agreement, a carbon tax rate of around 300 ZAR2005 or 55 USD2013 per tonne of CO2 is necessary. However, this could have serious impacts on GDP growth. Also, without a change in the trend of increasing labour productivity, such lower GDP will lead to higher unemployment than in the reference case. An investment in skills of 7.5 billion ZAR2005 of annual Ctax revenue, with the objective of increasing access to high quality education and reducing the high skill labour shortage, is found to have a positive impact on GDP growth. However better calibration data is required.
The findings of this PhD thesis furthermore call for a thorough examination of what type of technological change could be expected for South Africa. Technological progress, consumer preferences and international circumstances limit the economy’s capacity to restructure and decarbonise and therefore to reduce negative consequences of carbon taxation for GDP growth. Proper assessment of future technological change is relevant for all sectors and inputs. Examples are given that show that energy and materials efficiency have an important role in future GDP growth under carbon constraints, because they determine the economy’s flexibility to reduce energy consumption and to substitute it, e.g. by labour. This finding normally holds not only for South Africa, but also for the rest of the world. These results also imply that international climate policy must coordinate technology transfer and that it has to take different potentials of nations to decarbonise into account.
iv
Résumé
Cette thèse fournit une illustration numérique de la façon dont une taxe carbone pourrait affecter le PIB, l’emploi, les émissions de CO2 et les inégalités socio-économiques en Afrique du Sud. Elle utilise un modèle d’équilibre général calculable « hybride » en économie ouverte par projection en un seul pas de temps de 2005 à 2035. Le modèle représente des économies de second rang, notamment des rigidités sur le marché du travail liées aux niveaux de qualification et dans la production électrique. Sept scénarios basés sur des modalités différentes de recyclage de la taxe carbone sont analysés, plus une option d’investir une partie des revenus de la taxe dans l’amélioration des qualifications de la force de travail.
L’analyse montre que sous hypothèse standard de changement technique, une taxe carbone de 100 ZAR par tonne de CO2 environ a peu d’impact négatif sur le PIB et l’emploi lorsqu’elle est associée à un mode de recyclage des revenus approprié : subventionner le facteur travail et réduire les taxes sur les profits des entreprises pourrait conduire aux meilleurs résultats macroéconomiques, mais ne réduit pas les inégalités. Des mesures supplémentaires sont nécessaires pour réduire la « pauvreté énergétique ». Pour atteindre le NDC d’Afrique du Sud au titre de l’Accord de Paris, un taux de taxe d’environ 300 ZAR ou 55$ par tonne de CO2 serait nécessaire. Toutefois, un tel taux pourrait avoir un impact significatif sur la croissance du PIB. En même temps, sans changement de la tendance de croissance de la productivité du travail, ce PIB plus faible conduirait à un chômage plus élevé que dans le cas de référence. Une politique d’investissement de 7.5 milliards de ZAR de revenus carbone dans les qualifications de la main d’œuvre, avec l’objectif d’augmenter l’accès à la formation de haut niveau et de réduire le manque de salariés très qualifiés, pourrait avoir un effet très positif sur la croissance du PIB. Néanmoins, de meilleures données de calibration sont encore nécessaires.
Les conclusions de cette thèse appellent par ailleurs à un examen approfondi du type de changement technologique qui pourrait se produire en Afrique du Sud. Le progrès technologique, les préférences des consommateurs et le contexte international, limitent la capacité de l’économie à se restructurer et se décarboner et incidemment à réduire les impacts négatifs de la taxe carbone sur la croissance du PIB. Une véritable évaluation du changement technologique futur serait pertinente pour tous les secteurs et facteurs de production. Nous donnons des exemples qui montrent que l’efficacité énergétique et matières jouent un rôle important pour la croissance du PIB sous contrainte carbone, car elles déterminent la flexibilité de l’économie à réduire la consommation d’énergie et à la substituer au facteur travail par exemple. Ces conclusions sont à priori valables pour l’Afrique du Sud mais également pour le reste du monde. Ces résultats impliquent aussi que la politique climatique internationale doit traiter la question des transferts de technologie et celles des potentiels différents de décarbonation sérieuse à l’échelle nationale.
v
Remerciements, Acknowledgements, Dankwoord
Cette thèse n’aurait pas été possible sans le soutien et les contributions, de différentes façons, d'un grand nombre de personnes et institutions. D’abord je voudrais remercier l’Agence Française de Développement (AFD) dans un premier temps, et la Chaire Modélisation Prospective au service du Développement Durable (MPDD) et l’Ecole des Ponts dans un deuxième temps, pour m’avoir offert la possibilité de développer cette thèse de doctorat. Je remercie la Societé des Mathématiques Appliquées et de Sciences Humaines (SMASH) pour avoir accueilli mon premier projet de recherche pour l’AFD. Dans ce cadre, j’aimerais aussi remercier Henri Waismann (à l’époque au CIRED) et Fabio Grazi (à l’AFD) qui ont conçu le premier projet de recherche sur la question de taxation carbone, croissance et emploi en Afrique du Sud. Ce premier projet beneficiait aussi d’un comité de pilotage scientifique dont ces membres, le Professeur John Reilly (MIT) et le Professeur Francesco Ricci (Université de Montpellier), ont fourni un cadre critique pour faire progresser mes recherches.
Cette thèse de doctorat n’aurait pas été possible sans l’École Doctorale ABIES (Agriculture Alimentation, Biologie, Environnement, et Santé) à AgroParisTech, Université Paris-Saclay. Je remercie sa direction, Monsieur Alexandre Pery et Madame Irina Vassileva pour tout leur soutien à mon projet de thèse. J’aimerais également remercier le secrétariat d’ABIES, Madame Fiers et Madame Ponsonnet, pour toute leur aide, et j’aimerais remercier l’équipe d’enseignement, notamment Madame Maltese et Monsieur White, de m’avoir aidé à améliorer mon écriture.
I would especially like to thank Professor Harald Winkler and the Energy Research Centre at the University of Cape Town for having hosted me at two occasions as a visiting researcher. In particular, I would like to thank Bruno Merven and Alison Hughes and their colleagues of the modelling team for their advice, help and for having allowed me to use their energy systems model. I thank the Mitigation Action Plans and Scenarios (MAPS) program for having enabled one of these visits, by letting me participate at their workshop at the University of Cape Town as an invited researcher.
Many thanks go to the members of the jury of my PhD defence for having wanted to read and listen to my PhD thesis and for asking their critical questions and providing me their insightful comments. Special thanks go to the reporters of my jury, Professor Emilio Lèbre La Rovere and Professor Frédéric Lantz for their detailed comments and their positive advice on my PhD defence.
De très grands remerciements à mon directeur de thèse, Franck Lecocq, et mon co-directeur de thèse, Frédéric Ghersi, pour leur encadrement, et leur confiance et gentillesse durant toutes les années de ma thèse. Les discussions avec eux et leurs commentaires à partir de leurs relectures de mon manuscrit étaient inestimables et m’ont appris beaucoup sur la rédaction scientifique en sciences économiques. Un grand remerciement aussi à Henri Waisman et Emmanuel Combet, qui m’ont encadré et appris la méthode IMACLIM, et qui m’ont aidé pendant les premières deux années de ma thèse.
vi
et commenter mes textes. J’aimerais donc remercier Magda Sanocka, Aurélie Mejean, Roberto Cunha, Eoin O’Broin, Carolina Grottera, Julien Lefevre, Gaëlle Le Treut, Antoine Missemer, Philippe Quirion, Quentin Perrier, Audrey Berry, et Meriem Hamdi-Cherif. Des autres m’ont aidé avec des traductions en français de certains textes, notament Cyril Bourgeois, Tarik Tazdaït, Laurent Lamy, et Ameline Vallet. Des grands remerciements vont aussi à Elsa Mosseri, Antoine Teixeira et Eléonore Tyma, qui ont bien voulu m’aider avec imprimer ma thèse étant loin du CIRED.
Other people have contributed by willing to discuss my work at several more or less formal instances, providing me with interesting comments and suggestions. These are notably Bruno Merven, Adrien Stone, Alfred Moyo, Tara Caetano, Fadiel Ahjum, Bryce McCall and Alison Hughes at the ERC, and my (former) CIRED colleages Julien Lefevre, Ruben Bibas, Gaëlle Le Treut, Carolina Grottera, Eoin O’Broin, Audrey Berry, Liesbeth de Fosse and Florian Leblanc. Other colleagues of CIRED, and of other teams in the IMACLIM network, as well as colleagues of project partners or interested parties (AFD staff in Paris and Johannesburg, researchers of UNU WIDER, and at the National Treasury of South Africa) provided me useful comments too during seminars, and network or project meetings. Many useful comments and questions have also been provided by interested audience at seminars and conferences, or as anonymous peer reviewers of journal submissions. I would therefore also like to thank the organisations that accepted my papers or inviting me to come discuss my work. Notably the Green Growth Knowledge Platform, the GAIN meeting of the International Labour Organisations, the Alliance summer school, the International Energy modelling Workshop, the Our Common Future under Climate Change conference, the students workshop of the French Association for Energy Economics and the Chaire Modelisation Prospective au service de la Développement Durable.
Several people deserve my gratitude for having encouraged me at earlier or later stages to start a PhD at CIRED, or for just having frankly discussed its merits with me, this notably concerns Bas van Ruijven and Julie Rozenberg, Günther Nieuwdorp, and my friends Magda Sanocka and Martijn Icks, as well as my former colleague at the IEA, Fabian Kescicki, and my former superiors at the World Energy Outlook, Dan Dorner, Laura Cozzi and Fatih Birol.
In fact, many places and institutions offered me the learning experiences that contributed indirectly to my PhD. Of course, this concerns my Masters in Energy Science at Utrecht University and my master thesis with Bert de Vries, Bas van Ruijven, and Detlef van Vuuren at PBL. But also other educational, work and other experiences thought me a lot: At Tauw bv and Grontmij nv in the Netherlands, at SIB Utrecht, at the Youth Exchange for Sustainability (YES) of Actis and the Vienna University of Technology, during my internship at the Ecodesign Company with Wolfgang Wimmer, and not to forget the other institutions where I studied or went to school from early life onwards, or that provided books (yes, libraries) or backgrounds in any other means. More than the places, it were the teachers, and classmates and friends who had a stimulating influence and were important for my progress. Aussi pendant ma thèse de doctorat la bonne atmosphère à CIRED et la chaleur des relations avec mes
vii
collègues m'ont été d'un grand soutien. Je remercie surtout Audrey Berry, ma très sympathique "co-bureaute" de ces dernières années pour toutes les conversations sur des sujets sérieux mais aussi, quotidiens et léger. On ne partageait pas que le rythme de fin de thèse mais aussi la perspective d’être parents. Même si ça n’est pas tout à fait pareil pour une future mère que pour un future père... Audrey m’a impressionné avec l’efficacité avec laquelle elle a réussi à terminer sa thèse avant l’arrive de son bébé. Des autres co-bureautes ont été très sympathiques aussi : Béatrice, Liesbeth, Oscar et Baptiste, et Florian, Laurent et Cédric avant, et plus récemment Quentin. D’autres (ex-)collègues ont été là, pour partager un dejeuner sur les tables pique-nique dans le Jardin, ou pour discuter ou papoter dans ou dehors la salle à café (ou thé), ou pour rester plus longtemps pour un pot dans le Jardin Tropical ou dans un (certain) bar (à bières Belges) à Paris : Franck, Elsa, Eléonore, Thierry, Meriem, Vincent, Julien, Arancha, Tarik, Aurélie, Fabrice, Azza, Amandine, Carolina, Noémie, Béatrice, Thomas, Yann, Anne, Gaëlle, William, Florian, Manu, Christophe, Céline, Philippe, Catherine, Yaël, Aurélien, Cyril, Laurent, et Laurent, Rémi, Basile, Antoine, et Antoine, Maha, Estelle, Aboubacar, Ameline, Salahheddine, Behrang, Anna, Abdou, Meriam... et plein d’autres collègues et stagiaires qui m’ont fait plaisir avec leur collégialité, blagues (de différente qualité) ou juste leur gentillesse… Je vous remercie tous, et je regrette ne pas avoir pu passer plus de temps avec vous, surtout les deux dernières années de ma thèse. Je remercie aussi des collègues qui faisaient leur stage d’école d’ingénieur au CIRED en partie encadré par moi même : Louis, Marius et Vincent, qui a rédigé son mémoire de master au CIRED. Je vous remercie pour votre gentillesse et la bonne atmosphère, et pour aussi m’avoir appris des choses. Des autres gens dans le jardin tropical m’ont porté des bonnes choses avec leur présence. D’abord mes profs de yoga, Marta et Mélanie, mais aussi les doctorants de CIRAD, ou les collègues conviviales du GRET, Agter, ou de l’IEDES. Des remerciements spéciales vont aussi à Gitta et l’équipe de l’acceuil de campus du Jardin Tropical, sans eu pas de campus, ni de thèses … I not in the least place like to thank the international visitors to CIRED, especially of the IMACLIM network, whose company I had the pleasure to enjoy : James, William, Dipti, Haidi, Mai, thank you! Une très bonne atmosphère, des bons repas (surtout les lundis soirs), et des sorties sympas m’ont accompagné aussi partout où j’ai habité pendant ces années de thèse grâce à des nombreux colocataires fort sympathiques, et grâce à leurs amis, qui m’acceptaient souvant très vite comme l'un d’entre eux: Dihya, Antonin, Stéphane, Isabelle, Elodie, Alex, Hugo, Adrien, Christelle, Leila, Carole, Anne-Laure, Josselin, Marie, Erwan, Nathalie, Débora, Anne-Claire, Anthony, Pierre-André, Céline, Eoin et Pierre-Paolo, les sous-locataires Antonin, José, les artists de la Maison de la Jonglage de passage aux Perreux-sur-Marne – C’est aussi grâce à vous que j’ai tenu la route pour terminer ma thèse. Une grand partie d’entre eux sont devenus des amis proches, et certains nous ont aussi beaucoup aidé ma copine Georgia et moi même, pendant cette dernière année où thèse et grossesse avançaient côte à côte; l’une plus vite que l’autre. Pour cette raison j’aimerais remercier surtout Dihya, Elodie, Hugo et Alex, qui étaient souvant là quand on avait besoin de leur aide ou de leur chaleur, et surtout pour aller boire une verre.
viii
Some colleagues of CIRED and their partners also became close friends, Ruben, Roberto and Tatiana, and Liesbeth and Jan, I have deeply appreciated the discussions, the serious and the joking ones, that you offered me and your availability to just go for a coffee or a drink during these years of PhD study. One person fulfilled many roles, colleague, housemate, proof-reader, and friend. Special thanks therefore go to Eoin, who has an incredible capacity to look at the world with an open and curious eye, while staying stubbornly idealistic as well. His positive character and sense of humour were unbeaten. Over the course of the years my life in Paris made me encounter a number of other people who became my friends (a few of them I already knew before). I especially want to thank Magda and Diego for their positive attitude and many nice plans for things to do in Paris; Zach & Julie for many interesting and fun discussions; Gustav & Anna, for warm welcomes and the best mussels of Paris; Katrin, for having wanted to go on a Lindy Hop course with me despite my lack of rhythm; Jonas and Kate for many nice plans for concerts and hip bars; Willem & Saskia, for having added a homely Utrecht-feel to my first years; Josefien & Mikael, for another Franco-Dutch touch, Youssif & Emeline, for being energetic and cheerful company; and Pépé and Christophe and their bande d’amis as well as many friends of Eoin and Roberto for the lively evening discussions (and music) at Les Lilas. Doing a PhD can also be drag for social life too, and some people I lost touch, despite that I appreciated their fun company, friendship and support at several stages of my PhD. I also want to thank, Nora & Gwen and their aunt Nina, for being the first to welcome me warmly in the 13th arrondissement of Paris, when I just arrived.
Other friends were far away from Paris, some visited regularly, and others were always there to welcome me when on a visit to the Netherlands, or over the phone or through skype. They were always curious to hear how I was doing and encouraged me to go on, even while some of them were struggling with their own PhD writing, job & family-life combinations, and sometimes big personal losses. Talking to them or just keeping in touch and meeting up has been a great pleasure and of real support to me. My many thanks and big hugs for staying friends during all of these years therefore go out to Nils & Willemijn, Jelle, Joost & Monique, José, Martijn, Christiaan & Jennifer, Ahmet & Fatma, Chris & Ike, Willem & Yuki, Nuno & Rita, Niranji, Julia, Verena and Caroline (as well as to their “Brussels” friends). Some of my friends’ parents also kept interested in my whereabouts, I specially wish to thank Erica, and Petra & René. The same is true for some of my friends’ kids, and though they probably won’t read this: Jacob, Liebrigje, Ike, bedankt!
Une rencontre à Paris a changé ma vie éternellement. C’est de faire connaissance avec Georgia, qui est devenue mon grand amour. Mais, Georgia amenait tout une (ou même plusieurs) bandes des copains, qui sont devenus mes copains aussi pour une partie d'entre eux. Certains ont toujours montré plein d’intérêt pour moi et ma thèse, et j’aimerais les remercier ici aussi, également pour avoir soutenu et améliorer le moral de Georgia, qui a déjà soutenu ma thèse mille fois : Anne-Sophie (qui proposait d'envoyer ma thèse à ma place) & Nico, Marie & Fabrice, Audrey & Momo, JC & Catherine,
Anne-ix
Cécile, Arnaud, Delphine, et Delphine, Agnès & Josselin, Alice, Matthieu, Martin, Coco, Sophie et les autres copains « cyclistes », Nico & Ludivine, Jérome, Camille et Jérôme, Nathalie, Lisa & Daniela, Nico, Miguel & Letitia, et tous les copains du lycée international : Tatiana & Seb, Amélia & Thomas, Elodie, encore un Nico, Sophie & Matthieu, Mehdi, Thomas et Romain, et Olga, que j’ai connu beaucoup trop peu…
Mes remerciements vont aussi à la famille de Georgia, qui m’a chaleureusement acceuilli, sans trop poser des questions sur ce projet de thèse sans fin. Surtout les parents de Georgia, Gilbert & Georgina, qui ont beaucoup fait pour rendre plus agréable notre vie à Paris en tant que jeune couple plus-ou-moins dynamique… Mais aussi la reste de sa famille, sa "mamie Ginette" avec tout ses sourires, ses tantes et oncles, et ses cousins de France, d’Espagne et du Mexique!
Ik wil ook de ooms en tantes binnen mijn eigen familie bedanken die mijn tijd in Parijs en mijn proefschrift met interesse zijn blijven volgen. Mijn hartelijke dank gaat ook naar oom Piet, die zes jaar geleden mij en mijn vader geholpen heeft om mij naar Parijs te verhuizen. Erg veel dank heb ik ook voor mijn zussen, Sophie en Lian, en hun partners, Tamar en Nicky, die me via skype of met bezoekjes aan Parijs zijn blijven volgen, en wier gezelschap en gesprekken me altijd goed doen en vaak een hart onder de riem steken. De bijna… allergrootste dank gaat echter uit naar mijn ouders, Jos en Nellie. Pap & Mam, jullie hebben altijd veel geduld getoond, en jullie hebben me laten vertrekken naar Parijs, en niet te veel geklaagd als ik lang niets van me liet horen. Bovenal was ik zonder jullie nooit zover gekomen de lange missie van een proefschrift in een groot milieu-economische vraagstuk aan te gaan. Bedankt!
Mais au final il n’y a qu’une personne que je dois vraiment remercier pour son soutien à ma thèse, car c’est elle qui a sacrifié et patienté le plus, qui m’a dit de continuer, même quand elle m’a critiqué pour mon manque de progression, et qui, en même temps, n’avait pas peur d’avancer dans la vie avec un thèsard qui avançait très peu. C’est ma compagne Georgia. En plus, grâce à elle, j’ai rencontré la personne le plus magnifique et fascinante de ma vie. Ses sourires ont une valeur infinie et ils m’ont remonté le moral aussi aux moments les plus durs de ma thèse… notre fils Max. Georgia et Max, je vous aime, ik hou van jullie…
xi
Table of Content
Abstract iii
Résumé iv
Remerciements, Acknowledgements, Dankwoord v
Table of Content xi
List of acronyms xiii
Technical Summary xvii
1. Introduction 1
1.1. Challenges for South Africa’s economic development 1
1.2. South Africa’s response to climate change 4
1.3. Research questions 7
1.4. Existing studies on development and climate policy in South Africa 10
1.5. Thesis outline 19
2. Theory for a CGE model for analysis of carbon taxation, growth and employment 21 2.1. Growth, environmental constraints, and technological change 21 2.2. Intermezzo: Modelling technological change in developing economies 49 2.3. A second-best labour market model with skill differentiation 52
3. The IMACLIM South Africa model 60
3.1. Application of the IMACLIM framework to South Africa 60
3.2. Supply & demand for goods, prices and CO2 emission accounting 79
3.3. Labour market model 88
3.4. Income distribution and the capital market 94
3.5. Overview of model variables and constraints 102
3.6. Prospective parametrisation 104
4. Reference Projection and results of scenario analysis 120
4.1. A reference projection for 2035 120
xii
4.3. Ctax scenarios and their results 151
4.4. Decomposition analysis of main Ctax scenarios 158
4.5. Revenue recycling with investment in skills 178
5. Alternative scenarios and sensitivity analysis 188
5.1. Introduction 188
5.2. Imposing a CO2 emission target which achieves the NDC 189
5.3. A multilateral carbon tax 194
5.4. In or out of the “Carbon Club” 198
5.5. Enhanced energy efficiency scenario 202
5.6. Sensitivity analysis 214
6. Discussion 228
6.1. Reflections on the methodology 228
6.2. Comparison to other studies on carbon taxation in South Africa 249 6.3. Discussion of results in the context of theory about economic development under
environmental constraints 261
7. Conclusion 267
7.1. Answers to the research questions 267
7.2. Policy implications 281
7.3. Future research 290
References 295
Detailed Table of Content 311
List of Figures 316
List of Tables 317
Résumé significative 319
xiii
List of acronyms
AFD Agence Française de Développement
BAU Business-as-Usual
BoP Balance of Payments
BU model Bottom-Up, or partial equilibrium, or engineering-knowledge based model
BTA Border Tax Adjustment
CEA Constant Educational Attainment levels
CES Constant Elasiticity of Substitution
CFC Consumption of Fixed Capital
CGE Computable General Equilibrium
CIRED Centre International de Recherche sur l’Environnement et le Développement
CO2 Carbon dioxide
COA Coal mining sector of IMACLIM-ZA
COP21 Conference Of the Parties to the UNFCCC (see below), 21st edition, held in Paris November-December 2015
CPI Consumer Price Index
CSLF Constant Shares of the Labour Force
Ctax Carbon tax
CTL Coal-To-Liquids
DIM Domestic Income Multiplier
DoE Department of Energy of the governement of South Africa
EIN Energy INtensive and other mining sector
ELM External Labour Market
ELC Electricity sector of IMACLIM-ZA
EKC Environmental Kuznets Curve
ERC Energy Research Centre, of the University of Cape Town (UCT)
e-SAGE energy-sector module added South African General Equilibrium model ESKOM South Africa’s national power generation & distribution company
FC Final Consumption
Fi Firms
GAS Natural gas and other gaseous fuels sector of IMACLIM-ZA
GDI Gross Disposable Income
GDP Gross Domestic Product
GDP PI GDP Price Index
GFCF Gross Fixed Capital Formation
GHG Green House Gas
GTL Gas-To-Liquids
GOS Gross Operating Surplus
Gov Government (at all levels), by which in fact is meant the entire public sector
xiv
HIV Human Immunodeficiency Virus
Hh Household class, or Households’ (in an adjective sense)
HSS High Skill Services sector of IMACLIM-ZA
IC Intermediate Consumption
ILM Internal Labour Market
IMACLIM IMpact Assessment of CLIMate change policies (Crassous, 2008)
ILO International Labour Organisation
IPCC Intergovernmental Panel on Climate Change
I-O Input-Output
IRP Integrated Resource Plan
KLEM Kapital – Labour – Energy – Materials
LNG Liquified Natural Gas
LSS Low Skill Sectors of IMACLIM-ZA
MACC Marginal Abatement Cost (MAC) Curves
MEC Minerals-Energy-Complex
Mt Megatonne
NDC Nationally Determined Contribution
NDP National Development Plan
NERSA National Energy Regulator of South Africa
NNI Net National Income
OECD Organisation for Economic Cooperation and Development
OIL Crude oil (imports) sector of IMACLIM-ZA
O&M Operation & Maintenance
PhD Philosophiae Doctor (Doctor of Philosophy)
PJ PetaJoules
PPP Purchasing Power Parity
PV PhotoVoltaic
QLFS Quarterly Labour Force Survey
RCPI Relative Consumer Price Index
RDEF Revenue recycling through DEFicit reduction
R&D Reseach & Development
REER Real Effective Exchange Rate
REF Refineries sector of IMACLIM-ZA
RGOV Revenue recycling through increased governmental final consumption
ROW Rest of the World
RP Reference Projection
RSA Republic of South Africa
RSUM Revenue recycling through a lump-SUM transfer
RTaY Revenue recycling to redaction of Taxes on production (Y)
xv
RTIF-low Revenue recycling reducing Taxes on Income of Firms, with lowering of profit margins
RTSC Revenue recycling reducing Taxes and Social Contributions on labour
RVAT Revenue recycling reducing VAT
SA South Africa
SAM Social Accounting Matrix
SASOL South Africa’s main international integrated energy and chemical company
SATIM South Africa TIMES model
SLM Segmented Labour Market
StatsSA Statistics South Africa
SU tables Supply and Use tables
SNI Sustainable National Income
tCO2 tonne of CO2 emissions
TD Top-Down, or macro-economic, often CGE, model
TFP Total Factor Productivity
TIMES The Integrated MARKAL-EFOM System (of IEA-ETSAP)
TRA TRAnsport service sector in IMACLIM-ZA
UNFCCC United Nations Framework Convention on Climate Change
UCT University of Cape Town
USD United States Dollar
VA Value Added
VAT Value Added Tax
ZA South Africa
xvii
Technical Summary
Introduction and methodology
Backgrounds
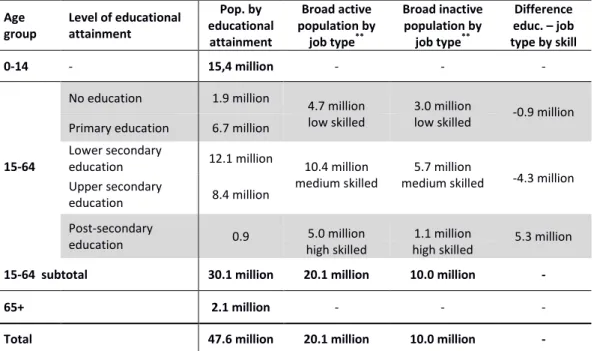
South Africa faces a double challenge of developing economically and reducing its greenhouse gas emissions at the same time. Its main economic problem is high unemployment and inequality. One of the causes is a shortage of high skilled labour, and another often mentioned cause is what is called the “Minerals-Energy Complex” which reinforces inequality and creates disadvantageous economic conditions for labour intensive sectors.
South Africa is both likely to suffer from climate change – economically, and in terms of human health and ecologically –, and at the same time a big contributor to climate change. In terms of climate change the Republic of South Africa has made clear in its Nationally Determined Contribution to the Paris Agreement that it wants to take its responsibility to reduce its greenhouse gas emissions, given the right availability of support. The country is therefore developing climate change mitigation policies, and as a part of that has it is working on the implementation of a carbon tax.
Electricity production plays a big role as it is responsible for a bit more than half of South Africa’s GHG emissions, and almost two thirds of energy use related CO2 emissions. In 2005 about 45% of electricity was consumed by energy sectors, mining and heavy industries. However transport and industrial processes contribute strongly as well.
Some policy strategy documents try to integrate economic and climate change policies. Nevertheless, the National Development Plan1 still treats economic development and climate change in rather separate manners. However, without a low-carbon development path South Africa risks lock-in of polluting infrastructure with the costs for the South African society. It is important to correctly inform the debate about SA’s options for low carbon development. Improving economic modelling is part of improving such knowledge and insights, which is why this PhD thesis presents a macro-economic analysis of a South African carbon tax and its revenue recycling.
Research question and differences with other studies
This thesis tries to answer whether the objectives of economic development and climate change mitigation can be combined through the implementation of such a carbon tax and especially the recycling of the revenues which it generates. It also looks into the possibility to reduce the “skill’s shortage” as a way to create low carbon growth. The premise is that no mitigation policy can be successfully implemented without taking into consideration South Africa’s concerns about growth, employment, and inequality. The main research question therefore is:
xviii
How could climate policy influence South Africa’s economic development? What order of magnitude could be expected from such policies in terms of socio-economic impacts and environmental impacts? This question has been studied elaborately in scientific literature. Studies find differing degrees of economic impacts, and in some case economic benefits, for South Africa’s economic development of climate change mitigation policies, mainly carbon taxation.
Compared to these studies this thesis proposes changes in economic modelling, particularly the inclusion of second-best economies for price setting in the labour market. It uses the IMACLIM framework of dual accounting of physical and economic flows in a “hybrid” I-O matrix of the SA economy for the modelling of energy use, allows for the application of an “engineering” view on future productivity or intensity of factors and inputs; and secondly, for estimating technological coefficients of future electricity production (“engineering” input and factor intensities) on the basis of a BU-model. Also, the present study uses a simulation model rather than intertemporal optimisation, synonymous to perfect foresight, as most studies do. Furthermore, it highlights complications in describing the role of skills in an economy and in CGE modelling. Finally, this thesis offers a detailed evaluation of the economic mechanisms of structural and technological change through which carbon taxation and recycling of its revenue could contribute to low carbon growth.
Methodology for analysing growth, environmental constraints, and development
Growth within environmental limits
To decide on what model to develop the question of how the interaction between environmental limits and economic growth is understood needs to be answered. This topic has received attention in economic sciences for more than a century. A selective review of scientific literature in this area leads to the conclusion that it is unlikely that when moving from a state of polluting growth to one of environmentally sustainable growth, a short-time drag on economic growth can hardly be avoided. The reason being that lack of regulation has promoted the use of technologies which externalise environmental costs. Environmentally sustainable “technologies” are therefore likely (still) less productive, which means that they are more costly. This does not mean growth needs to stop, because in theory technological progress can still continue. In the long run, growth will even be higher, because in the long run economic disadvantages of scarce or destroyed resources would have reduced growth too while obliging to perform the transition to sustainable capital against higher costs.
The conclusion is that the central issue is to foresee and integrate technological change in a macro-economic model.2 In the context of modelling technological change, an important issue is how to account or model inertia in the modes or technologies of production and consumption. A proposed innovation to capture technological change is to model it endogenously. These models however often fail to provide a basis for how to calibrate them, at least one applicable to South Africa.
2
Other measures, such as investment in R&D or evaluation of intelligent ways of influencing investment through mechanisms such as green bonds were unfortunately out of scope for this thesis.
xix
More traditional production functions calibrate price elastic technological change on the basis of cost shares of factors, which are considered unreliable for representing the trade-off between capital and energy use. For the purpose of relatively long term prospective macro-economic modelling common to the analysis of climate change policies, Ghersi and Hourcade (2006) propose the use of technological coefficients informed by engineering knowledge, or energy system bottom-up models as a better way to project technological change in a (top-down) macro-economic CGE model.
To model economic behaviour and technological change they propose the macro-economic equilibrium framework IMACLIM. The reasons for the choice of this framework are:
It uses dual accounting of physical volumes and values of economic flows, which is better capable to represent technological change and incorporate insights from engineering and so-called Bottom-Up models, rather than a “factor-value shares”-only approach to modelling technology in production;
It models second-best economies: for profit or price-setting (mark-up rates); in wage setting (wage curve and equilibrium unemployment); and through rigidities in technological change and consumption. This allows to better capture both costs and benefits from lifting and introducing second-best economic conditions;
It uses myopic simulation and avoids intertemporal optimisation: the latter under-estimates costs and benefits of policies which aim at avoiding infrastructure lock-in.
Development, growth and technological change
To model economic growth in developing and emerging countries functions a topic of discussion is whether convergence is taking place in per capita GDP. However, the more important question appears to be whether the adoption or development of more productive technology is taking place. Views about this question differ, notably about the respective roles of government and the free market. The conclusion is that such technological development and the development of (new) industries cannot be taken as a given fact in a single country study, such as for South Africa. The question of how to model prospective technological change is therefore also relevant in this context.
A second-best labour market model with skill differentiation
Due to the problematically high rate of unemployment in South Africa, second-best economies in the labour market need to be a key element of any analysis of economic development and the policies which could impact it. Furthermore, considering that reducing the skill-constraint of the South African economy offers a potential for environmentally benign economic development, this feature of the South African labour market needs to be part of the analysis and modelling of this thesis.
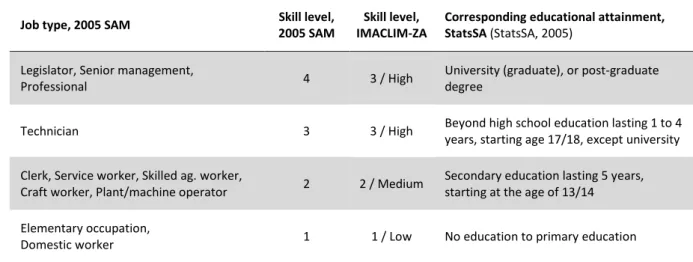
To model the labour market, the wage curve (out of multiple theoretical models) is the most convincing and most useful model in the South African context. To model the skills shortage, a segmented labour market model is proposed with a positional definition of skill of labour for the following reasons: (i) Earlier work has shown that an approach which equals skills to the level of
xx
educational attainment runs into the problem that the foreseen increase in the level of educational attainment of the SA labour force cannot be absorbed by the SA economy in a CGE, except under extreme assumptions about labour productivity3; (ii) Recent findings show that for the majority of South Africans the quality of the education is poor, something which can be expected to impact the South African labour force still in the coming decades; (iii) Several more sophisticated labour market models by level of skill could be imagined, but lack calibration data.
To model skill of labour two approaches are common: “Human capital” models, which consider labour as one factor with a changing average level of skill; and different types of “segmented” labour market models. Of the latter, multiple types have been identified. Most of these models are market-clearing wage setting models, but wage curves can be imagined too in some of these models. The informal-formal duality could be seen as a special case of a segmented labour market model, but it could to some extent be captured by sectoral disaggregation and having, three or four levels of skills. The latter seems to fit the reality in South Africa’s labour market best. Furthermore, to reflect recent trends of a global trade-off between low- and high skill labour, for a part explained from technological change, this thesis models demand for high skill labour complementary to capital.
The IMACLIM South Africa model
IMACLIM South Africa (ZA) is an open-economy “hybrid” CGE model, running a one-step
simulation from 2005 to 2035, taking account of population dynamics, exogenous productivity gains
for all factors and inputs of production. It has sectoral disaggregation in 5 energy sectors and 5 non-energy sectors which have been grouped on the basis of the criteria of intensity in non-energy consumption; exposure to trade; and the skill profile of sub-sectors. International trade is modelled through Armington (style) price elasticities;
Its hybridisation procedure consists of three steps: (i) Translating energy balances and other information into an input-output (I-O) table of energy flows mirroring in its composition the economic I-O table; (ii) multiplying this table with user-specific energy price data, creating an “energy bills” I-O table; and (iii) “hybridising” by imposing the “energy bills” I-O table on the economic I-O table and adjusting the latter to re-obtain a balance in Inputs and Outputs by sector.
Technology of production of all sectors except electricity is modelled with nested CES KLEM production functions that also differentiate between three levels of skill of labour of labour and capital. Exogenous assumptions about technological change through changes in factor productivities and input intensities are differentiated by sector, reflecting different potentials for technological innovation and efficiency gains.
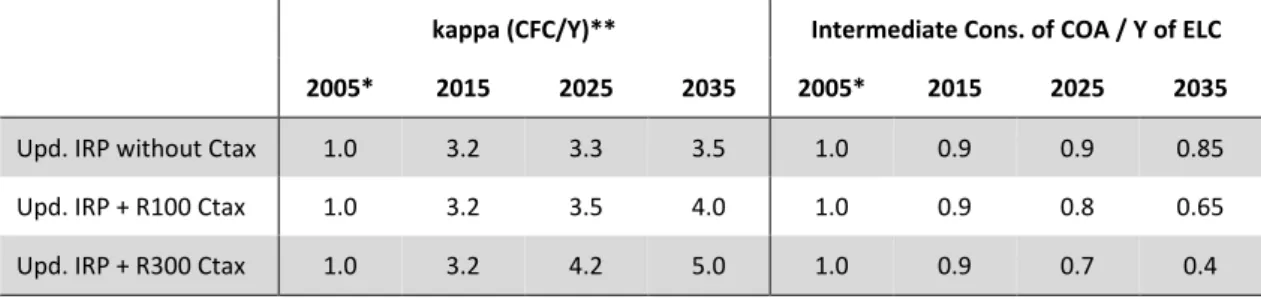
Technology for production of electricity is modelled on the basis of outcomes of the TIMES South Africa model (SATIM). It consists of applying similar trajectories for energy prices (notably coal and
xxi
electricity) to IMACLIM-ZA and SATIM, and running the latter model with different scenarios for carbon tax rates, similar to the ones in IMACLIM-ZA.
The labour market consists of three separate segments by level of skill, each modelled with a wage curve for the relationship between rigid real wages, indexed on productivity, and unemployment. Demand for investment follows the capital intensity and the projected GDP growth. The endogenous interest rate allows solving the capital market.
Primary and secondary income distribution is modelled for four main economic agents: firms, government, households and the rest of the world (ROW). Households are further disaggregated into 5 income-skill classes, whose consumption behaviour is represented by nested-CES consumption functions. For each agent exogenous assumptions about saving, investment, and thus future (international) borrowing and lending are made, and debt accumulation is modelled as well.
Policy scenarios are analysed against a reference projection (RP) meant to be a coherent and
reasonable economic future (disregarding impacts of climate change). The RP’s purpose is to identify
the impacts and key mechanisms caused by the carbon tax and different types of carbon tax revenue recycling, by separating these impacts from those of the rest of the prospective parameterisation. Because a part of parameters has been chosen ad hoc, parameterisation of RP is benchmarked against “normal” values for a list of “macro-indicators”. The parameters which in theory are most relevant for modelling growth and unemployment are: Productivity changes; trend in export volume; the evolution of international prices; higher elasticities for international trade; elasticities of production functions.
Analysis of carbon tax scenario results
Main carbon tax scenarios
Eight “main” carbon tax (Ctax) revenue recycling scenarios are analysed, and investment in skills is added as an option (see below):
RDEF, revenue recycling through reduction of South Africa’s public debt – the rapid increase of which in recent years is currently perceived as an economic problem;
RVAT, recycling through reduction of a sales tax – this is seen as a way to reduce the burden of a Ctax for South African consumers and generate economic activity;
RGOV, models an increase in final consumption by government for more public services; RSUM, a per capita lump sum transfer to all households – this measure is proposed to as a
pro-poor way of revenue recycling to citizens;
RTIF, recycling via reduction of company profit taxes. There are 2 variants:
o “fix”: In which companies do not change their profit mark-up rates (calibrated on BY
xxii
o “low”: Mark-up rates decrease (e.g. due to pressure of competition) and firms only
maintain returns to equity about constant, consumers benefit from cheaper products; RTaY, recycling via subsidies to production of non-energy sectors, to stimulate activity in
non-energy sectors;
RTSC, replacing charges for social security and pension contributions by a subsidy to labour. All scenarios are analysed for two levels of a carbon tax: 100 and 300 ZAR2005/tonne CO2 (resp. 18 and 55 USD2013/tonne CO2); The outcomes of these scenarios are compared to a Reference Projection (RP), which is modelled with the objective of being a “reasonable” expectation for a business-as-usual socio-economic future of South Africa.
Reference projection (RP)
A first key outcome for the evolution of the South African economy from 2005 to 2035 in RP is an increase of CO2 emissions of 55%, implying a rise in per capita CO2 to about 11 tonnes per capita. This is paralleled by an economic growth 2.7% on average per year, or 125% over 30 years, which corresponds to growth of real per capita GDP of 80%. Together this translates into a decrease of CO2 intensity of GDP of 31%.
This decarbonisation of GDP can mainly be seen as a response to assumed price increases for coal, electricity, imported oil, and refinery products. Electricity production and household private transport decrease their share in direct CO2 emissions, while refineries, transport services and industrial sectors have an above average increase in direct CO2 emissions. If one also allocates first-degree indirect CO2 emissions from energy sectors and transport then also the energy intensive industries and other mining sector (EIN), increases its share South Africa’s CO2 emissions (from 37% to 41%). Exports’ share also increases (from 7 to 8%), whereas that of households decreases (from 24% to 19%).
Employment increases by about 8 million jobs, causing the broad unemployment rate to decrease from 39% in 2005 to 24% in 2035. Technically, this reflects growth in real demand outpacing growth in labour productivity and the labour force, in other words: the labour force and labour productivity together grow less (82%) than total GDP (125%). Decreasing unemployment is accompanied by higher real wages, but mostly for high skill labour, and relative income inequality between the poorest and richest household class (resp. class 1 and 5) increases. Consumption budgets of median income and lower middle class (classes 3 and 4) increase relatively fast, slowly catching up with the richest households (class 5). Material standards of living improve for everyone when it concerns non-energy consumption. However, per capita consumption of energy goods (ELC and REF) does not increase much. Classes 1 and 2 experience respectively a decrease or no increase of per capita consumption of electricity.
An increase in trade balance surplus as a consequence of model parameterisation about net international income transfers and borrowing and lending goes in parallel with a slight (~10%)
xxiii
devaluation of the real effective exchange rate of the South African Rand.
Methodology for analysis of scenario results, and application to RP
It is not only the results which interest us, but also why scenario assumptions led to them. However, results for GDP growth and employment do not follow intuitively from assumptions of IMACLIM-ZA’s prospective parameterisation. Explaining outcomes of CGE models is difficult, because of the many feedback loops in the model. A crucial element to explain growth of GDP and especially employment is the fact that in RP (and many scenario results) GDP per worker grows more than labour productivity in volume terms.
What counts in IMACLIM-ZA is the evolution of the average price of primary factors’ productivity (in volume terms) relative to the average price of goods supplied to the economy – in an open economy model this ultimately means relative to the price of foreign goods. In the scenarios of this thesis, which have an approximately constant trade balance and current account over GDP, the real effective exchange rate (REER) expresses this relative evolution of the price of primary factor productivity relative to foreign prices and thus expresses international competitiveness. However due to rigid real primary factor prices, the price of primary factor’s productivity also determines domestic purchasing power and demand. Figure.0.1 thus expresses how the price of primary factors’ productivity relates to factor use, and thus to GDP growth relative to primary factors’ productivity growth in volume terms.
Figure.0.1 Causal loop diagram of how a change in primary factor prices over factor productivity impacts GDP
Explanation of the figure: A causal loop diagram shows how variables in a model are linked: a “+” sign with a connecting arrow indicates a
positive relationship of a change in one variable on the other, a “-“ sign a negative relationship; For IMACLIM-ZA this figure is conditional on a constant current account and trade balance (relative to GDP), as well as fixed price elasticities for international trade; One mechanism (in shaded boxes) in the scheme functions as a brake on the relation between GDP and productive primary factor unit costs: Non-substitutable imports would become too expensive if primary factor productivity would become very cheap.
The disadvantage of the REER as an explanation for GDP growth in scenarios is that its aggregate character makes it hard to link it scenario assumptions. I therefore construct another indicator that quantifies the change in domestic income relative to volume of goods supplied to the South African
Costs domestic goods basket Relative price imported vs dom. products REER International competiti-veness Import substitution by dom. products Price "productive” primary factor unit Factor use = GDP Foreign demand dom. products Domestic demand dom. products Costs non-substitutable imports** − + + + + + + − − + + +
xxiv
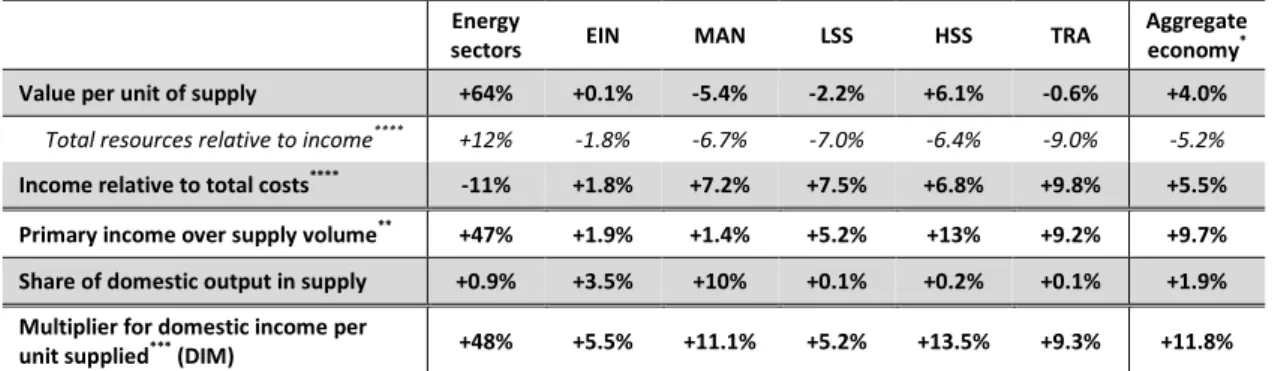
economy (domestic output, Y, + imports, M), also conditional on the constant trade balance and current account found in IMACLIM-ZA’s scenarios. Due to income growth equating to growth in demand, and therefore further increase of the volume of goods supplied to the economy, this indicator has the character of a multiplier, which is the reason that I call it the Domestic Income Multiplier (DIM). While I do not calculate the multiplier effect of this indicator, I do demonstrate that it correlates strongly with GDP growth results. The advantage of the DIM, compared to the REER, is that its 3 components and the fact that it can be calculated at the sectoral level enable showing how scenario settings lead to GDP growth results.
The DIM is calculated on a per worker basis, and consists of change in income per average volume unit of supply, multiplied by the change of the volume of domestic output over the volume of supply (Y+M). The latter is added, because domestic output generates more primary income per unit (value added plus indirect taxes) than average supply. The first term, growth of income relative to volume of supply consists of two elements: (i) Income growth thanks to cost reductions, meaning relative to the non-income parts of the cost structure of resources of a sector or the aggregate economy; and (ii) growth in the average value (price) of supply. The latter term is not easy to analyse. It can be considered a consequence of structural change and e.g. also of increase of primary factor prices’ productivity (income) compensated by a decrease of the REER, meaning that it allows primary income to grow without causing cost increases and without negative consequences for international trade (e.g. growth of exports).
For the Reference Projection (RP) it can be shown that the increase in the DIM is driven for a large part by growth of value per unit of supply and by cost reductions in average production (see Table 0.1). It can be noticed that energy sectors increase their average price, but this has little negative consequences for international trade or for the ratio of income over costs in the supply of goods and services by other sectors, whose costs decrease thanks to import substitution and efficiency gains for materials & services inputs.
Growth of income relative to the volume of goods and services supplied to the economy causes GDP growth to exceed growth of supply per worker (which is found to be 23% in RP relative to base year (BY)) and growth of the labour force (34% vs BY), which – all other things equal – would translate into a growth of volume of supply of 65%. However thanks to the cost decreases and structural change captured by indicators like the DIM and the REER, GDP grows 125% in RP. Per worker, GDP growth turns out to be 35% in RP. All in all, this means that the employed labour force increases 66% relative to base year (and the employment rate 24%), corresponding to the mentioned 8 million jobs. Trade-offs in production and in the labour market cause this increase in employment to be slightly more concentrated in medium and high skill jobs than in low skill jobs.
xxv
Table 0.1 Calculation of DIM by sectorfor RP, vs BY
Energy
sectors EIN MAN LSS HSS TRA
Aggregate economy* Value per unit of supply +64% +0.1% -5.4% -2.2% +6.1% -0.6% +4.0%
Total resources relative to income**** +12% -1.8% -6.7% -7.0% -6.4% -9.0% -5.2% Income relative to total costs**** -11% +1.8% +7.2% +7.5% +6.8% +9.8% +5.5% Primary income over supply volume** +47% +1.9% +1.4% +5.2% +13% +9.2% +9.7% Share of domestic output in supply +0.9% +3.5% +10% +0.1% +0.2% +0.1% +1.9% Multiplier for domestic income per
unit supplied*** (DIM) +48% +5.5% +11.1% +5.2% +13.5% +9.3% +11.8%
Comments: * Supply concerns total resources, in volume terms it consists of Y+M, whereas for energy sectors it is measured by dividing the value of supply by a price index for total energy resources. For the aggregate economy the volume of supply measures GDP growth. The values of average units of supply has been calculated as change in per worker values; ** The change in final demand per unit of supply is calculated by multiplying: (1+ change in value per unit of supply) * (1+ change in income relative to total resources); *** Multiplying the change in final demand per unit of supply times the change in the share of domestic output in supply gives the GDP multiplier per unit of supply; **** Income relative to total costs is the inverse of total resources relative to income.
Structural change favours growth of EIN, MAN, LSS and HSS sectors, relative to energy sectors and transport services (TRA). Decomposition analysis of the economic structure shows that domestic demand plays an equally large role in SA’s GDP growth, with manufacturing (MAN) and labour-intensive sectors (LSS and HSS) seeing final demand to grow faster than exports, while the opposite is true for export-oriented energy sectors and the energy intensive industries & other mining (EIN) sector.
The decreasing CO2 emission intensity of SA’s GDP can be seen as partly a consequence of this structural change between sectors, with the volume of output growing more in MAN than in the more energy intensive EIN and TRA, and more in HSS than in the relatively more energy intensive LSS. However, most importantly, demand for electricity decreases. This is also caused by increasing energy and materials & services efficiency in production. Though not all sectors are equally capable to decrease their own emission intensity: HSS and MAN decarbonise more than EIN and LSS, while the direct CO2 emission intensity per unit of output of REF and TRA also hardly reduces. This capacity of sectors to decarbonise is of significant impact for the results of carbon tax scenarios next.
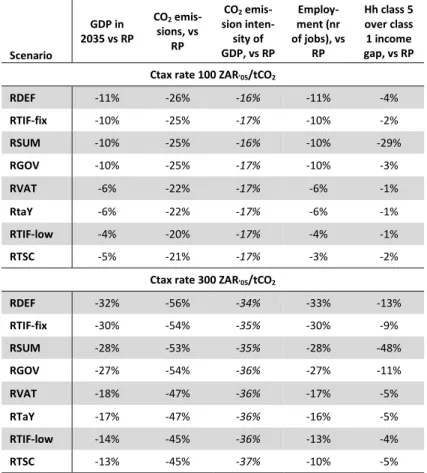
Results of main carbon tax policy scenarios
Big differences were found between carbon tax revenue recycling (Ctax) scenarios in terms of GDP growth, CO2 emissions, and employment. Differences in CO2 intensity of GDP and income inequality, on the other hand, were not very big in most cases. Table 7.1 summarizes a comparison of Ctax scenarios with the reference projection (RP). It shows that two revenue recycling schemes result in much lower GDP and employment losses than other scenarios, while they obtain higher reductions in CO2 emission intensity of GDP. It concerns the scenarios with revenue recycling into a reduction of profit taxes if followed by a reduction of profit mark-up rates (RTIF-low) and with revenue recycling into labour subsidies (RTSC). But, their CO2 emissions are still higher than in other scenarios, because the relative size of their reduction of CO2 emission intensity of GDP is smaller than that of growth of GDP. Income inequality of the richest over the poorest household class, finally, only changes in the
xxvi
RSUM scenario, which sees the per capita income difference between the richest 10% of population and the poorest 20% being almost halved.
Table 0.2 Comparison of key results for Ctax scenarios with reference projection for 2035 (RP)
Scenario GDP in 2035 vs RP CO2 emis-sions, vs RP CO2 emis-sion inten-sity of GDP, vs RP Employ-ment (nr of jobs), vs RP Hh class 5 over class 1 income gap, vs RP Ctax rate 100 ZAR’05/tCO2
RDEF -11% -26% -16% -11% -4% RTIF-fix -10% -25% -17% -10% -2% RSUM -10% -25% -16% -10% -29% RGOV -10% -25% -17% -10% -3% RVAT -6% -22% -17% -6% -1% RtaY -6% -22% -17% -6% -1% RTIF-low -4% -20% -17% -4% -1% RTSC -5% -21% -17% -3% -2%
Ctax rate 300 ZAR’05/tCO2
RDEF -32% -56% -34% -33% -13% RTIF-fix -30% -54% -35% -30% -9% RSUM -28% -53% -35% -28% -48% RGOV -27% -54% -36% -27% -11% RVAT -18% -47% -36% -17% -5% RTaY -17% -47% -36% -16% -5% RTIF-low -14% -45% -36% -13% -4% RTSC -13% -45% -37% -10% -5%
Analysis of carbon tax scenario results
Analysis of results of carbon tax revenue recycling scenarios shows that the choice of revenue recycling schemes has a considerable impact on GDP growth, but that apart from the differences in GDP growth, the differences in CO2 intensity and employment intensity of GDP between scenarios are
relatively small.
The difference in the DIM between Ctax scenarios and RP is roughly proportional to the difference in GDP between Ctax scenarios and RP (see Table 0.3). Note, furthermore, that difference in the DIM vs RP also correlates to difference in the REER vs RP. Some deviations in this relationship can be associated to differences in the trade balance surplus. A break-down of the DIM shows that all scenarios suffer from substitution of domestic production by imports, which is roughly proportional to the REER. Furthermore, all scenarios except RVAT face a decrease in the average value of the supply of goods relative to RP. In RVAT this value increases, but the economy suffers more than in other scenarios from average cost increases (in the resource structure of goods).
Results show two categories of Ctax scenarios: One with relatively low GDP growth (RDEF, fix, RSUM and RGOV), and one with medium to relatively high GDP growth (RVAT, RTaY,
RTIF-xxvii
low, and RTSC). First of all, one can observe that low growth scenarios (RDEF, RTIF-fix, RSUM and RGOV) mainly reduce labour costs (income) per unit of GDP to absorb the increase in tax income due to the carbon tax. In parallel, costs for imports per unit of GDP increase in these scenarios, something which could be expected on the basis of the for South Africa’s competitiveness detrimental evolution of the REER. On the other hand, costs for inputs of materials & services per unit of GDP decrease compared to RP, but this is a consequence of the decrease of unit labour costs (gross wages) in their production. Energy costs per unit of GDP do not increase more than in the four scenarios with higher GDP. This can be explained for a large part by the higher REER, which reduces import prices, and therefore the relative cost of OIL imports.
Table 0.3 Change in the DIM, its 3 principal elements, and in GDP and REER, for R300 Ctax scenarios vs RP Change vs RP for R300 Ctax
scenarios
Low growth Ctax scenarios Medium to high growth Ctax scenarios RDEF RTIF-fix RSUM RGOV RVAT RTaY RTIF-low RTSC
iv. DIM* -5.3% -5.5% -6.0% -5.2% -3.6% -3.4% -3.2% -3.0%
v. GDP -32.4% -30.2% -27.6% -27.5% -17.6% -17.2% -13.9% -12.7%
vi. REER +10.4% +10.6% +11.3% +10.4% +5.0% +4.9% +3.6% +2.8%
vii. Trade balance over GDP +1.8% +0.6% -1.3% +0.1% +0.1% +0.3% +0.1% -0.1%
* DIM = Domestic Income Multiplier; It measures domestic income per unit of goods & services supplied to South African markets relative to BY. It is calculated by multiplying elements i to iii (more precisely: 1 + iv = (1+i)*(1+ii)*(1+iii).
Moving on to the four scenarios with medium to low GDP losses relative to RP (RVAT, RTaY, RTIF-low and RTSC), one observes that RVAT and RTaY manage to avoid a forced decrease in labour costs through a reduction of other taxes. In RVAT the cost of (or expenditure on) imports remains high though, whereas in RTaY, the recycling of carbon tax-driven price increases per unit of GDP is incomplete (we will see why this is the case in the next sub-section). RTIF-low assumes a reduction in profit mark-ups and therefore in Net Operating Surplus, which absorbs the largest part of the carbon tax-driven cost increase. Finally, the RTSC scenario shows a decrease in labour costs per unit of GDP, but this time it is not the consequence of a forced decrease in net wages, but due to carbon tax revenue being recycled into labour subsidies.
A successful revenue recycling mechanism proves to be one which manages to translate this cost increase for energy and energy-intensive sectors into a sufficiently big cost decrease in especially labour intensive sectors, thereby maintaining purchasing power close to the level of RP and lifting possible negative consequences for the trade-off between domestic and foreign products. The four low growth scenarios offer no such kind of cost reductions, and their type of revenue recycling rather represents a kind of an income transfer or a subsidy to final consumption. Still, any revenue recycling mechanism can achieve this only up to a limited extent, because of rigidities in intermediate and final consumption, especially of energy products. And, without any sudden drastic improvements in productivity with the introduction of a carbon tax – beyond price-elastic substitution of energy in production modelled with common elasticities of substitution, the consequence is that GDP growth will be (at least temporary) lower with carbon taxation.