HAL Id: hal-00296403
https://hal.archives-ouvertes.fr/hal-00296403
Submitted on 20 Dec 2007
HAL is a multi-disciplinary open access
archive for the deposit and dissemination of
sci-entific research documents, whether they are
pub-lished or not. The documents may come from
teaching and research institutions in France or
abroad, or from public or private research centers.
L’archive ouverte pluridisciplinaire HAL, est
destinée au dépôt et à la diffusion de documents
scientifiques de niveau recherche, publiés ou non,
émanant des établissements d’enseignement et de
recherche français ou étrangers, des laboratoires
publics ou privés.
Aerosol Lidar observations and model calculations of the
Planetary Boundary Layer evolution over Greece, during
the March 2006 Total Solar Eclipse
V. Amiridis, D. Melas, D. S. Balis, A. Papayannis, D. Founda, E. Katragkou,
E. Giannakaki, R. E. Mamouri, E. Gerasopoulos, C. Zerefos
To cite this version:
V. Amiridis, D. Melas, D. S. Balis, A. Papayannis, D. Founda, et al.. Aerosol Lidar observations and
model calculations of the Planetary Boundary Layer evolution over Greece, during the March 2006
Total Solar Eclipse. Atmospheric Chemistry and Physics, European Geosciences Union, 2007, 7 (24),
pp.6181-6189. �hal-00296403�
www.atmos-chem-phys.net/7/6181/2007/ © Author(s) 2007. This work is licensed under a Creative Commons License.
Chemistry
and Physics
Aerosol Lidar observations and model calculations of the Planetary
Boundary Layer evolution over Greece, during the March 2006
Total Solar Eclipse
V. Amiridis1, D. Melas2, D. S. Balis2, A. Papayannis3, D. Founda4, E. Katragkou2, E. Giannakaki2, R. E. Mamouri3, E. Gerasopoulos4, and C. Zerefos5
1Institute for Space Applications and Remote Sensing, National Observatory of Athens, Athens 15236, Greece
2Laboratory of Atmospheric Physics, Aristotle University of Thessaloniki, Thessaloniki 54124, Greece
3National Technical University of Athens, Athens 15780, Greece
4Institute for Environmental Research and Sustainable Development, National Observatory of Athens, 15236 Athens, Greece
5Laboratory of Climatology, University of Athens, Athens 15784, Greece
Received: 10 August 2007 – Published in Atmos. Chem. Phys. Discuss.: 14 September 2007 Revised: 26 November 2007 – Accepted: 3 December 2007 – Published: 20 December 2007
Abstract. An investigation of the Planetary Boundary Layer
(PBL) height evolution over Greece, during the solar eclipse of 29 March 2006, is presented. Ground based observa-tions were carried out using lidar detection and ranging de-vices and ground meteorological instruments, to estimate the height of the mixing layer (ML) before, during and after the solar eclipse in northern and southern parts of Greece ex-hibiting different sun obscuration. Data demonstrate that the solar eclipse has induced a decrease of the PBL height, in-dicating a suppression of turbulence activity similar to that during the sunset hours. The changes in PBL height were associated with a very shallow entrainment zone, indicating a significant weakening of the penetrative convection. Heat transfer was confined to a thinner layer above the ground. The thickness of the entrainment zone exhibited its mini-mum during the maximini-mum of the eclipse, demonstrative of turbulence mechanisms suppression at that time. Model es-timations of the PBL evolution were additionally conducted using the Comprehensive Air Quality Model with extensions (CAMx) coupled with the Weather Research and Forecast-ing model (WRF). Model-diagnosed PBL height decrease during the solar eclipse due to vertical transport decay, in agreement with the experimental findings; vertical profiles of atmospheric particles and gaseous species showed an im-portant vertical mixing attenuation.
1 Introduction
Solar eclipses provide a unique opportunity for studying var-ious atmospheric phenomena, when the incoming solar radi-Correspondence to: V. Amiridis
ation is sharply turned off and on during these events. Since Planetary Boundary Layer (PBL) is the region closer to the earth’s surface, where mass, energy and momentum trans-port towards other parts of the atmosphere takes place via turbulence process, a change in the radiative heating or cool-ing will be felt firstly in the PBL before it reaches the free atmosphere.
During a normal day overland, a convective atmospheric boundary layer (CBL) develops, reaching a quasi-steady state in the afternoon, with a mixed layer from the ground up to the interfacial layer with the free atmosphere, a re-gion of strong thermal inversion. Generally, the CBL after-noon/evening transition is marked before sunset by a devel-opment of a surface inversion related to surface cooling. The CBL, often called the residual layer after sunset, becomes neutral above that stable layer. After sunrise, the stable layer is destroyed and a new mixing layer develops. These phe-nomena have been extensively studied experimentally and theoretically in steady state (Stull, 1988), but the evolution during transitions is still not so well known. During a solar eclipse, the two transition situations are reproduced, however with time scales much shorter than those of the normal diur-nal cycle, still providing an excellent chance for investigating the mechanisms driving the PBL evolution.
In the few studies dealing with PBL during solar eclipses, important findings are reported. Antonia et al. (1979), ex-amined the velocity and temperature fluctuations during a solar eclipse (23 October 1976) of 80% totality over Delin-quin, Australia, to determine the Atmospheric Surface Layer (ASL) response on the changes of ground heat-flux. It was found that during the eclipse the surface layer turbulence ap-proximately follows a continuum of equilibrium states in re-sponse to stability changes brought about by the change in
6182 V. Amiridis et al.: Lidar and modeling of the PBL during eclipse 2006, Greece surface heat flux. This point has been also illustrated by
Eaton et al. (1997). The authors showed the eclipse effects on the PBL over a desert site in New Mexico, USA (94% to-tality), using data acquired near the ground and in the surface layer with a frequency-modulated continuous wave (FMCW) radar. They report that during the eclipse maximum, the sen-sible heat-flux and the radiation flux were affected, the tur-bulence was reduced and the air refractive index structure constant decreased dramatically.
Another close study of the PBL dynamics during the 11 August 1999 eclipse was performed with Ul-tra High Frequency Radio Acoustic Sounding System (UHFRASS) radar, sodar and an instrument mast by Girard-Ardhuin et al. (2003). It was found that the eclipse induces a clear response in the atmosphere with a time lag of 15 to 30 min. Boundary Layer experiments conducted over India during the total solar eclipse of 16 February 1980 (Narasimha et al., 1982; Sethuraman, 1982) and also dur-ing the total solar eclipse of 1995 (Arulraj et al., 1998), wit-nessed a decrease in near surface temperature, wind speed and also the changes in atmospheric stability following the solar eclipse.
There are also evidences of oscillations in ASL parame-ters over India (Dolas et al., 2002) following the total eclipse event of 11 August 1999. However, that particular event oc-curred near sunset thus masking the absolute effects of the eclipse on the meteorological variables. The dynamics of the PBL during the solar eclipse of 11 August 1999, over Bulgaria were studied with an aerosol backscatter lidar by Kolev et al. (2005). Data used in this study demonstrate that the solar eclipse affects the meteorological parameters of the atmosphere near the ground, the ozone concentration and the height of the mixing layer. During the period encom-passed by the beginning of the solar eclipse (at 12:36 LT) and its maximum (reached at 14:03 LT), the ML height has in-creased from 1600 m to 1900 m; from 14:03 LT to 15:27 LT when the eclipse ended, the ML height decreased down to 1200 m as a result of the diminished irradiation of the Earth’s surface. This behaviour was followed by another increase in the ML height.
The aim of this paper is to study the PBL height response to the March 2006 solar eclipse, by analysing the aerosol structure of the atmosphere. Two backscatter lidars, as well as additional meteorological surface and vertical profile data (radiosondes) are used to document and analyse the dynamic and thermodynamic response of the lower atmosphere to the sudden change of the incoming solar radiation. For the first time during a solar eclipse, lidar data from two sites (where different meteorological conditions were prevailed) are com-bined for the study of the PBL development. The analysis of the lidar data is complemented by numerical simulations with the CAMx model.
2 Instrumentation and methods
2.1 Lidar systems and methodologies
The lidar system of Aristotle University of Thessaloniki –
AUTH (40.5◦N, 22.9◦E), is designed to perform
contin-uous measurements of suspended aerosols particles in the
PBL and the lower free troposphere. It is based on the
second and third harmonic frequency of a compact, pulsed Nd:YAG laser, emitting simultaneously pulses of 120 and 150 mJ output energy at 355 and 532 nm, respectively, with a 10 Hz repetition rate. The receiving telescope has a pri-mary diameter of 500 mm and an equivalent focal length of 5000 mm. Photomultiplier tubes (PMTs) are used to detect the received lidar signals in the analog and the photon count-ing mode, with a correspondcount-ing raw range resolution of 7.5 m (Balis et al., 2000; Amiridis et al., 2005).
The lidar system of National Technical University of
Athens – NTUA (37.9◦N, 23.8◦E), is also based on the
second and third harmonic frequency of a compact pulsed Nd:YAG laser, which emits simultaneously pulses of 80 and 130 mJ output energy at 355 and 532 nm, respectively, with a 10 Hz repetition rate. The optical receiver is a Cassegrainian reflecting telescope with a primary mirror of 300 mm di-ameter and a focal length of 600 mm, directly coupled, through an optical fiber, to the lidar signal detection box (Papayannis and Chourdakis, 2002). The detectors are oper-ated both in the analog and photon-counting mode and the spatial raw resolution of the detected signals is 15 m.
Both lidar systems are equipped with a Raman
chan-nel working at 387 nm (atmospheric N2 channel) for
night-time operation. The lidar systems of AUTH
and NTUA operate within EARLINET project (European Aerosol Lidar Network) since 2000 and both operation and the algorithms implemented were successfully inter-compared with other EARLINET lidar systems as reported by Matthias et al. (2004); Boeckmann et al. (2004) and Pappalardo et al. (2004).
Averaging time of the lidar profiles during the March 2006 solar eclipse case, was of the order of 3 min for Thessaloniki and 1 min for Athens, corresponding to 2000 and 1000 laser shots, respectively. The final spatial resolution of the range-squared-corrected signal (RSCS) at both stations was 15 m. The determination of the ML height distribution by lidar dur-ing the eclipse is the first step in our analysis. In general, the optical power measured by a lidar system is proportional to the signal backscattered by particles and molecules present in the atmosphere. Using aerosol particles as a tracer, one can determine the top of the ML as the height where the li-dar signal profile exhibits a discontinuity between the mixed layer and free troposphere. The method used to retrieve the ML height in this study is based on the detection of the drop off in the RSCS signals at the interface between the free tro-posphere and the mixed layer.
Following the methods analytically presented by Menut et al. (1999) and Flamant et al. (1997), we have used the minimum value of the filtered first order derivative of averaged RSCS profiles with respect to the altitude to define the top of the mixed layer, which coincides with the base of the entrainment zone. The depth of the entrainment zone is defined here as the height difference between the derivative minimum and the lowest data point defined by
that negative peak (Flamant et al., 1997). The gradient
method can be quite complicated because the minimum cannot be well defined or several minima might exist over an extended height range. Therefore, one should also study, simultaneously, the temporal distribution of the aerosol layers and of the altitude of the minima.
2.2 Modeling
The regional air quality model simulations were performed with the Comprehensive Air quality Model with extensions (CAMx) version 4.40. Within the scope of this campaign, CAMx ran with coarse grid spacing over Greece, in a spatial resolution of 10×10 km and two fine nests with higher reso-lution (2×2 km) over Greater Athens and Thessaloniki area, respectively. The domain’s vertical profile contained 15 lay-ers of varying thickness. Layer 1 was 22 m deep and sub-sequent layer depths increased with height. The uppermost layer was 1.5 km thick and extended to about 8 km. The me-teorological fields were derived from the Weather Research and Forecasting (WRF version 2.1.2) Model, developed at the National Center for Atmospheric Research (NCAR), op-erated by the University Corporation for Atmospheric Re-search (UCAR). The first model domain covered the Balkan area (55×55 grid points with 30 km resolution), the sec-ond domain covered Greece (nested domain with 121×121 grid points and 10 km resolution) and the two domains with finer resolution (2x2 km) covered the two measuring sites (Athens; Thessaloniki). The vertical profile contained 31 vertical layers extending to 18.5 km.
Anthropogenic and biogenic emissions were compiled for a coarse master domain covering Greece (98×108 cells, 10×10 km) and for the two nested grids with finer resolution (2×2 km). Emission data for gaseous pollutants (NMVOC, NOx, CO, SO2, NH3)and particulate matter (PM10)were
es-timated for different anthropogenic emission source sectors such as the transport, power plants, the industrial and the cen-tral heating sector. Anthropogenic emissions of the neigh-bouring countries (Albania, Bulgaria, Turkey) were taken from the EMEP emission database. Diurnal biogenic emis-sions for Greece and neighbouring countries were calculated for every month of the year following the EMEP/CORINAIR
methodology (Poupkou et al., 2004). All emissions are
ejected in the first model level.
Three days of simulation were regarded as “spin-up” time (26–28 March 2006) in order to eliminate the effect of initial conditions. Initial and boundary conditions corresponded to
concentrations of clean air. The chemistry mechanism in-voked was Carbon Bond version 4 (CB4). Photolysis rates were derived for each grid cell as a function of five parame-ters: solar zenith angle, altitude, total ozone column, surface albedo, and atmospheric turbidity. Both meteorological and chemical models have been modified accordingly to repro-duce the eclipse event (for more details see Founda et al., 2007; Zanis et al., 2007). In order to account for the photo-chemical changes of the atmosphere during the eclipse, pho-tolysis rates in the chemical model were adjusted during the period 09:30–12:00 UTC using a space- and time-dependent factor. Thermodynamic changes were introduced into the chemical model with a set of eclipse-affected meteorologi-cal input.
3 Results and discussion
With the objective of studying the changes in the PBL struc-ture due to the sudden attenuation of radiation, field exper-iments were conducted over Athens and Thessaloniki close to the totality path of the solar eclipse of 29 March 2006. During the solar eclipse, Athens and Thessaloniki experi-enced 84% and 74% obscuration, respectively. The partial eclipse for both sites took place between 09:36–12:04 UTC, with the maximum phase occurring at 10:50 UTC. A general description of the field experiments and the lo-cal eclipse circumstances over Greece can be found in (Gerasopoulos et al., 2007).
3.1 Lidar measurements
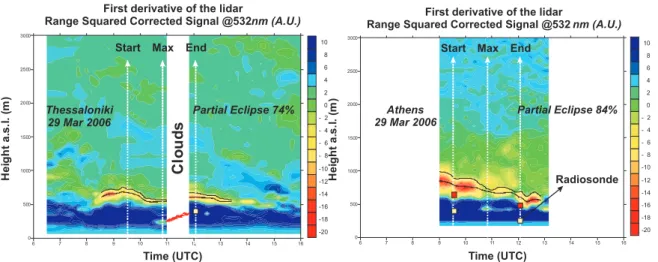
Figure 1 presents the time cross-section of the first deriva-tive of the RSCS at 532 nm, measured by the backscatter li-dars in Thessaloniki (a) and Athens (b) on 29 March 2006. In Fig. 1a, the evolution of the ML height along with the thickness of the entrainment zone is shown for Thessaloniki. In the morning and until 09:30 UTC when the eclipse be-gan, the height of the ML in Thessaloniki grew up to about 700 m. ML heights below 400 m would not been detected by AUTH’s lidar due to laser beam and telescope field-of-view overlap limitations (Balis et al., 2002). Between first con-tact (09:36 UTC) and maximum of the eclipse (10:50 UTC), 74% obscuration), the ML height declined to about 550 m. At 11:00 UTC low clouds were formed over Thessaloniki at an altitude of approximately 250 m and remained until 11:50 UTC, inhibiting aerosol lidar measurements. During this period, the lidar retrieved cloud base height is presented in Fig. 1a. After 11:50 UTC, the ML height was measured at 600 m and remained at this altitude until 12:50 UTC, fol-lowed by a small fall of 50 m between 12:50 and 13:20 UTC. During the above time periods, the upper boundary of the entrainment zone exhibits similar behaviour. The entrain-ment zone thickness ranged between 80 m and a minimum of 20 m during the total phase. This indicates a significant
6184 V. Amiridis et al.: Lidar and modeling of the PBL during eclipse 2006, Greece 6 7 8 9 10 11 13 14 15 16 0 -20 -18 -16 -14 -12 -10 - 8 - 6 - 4 - 2 0 2 4 6 8 10 500 1000 1500 2000 2500 3000
Start Max End
First derivative of the lidar
Range Squared Corrected Signal @532nm (A.U.)
H ei g h t a. s. l. (m ) 12 Thessaloniki 29 Mar 2006 C lou ds Partial Eclipse 74% Time (UTC) 6 7 8 9 10 11 12 13 14 15 16 0 500 1000 1500 2000 2500 3000 -20 -18 -16 -14 -12 -10 - 8 - 6 - 4 - 2 0 2 4 6 8 10 Time (UTC) H ei g h t a. s. l. (m ) Athens 29 Mar 2006 Radiosonde
Start Max End
Partial Eclipse 84% First derivative of the lidar
Range Squared Corrected Signal @532 nm (A.U.)
Fig. 1. Time-height cross section of the first derivative of the range squared corrected lidar signal at 532 nm (in arbitrary units – A.U.) at
Thessaloniki (a) and Athens (b) measured on 29 March 2006. The upper and lower limits of the entrainment zone are demonstrated with the thin and bold solid line, respectively, the latter representing the evolution of the ML height. Red triangles correspond to lidar retrieved cloud base height. Squares represent PBL heights calculated from radiosonde meteorological profiles.
weakening of the penetrative convection, induced by the solar eclipse. After the end of the eclipse, entrainment zone thickness reached an almost constant value of 60 m.
In Fig. 1b, the evolution of the ML height over Athens is shown. In this case measurements were performed within the time interval 09:00–13:10 UTC (84% sun obscuration). ML heights below 250 m would not been detected by NTUA’s lidar due to laser beam and telescope field-of-view overlap limitations (Chourdakis et al., 2002). At the beginning of the phenomenon, the ML height over Athens was found at 800 m and the entrainment zone had a thickness of 100 m. After a constant fall between 09:30 and 10:50 UTC, the ML height reaches a value of 700 m at the maximum of the eclipse, while the thickness of the entrainment zone exhibits its min-imum value of 30 m. From 10:50 to 12:04 UTC (end of eclipse), the ML height continued to fall, reaching a value of 620 m, while the entrainment zone thickness increased to 60 m.
3.2 Discussion of the PBL evolution from lidar and
meteo-rological measurements
The PBL generally forms due to heating of the Earth’s sur-face. During the solar eclipse the gradual decrease of the Sun’s radiation influences the surface heat fluxes and the boundary layer temperatures. In order to explain the evo-lution of the ML height as revealed by lidar measurements, we present time-series of the measured surface wind speed and air temperature at Thessaloniki (a) and Athens (b),
re-spectively (Fig. 2). Figure 2a shows that relatively low
wind-speed values prevailed during the hours preceding the eclipse. At Athens, the surface wind speed ranged between
2–6 m s−1while at Thessaloniki between 0.5–2.5 m s−1. A
further decrease of wind speed near mid–eclipse is observed
at both sites, retaining low values until the end of the event and recovering after. At the same time, temperatures gradu-ally fell with the evolution of the event and rose again dur-ing the recovery phase (Fig. 2b). In particular, at
Thessa-loniki, the surface temperature decreased by about 4◦C
be-tween the first contact and the maximum of the eclipse, while for Athens the corresponding temperature fall was in the or-der of 2.5◦C (Founda et al., 2007).
Additional meteorological measurements, namely analyt-ical radiosonde data of potential temperature, relative hu-midity (RH) and wind speed with a vertical resolution of approximately 5 m are presented in Fig. 3. The radiosonde data from the Macedonia Airport of Thessaloniki launched at 11:55 UTC (Fig. 3a), indicate humid conditions with RH between 80–90% inside the PBL. The PBL height is esti-mated from the potential temperature profile, which indicates a clear inversion at 350 m, coinciding with an inflection point in the profile of the relative humidity. The wind-speed pro-file (Fig. 3a) shows weak winds inside the PBL, in the range
2.5–4.5 m s−1. Radiosonde data available at Athens at 09:38
and 12:03 UTC (Fig. 3b) indicate less humid conditions, with RH lower than 60% up to 1000 m. Launching times coincide with the start and the end of the eclipse. PBL heights cal-culated by the potential temperature profiles were approxi-mately 400 and 220 m at 09:38 and 12:03 UTC respectively. The PBL heights over Thessaloniki and Athens derived from the radiosondes profiles are also presented in Fig. 1. Radiosonde measurements in Athens were performed at Ellinikon Airport, located nearby the coast of the city and at a distance of 11.3 km from the lidar station (220 m a.s.l.), thus not being representative for Athens case. For this rea-son, the PBL height that one should expect for Athens lidar station is also represented by red squares in Fig. 1b. This
0 1 2 3 4 5 6 7 8 W ind S pee d (m /s ec ) Thessaloniki Athens 06:00 07:00 08:00 09:00 10:00 11:00 12:00 13:00 14:00 15:00 16:00 Time (UTC) 06:00 07:00 08:00 09:00 10:00 11:00 12:00 13:00 14:00 15:00 16:00 10 12 14 16 18 20 22 T e m pe rat ur e ( 0 C) Time (UTC) 24 Thessaloniki Athens
Fig. 2. Surface wind speed (a) and temperature (b) timeseries for Thessaloniki (black dotted line) and Athens (red dotted line).
PBL height is estimated by the radiosonde profile plus 220 m, since the relatively gentle slope of the topographic surface is expected to displace upwards the boundary layer (Stull, 1988). In order to explain the evolution of the ML height as this was followed by lidar measurements, we will analyse the lidar estimates in conjunction with the meteorological obser-vations for both sites. At Thessaloniki, the almost clear sky conditions and low wind-speed values (Fig. 2a, squares) pre-vailing during the pre-eclipse hours, are expected to lead to free convective conditions. Since the beginning of the eclipse occurred almost at local noon, a well mixed layer is expected to have formed by that time. After the first contact, incoming solar radiation progressively decreases and so does surface temperature, although with some delay due to thermal inertia of the atmosphere-land-sea system. As already mentioned, the amplitude of temperature drop at Thessaloniki was about
4.0◦C while the minimum temperature occurred 12 min after
the total phase of the eclipse (Founda et al., 2007). Accord-ing to the lidar signal (Fig. 1a), at the beginnAccord-ing of the event, the convective mixed layer extends up to ∼700 m a.s.l. at Thessaloniki area. At the early stages of the eclipse, radia-tive cooling starts to take place near the surface in a similar way that surface cools after sunset. At that time the atmo-sphere is still mixed and temperature deficit extends from the surface at higher levels throughout the whole boundary layer due to turbulence mixing, resulting to the decrease of the ML height (Vogel et al., 2001). As evident from the lidar signal (Fig. 1a) at 10:15 UTC the ML height has decreased by about 200 m. As eclipse approaches to the maximum phase, a pronounced temperature deficit is observed (Fig. 2b) and stable stratification is reached near the surface. Con-vectional mechanism is expected to weaken and eventually break down and heat transfer is confined to a thinner layer above ground. Aerosol tracers injected in the atmosphere are now dispersed between the surface and the new temperature inversion height (200 m). Due to the stabilization of the air at lower levels and the suppression of turbulent mechanisms, the conditions at higher levels remain relatively unchanged and this is also exhibited clearly in Fig. 1a, where the struc-ture of the initial mixed layer remains almost unaltered after 10:20 UTC. This behaviour resembles the one observed dur-ing night-time where the so called Residual Layer coexists
0 100 200 300 400 500 600 700 800 900 1000 285 290 295 40 50 60 70 80 90 1 2 3 4 5 6 7 8 9 10 0 100 200 300 400 500 600 700 800 900 1000 Potential Temperature (0K) H ei ght (m -a. s .l. ) Relative Humidity (%) Wind Speed (m/sec) PBL height Radiosonde - Thessaloniki 29 Mar 2006, 11:55 UTC
0 100 200 300 400 500 600 700 800 900 0 100 200 300 400 500 600 700 800 900 H e ig h t (m -a .s .l .) PBL height Radiosonde - Athens 29 Mar 2006, (i) 09:38 UTC, (ii) 12:03 UTC
0 100 200 300 400 500 600 700 800 900 285 290 295 40 50 60 70 80 90 1 2 3 4 5 6 7 8 9 10 0 100 200 300 400 500 600 700 800 900 Potential Temperature (0 K) H e ig h t (m -a .s .l.) Relative Humidity (%) PBL height Wind Speed (m/sec) 1000 1000 (i) (ii)
Fig. 3. Potential Temperature, relative humidity and wind speed
measured with radiosondes on 29 March 2006, at 11:55 UTC for Thessaloniki (a) and at 09:38 UTC (b-top panel-i) and 12:03 UTC for Athens (b-bottom panel-ii).
6186 V. Amiridis et al.: Lidar and modeling of the PBL during eclipse 2006, Greece
Eclipse No Eclipse
Fig. 4. PBL height as diagnosed by CAMx for Thessaloniki and
Athens. Dashed lines correspond to control runs without eclipse.
with the nocturnal boundary layer.
Another important observation that supports our argu-ments is the variation of the amplitude of the entrainment zone. It is obvious from Fig. 1a that the thickness of this zone is reduced near the maximum phase of the eclipse, indicating the suppression of turbulence mechanisms and the weaken-ing of the penetrative convection at that time. The weakenweaken-ing of the mixing processes due to the cooling of the atmosphere is also reflected in the surface wind speed (Fig. 2a) which de-creases near mid-eclipse and retains low values until the end of the event. Between 11:00 and 11:50 UTC when clouds were observed over Thessaloniki, one can see in Fig. 1a (red triangles) that the lidar retrieved cloud base height shows a positive trend. According to Stull (1988), in presence of clouds, the PBL height is defined as the cloud base height. After 11:00 UTC surface air temperature starts to recover (Fig. 2b) although it does not recover to its pre-eclipse value, mainly due to the time of the day and the increased cloud cover. We indicate that for the time period between 11:00 and 11:50 UTC, the height of the inversion base is increasing due to the surface temperature recovery and this argument is supported by the height of the layer at 200 m on 11:00 UTC, followed by the increase of the cloud base height. According to radiosonde data at 11:55 UTC (Fig. 3a), the structure of the upper part of the PBL indicates a slight stability, however it is expected that eddies transfer heat and momentum, mixing again the boundary layer. After 11:50 UTC when the eclipse approximately ended, the ML height was found at 600 m and that height was approximately retained until 12:50 UTC.
The effect of the thermal inertia of the atmosphere-land-sea system in surface temperature response due to the eclipse seems to be more pronounced in Athens area. According to observations performed in the centre of Athens (Fig. 2b), surface air temperature at 1.5 m a.s.l. retained its
increas-ing march after the beginnincreas-ing of the event, while the time shift of temperature drop from the first contact was of the or-der of 30 min (Founda et al., 2007). This is partly attributed to the higher (compared to Thessaloniki) wind speeds which prevailed in Athens (Fig. 2a) area resulting to the mixing of the air and other local factors, like cloudiness that preceded the eclipse (Founda et al., 2007). High values of incoming short wave radiation and moderate wind speeds in Athens contributed to the formation of a well mixed boundary layer by the beginning of the event, as is also evident from ra-diosonde data at 09:38 UTC (Fig. 3b, i). According to the lidar signal (Fig. 1b) the mixed layer extends up to the height of 800 m a.s.l. at 09:30 UTC. The delay in surface air cool-ing observed in Athens area is reflected to the height of the mixed layer which decreases at a slower rate compared to Thessaloniki for about one hour after the first contact as ev-ident in Fig. 1b. Then the height of the mixed layer starts to decrease faster for the reasons already explained in Thessa-loniki case. The formation of a lower stable layer extending from the ground to the height of 410 m is also observed in Athens for a short period near the maximum phase of the eclipse.
The smaller amplitude of temperature drop and higher sur-face wind speeds in Athens have possibly contributed to less stable (compared to Thessaloniki) atmospheric conditions near the surface. This is also supported from the radiosonde data at the two sites near the end of the eclipse in Fig. 3a and 3b-ii. The potential temperature gradient in the layers 23–220 m at Athens and 23–350 m at Thessaloniki were 0.6 and 0.8◦C/100 m respectively, suggesting greater stability at
Thessaloniki. Under these conditions surface temperature deficit is transferred at higher levels resulting to the cooling of the entire mixing layer and its depression. Finally, due to thermal inertia of the air and the natural decrease of solar el-evation after the eclipse, mixing layer height does not regain its initial value for Athens.
3.3 Modeling
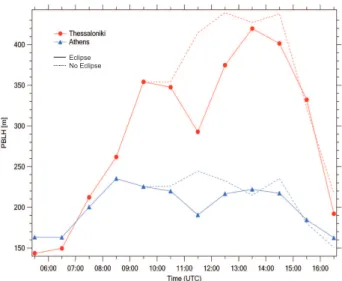
Figure 4 shows the PBL height as diagnosed by CAMx pro-cess analysis in Thessaloniki and Athens (lines with mark-ers). An additional run has been performed in order to simu-late the atmospheric processes without eclipse (dashed lines). At both sites the PBL height is approximately 150 m at 06:00 UTC and gradually increases to reach a maximum four hours later. Normally, the PBL should continue to develop in order to reach its maximum height early afternoon hours as indicated by the dashed lines. However after 09:30 UTC the eclipse starts to affect the PBL height. Due to vertical turbulent mixing decay PBL decreases and reaches a local minimum at around 11:30 UTC i.e. during the eclipse maxi-mum. Two hours later the PBL height has almost fully recov-ered and starts to decrease gradually again after 15:00 UTC
as the sun slowly sets. Interestingly the PBL height in
Thessaloniki is on average higher than in Athens. This is
Thessaloniki - 29 Mar 2006
PM10 ug/m lat=40.63 lon=22.953
1000 900 800 700 600 500 400 300 200 100 06 07 08 09 10 11 12 13 14 15 16 Time (UTC) Height (m) 1.0 1.5 2.0 1.5 3.0 3.5 4.0 4.5 5.0 Athens - 29 Mar 2006
PM10 ug/m lat=37.97 lon=23.783
Height (m) 450 400 350 300 250 200 150 100 50 06 07 08 09 10 11 12 13 14 15 16 Time (UTC) 15 20 25 30 35 40 45 60 80 90 100
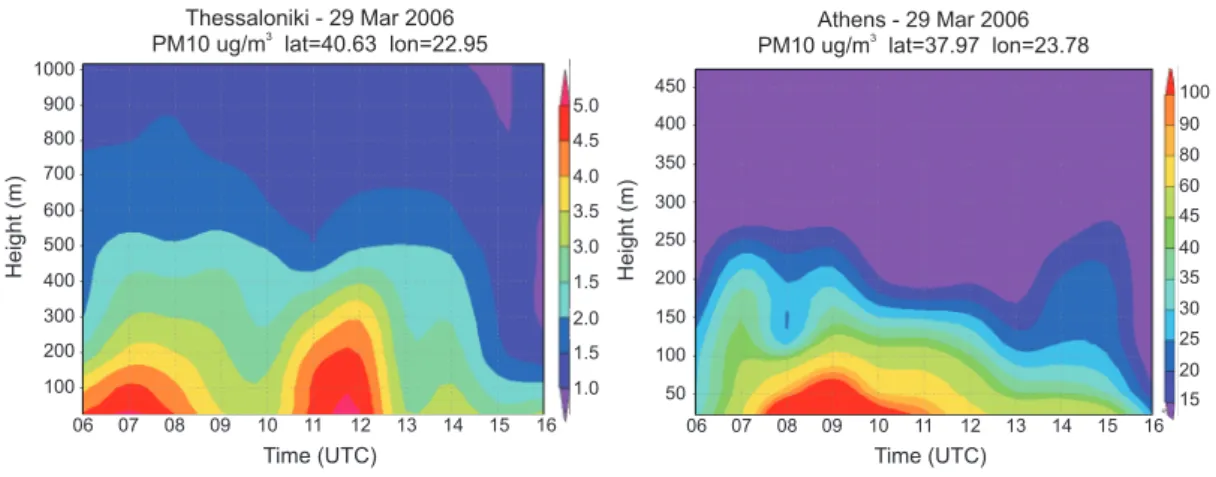
Fig. 5. Time slice of vertical particulate matter (PM) distribution at the two measuring stations, Thessaloniki (top panel) and Athens (bottom
panel).
also supported by the radiosonde measurements which indi-cate that at ∼12:00 UTC the PBL height at Thessaloniki is appreciably higher than the respective over Athens. During sunrise the PBL height in Thessaloniki reaches up to 350 m, while in Athens only to 225 m. During the maximum of the eclipse, the PBL height falls down to 290 m and 190 m in Thessaloniki and Athens, respectively. If the eclipse had not taken place the PBL heights would have reached 440 and 245 m, respectively, during the period 12:00–15:00 UTC.
Another interesting feature giving insight to the PBL evo-lution during the eclipse is the time slice of vertical PM dis-tribution. The vertical profile of PM concentrations is basi-cally dominated by two factors: ground emissions and tur-bulent mixing. As clearly depicted in Fig. 5, emissions in-jected mostly between 06:00–12:00 UTC, control the PM concentration levels in the first 100 m. For altitudes higher than 100 m, vertical mixing is the dominant factor over pol-lutant concentrations. If PM is to be used as a qualitative index of the PBL evolution, it can be noticed that the basic patterns observed in Fig. 4 can be also noted in Fig. 5. After 06:00 UTC particulate matter trapped in lower levels is trans-ported upwards, a clear indication of the PBL expansion. However vertical transport does not appear to evolve undis-turbed by reaching a maximum at early afternoon hours, on the contrary it decays during the eclipse. For a constant alti-tude between 200 and 300 m at both sites, PM concentrations are higher before and after the eclipse and fall somewhat dur-ing the event.
We have to mention that PM10vertical distribution is used
in this paper only as a qualitative index of the evolution of the boundary layer therefore Fig. 5 cannot be used as a quan-titative index of the ML height and thus cannot be directly compared to Lidar ML height measurements. The diagnos-tic calculation of PBL height by CAMx on the other hand (Fig. 4), yields indeed a PBL height which is generally lower than what is measured. According to our findings, a good agreement between lidar measurements and model
estima-tions was found in the overall behavior of the PBL but not in absolute numbers. Possible reason for this discrepancy is that the lidar measures on a spot while the model averages in an
area of 4 km2. Additionally, the model produces only hourly
average data while measurements have a sampling time of few minutes.
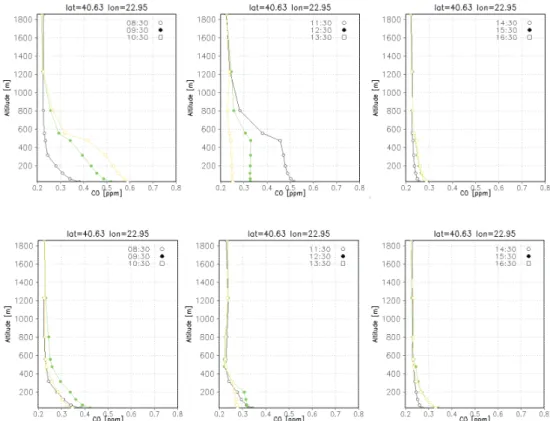
Finally, we use CO as an additional tracer for PBL evolu-tion. In Fig. 6, the evolution of CO vertical profile is shown from 08:30 to 16:30 UTC, for the non-eclipse model run (top panel). During the early morning hours (08:30–10:30 UTC), ground CO concentrations increase in the lower levels with time due to increasing emissions. A negative vertical gradi-ent above indicates that there is not sufficigradi-ent turbulgradi-ent mix-ing yet to homogenize pollutant concentrations. Later, the PBL is gradually developing and reaches up to 450 m un-til 12:30 UTC as indicated by the constant CO mixing ra-tios. The negative gradient remains for altitudes higher than 450 m. It is noticeable that Figs. 4 and 6 compare well con-cerning the PBL height which is derived with two different methods: CAMx diagnosed and indirectly using CO as a tracer of the PBL evolution. For the three consecutive hours (14:30–16:30 UTC) CO values remain almost unchanged to the whole range of altitude justifying the assumption of a well developed PBL. The bottom panel shows model results, for a run with eclipse parameterizations. Differences are ob-vious during the 2 h span 09:30–11:30 UTC. A negative CO vertical gradient remains until the end of eclipse implying a poorly developed PBL, while the 12:30 UTC curve indicate a homogenized layer that extends only up to 200 m. The com-parisons of CO vertical profiles after 14:30 UTC with eclipse and no-eclipse parameterizations, which are almost identical, imply that after two hours the atmosphere has recovered from the eclipse “disturbance”.
6188 V. Amiridis et al.: Lidar and modeling of the PBL during eclipse 2006, Greece
Fig. 6. Temporal evolution of modeled CO vertical profiles for the eclipse (bottom panel) and non-eclipse case (top panel) for the site in
Thessaloniki.
4 Summary and conclusions
Several effects consistent with the rapid cut-off and turn-on of solar radiation were observed in the planetary boundary layer during the 29 March 2006, solar eclipse at Greece by the use of lidar backscatter methods. As expected, the eclipse primarily influenced the surface meteorological parameters. However, from the lidar data presented here, it becomes clear that the influence of the eclipse is extended up to the height of the mixing layer. The thickness of the entrainment zone exhibits its minimum during the maximum of the eclipse in-dicating the suppression of turbulence mechanisms at that time. A ground layer with height of 200 m for Thessaloniki and 410 m for Athens was formed around the maximum of the eclipse due to the stabilization of the air at lower levels. The elevated temperature inversion was responsible for the suppression of convectional mixing and the formation of a residual aerosol layer for Thessaloniki, where the inversion was stronger.
In this study we used both CO and PM as tracers for the PBL height. In order to further investigate the eclipse ef-fects on the atmospheric dynamics, a second run was per-formed, without introducing the eclipse parameterizations. The results exhibit clear differences in PBL height and struc-ture for both Athens and Thessaloniki. Model diagnosed PBL height decrease during the solar eclipse due to vertical
transport decay, in agreement with the experimental findings. Moreover, the vertical profiles of atmospheric particles and gaseous species showed vertical mixing attenuation. Acknowledgements. EG and RM acknowledge the support of the
PENED 2003 project. The project is co-financed 75% of public expenditure through EC – European Social Fund and 25% of public expenditure through Ministry of Development, General Secretariat of Research and development (Project 03-ED-169) and through private sector (Raymetrics SA.), under Measure 8.3 of OPERATIONAL PROGRAMME “COMPETITIVENESS” in the 3rd Community Support Programme. Radiosonde data were provided by the Hellenic Meteorological Service (HNMS). Meteorological surface measurements were kindly provided by T. Karacostas (Department of Meteorology – Aristotle University of Thessaloniki). AM acknowledges S. Kazadzis for the helpful conversation regarding radiation issues.
Edited by: N. Mihalopoulos
References
Amiridis, V., Balis, D. S., Kazadzis, S., Bais, A., Giannakaki, E., Papayannis, A., and Zerefos, C.: Four-year aerosol observations with a Raman lidar at Thessaloniki, Greece, in the framework of European Aerosol Research Lidar Network (EARLINET), J. Geophys. Res., 110, D21203, doi:10.1029/2005JD006190, 2005.
Antonia, R. A., Chambers, A. J., Phong-Anant, D., Rajagopalan, S., and Sreenivasan, K. R.: Response of atmospheric surface layer turbulence to a partial solar eclipse, J. Geophys. Res., 4, 1689– 1692, 1979.
Arulraj, S., Dharmaraj, T., Debaje, S. B., Badgavanth Singh, A., and Vernekar, K. G.: The dynamics of the surface layer during total solar eclipse 1995, Mausam, 49, 475–480, 1998.
Balis, D., Amiridis, V., Zerefos, C., and Papayannis, A.: Verifica-tion of the experimental determinaVerifica-tion of the lidar overlap pro-file by a Raman lidar, Lidar Remote Sensing in Atmospheric and Earth Sciences, 21th International Laser Radar Conference (ILRC21), 125–128, 2002.
Balis, D., Papayannis, A., Galani, E., Marenco, F., Santacesaria, V., Hamonou, E., Chazette, P., Ziomas, I., and Zerefos, C.: Tropo-spheric LIDAR aerosol measurements and sun photometric ob-servations at Thessaloniki, Greece, Atmos. Environ., 34, 925– 932, 2000.
B¨ockmann, C., Wandinger, U., Ansmann, A., B¨osenberg, J., Amiridis, V., Boselli, A., Delaval, A., De Tomasi, F., Frioud, M., Grigorov, I., Hagard, A., Horvat, M., Iarlori, M., Komguem, L., Kreipl, S., Larcheveque, G., Matthias, V., Papayannis, A., Pappalardo, G., Rocadenbosch, F., Rodrigues, J. A., Schneider, J., Shcherbakov, V., and Wiegner, M.: Aerosol lidar intercom-parison in the framework of the EARLINET project: Part II – Aerosol backscatter algorithms, Appl. Opt., 43, 977–989, 2004. Chourdakis, G., Papayannis, A., and Porteneuve, J.: Analysis of the
receiver response for a noncoaxial lidar system with fiber-optic output, Appl. Opt., 41, 2715–2723, 2002.
Dolas, P. M., Ramachandran, R., Sen, Gupta, K., Patil, S. M., and Jadhav, P. N.: Atmospheric surface layer processes during the total solar eclipse of 11 August 1999, Boundary Layer Meteorol., 104, 445–461, 2002.
Eaton, F. D., Hines, J. R. , Hatch, W. H., Cionco, R. M., Byers, J., and Garvey, D.: Solar eclipse effects observed in the plan-etary boundary layer over a desert, Boundary Layer Meteorol., 83, 331–346, 1997.
Flamant, C., Pelon, J., Flamant, P., and Durand, P.: Lidar determi-nation of the entrainment zone thickness at the top of the unstable marine atmospheric boundary layer, Boundary Layer Meteorol., 83, 247–284, 1997.
Founda, D., Melas, D., Lykoudis, S., Lisaridis, I., Gerasopoulos, E., Kouvarakis, G., Petrakis, M., and Zerefos, C.: The effect of the total solar eclipse of 29 March 2006 on meteorological variables in Greece, Atmos. Chem. Phys. Discuss., 7, 10 631–10 667, 2007 Gerasopoulos, E., Zerefos, C. S., Tsagouri, I., et al.: The Total Solar Eclipse of March 2006: Overview, Atmos. Chem. Phys. Discuss., 7, 17 663–17 704, 2007.
Girard-Ardhuin, F., B´enech, B., Campistron, B., Dessens, J., and Jacoby-Koaly, S.: Remote Sensing and surface observations of the response of the Atmospheric Boundary Layer to a Solar Eclipse, Boundary Layer Meteorol., 106, 93–115, 2003. Kolev, N., Tatarov, B., Grigorieva, V., Donev, E., Simenonov, P.,
Umlensky, V., Kaprielov, B., and Kolev, I.: Aerosol Lidar and in situ ozone observations of the planetary boundary layer over Bul-garia during the solar eclipse of 11 August 1999, Int. J. Remote Sens., 26, 3567–3584, 2005
Matthias, V., Freudenthaler, V., Amodeo, A., Balin, I., Balis, D., B¨osenberg, J., Chaikovsky, A., Chourdakis, G., Comeron, A., Delaval, A., De Tomasi, F., Eixmann, R., H˚ag˚ard, A., Komguem, L., Kreipl, S., Matthey, R., Rizi, V., Rodrigues, J. A., Wandinger, U., and Wang, X.: Aerosol Lidar Intercomparison in the Frame-work of the EARLINET Project. 1. Instruments, Appl. Opt., 43, 961–976, 2004.
Menut, L., Flamant, C., Pelon, J., and Flamant, P.: Urban bound-ary layer height determination from lidar measurements over the Paris area, Appl. Opt., 38, 945–954, 1999.
Narasimha, R., Prabhu, A., Narahari Rao, K., and Prasad, C. R.: Atmospheric Boundary Layer Experiment, Proc. of INSA Bull., 48, 175–186, 1982.
Papayannis, A. and Chourdakis, G.: The EOLE project: a mul-tiwavelength laser remote sensing (lidar) system for ozone and aerosol measurements in the troposphere and the lower strato-sphere. Part II: Aerosol measurements over Athens, Greece, In-ter. J. Rem. Sens., 23, 179–196, 2002.
Pappalardo, P., Amodeo, A., Wandinger, U., Matthias, V., B¨osenberg, J., Alpers, M., Amiridis, V., de Tomasi, F., Frioux, M., Iarlori, M., Komguen, L., Larcheveque, G., Papayannis, A., Schumacher, R., and Wang, X.: Aerosol lidar intercomparison in the framework of the EARLINET project. 3. Raman lidar al-gorithm for aerosol extinction, backscatter and lidar ratio, Appl. Opt., 43, 5370–5385, 2004.
Poupkou, A., Symeonidis, P., Lisaridis, I., Pouspourika, E., Yay, O. D., Melas, D., Ziomas, I., Balis, D., and Zerefos, C.: Com-pilation of an emission inventory for the purpose of studying the regional photochemical pollution in the Balkan Region, Pro-ceedings of the Quadrennial Ozone Symposium 2004, 902–903, 2004.
Sethuraman, S.: Dynamics of the atmospheric boundary layer dur-ing the 1980 total solar eclipse, Proceeddur-ings of INSA, 48, 187– 195, 1982.
Stull, R. B.: An Introduction to Boundary Layer Meteorol-ogy, Kluwer Academic Publishers, Dordrecht, The Netherlands, 1988.
Vogel, B., Baldauf, M., and Fielder, F.: The influence of a solar eclipse on temperature and wind in the Upper-Rhine Valley – A numerical case study, Meteorol. Z., 10, 207–214, 2001. Zanis, P., Katragkou, E., Kanakidou, M., Psiloglou, B.,
Karathana-sis, S., VrekousKarathana-sis, M., Gerasopoulos, E., Lysaridis, I., Markakis, K., Poupkou, A., Amiridis, V., Melas, D., Mihalopoulos, N., and Zerefos, C.: Effects on surface atmospheric photo-oxidants over Greece during the total solar eclipse event of 29 March 2006, Atmos. Chem. Phys. Discuss., 7, 11 399–11 428, 2007.