HAL Id: hal-00304617
https://hal.archives-ouvertes.fr/hal-00304617
Submitted on 1 Jan 2001HAL is a multi-disciplinary open access archive for the deposit and dissemination of sci-entific research documents, whether they are pub-lished or not. The documents may come from teaching and research institutions in France or abroad, or from public or private research centers.
L’archive ouverte pluridisciplinaire HAL, est destinée au dépôt et à la diffusion de documents scientifiques de niveau recherche, publiés ou non, émanant des établissements d’enseignement et de recherche français ou étrangers, des laboratoires publics ou privés.
Waters Monitoring Network, 1988-2000: Evidence for
recent recovery at a national scale
C. D. Evans, D. T. Monteith
To cite this version:
C. D. Evans, D. T. Monteith. Chemical trends at lakes and streams in the UK Acid Waters Monitoring Network, 1988-2000: Evidence for recent recovery at a national scale. Hydrology and Earth System Sciences Discussions, European Geosciences Union, 2001, 5 (3), pp.351-366. �hal-00304617�
Chemical trends at lakes and streams in the UK Acid Waters
Monitoring Network, 1988-2000:
Evidence for recent recovery at a national scale
C.D. Evans
1and D.T. Monteith
21 Centre for Ecology and Hydrology. Wallingford, Oxon., OX10 8BB, UK
2 Environmental Change Research Centre, University College London, 26 Bedford Way, London, WC1H 0AP, UK
Email for corresponding author: cev@ceh.ac.uk
Abstract
A detailed trend analysis of 12 years of data (1988-2000) for 22 surface waters in acid-sensitive regions of the United Kingdom, in which individual site data have been combined to identify national-scale trends, has shown strong common patterns of temporal variation. Results suggest a widespread reduction in sulphate concentrations, hydrogen ion and inorganic aluminium species, and increases in acid neutralising capacity. Many chemical changes have not been linear. However, the first five years were characterised by high concentrations of marine ions and relatively stable pollutant sulphate concentrations and the remaining period by lower concentrations of marine ions and declining sulphate. Genuine ‘recovery’, in terms of declining acidity in response to reduced anthropogenic sulphur deposition is only apparent, therefore, for the latter part of the monitoring period. Reductions in calcium concentrations appear to have partially offset the influence of sulphate reductions on acidity, as have increases in organic acidity associated with strong and widespread rising trends in dissolved organic carbon. Fluctuations in a number of climatic factors over the monitoring period have led to significant inter-annual variability in nitrate, which exhibits little long-term trend, marine ions and acidity, emphasising the need for long monitoring periods if underlying trends are to be correctly identified. Keywords: acidification, recovery, long-term trends, climate, Dissolved Organic Carbon, United Kingdom Acid Waters Monitoring Network
Introduction
Acidification of soils and waters results from the emission, transportation and deposition of sulphur (S) and nitrogen (N) compounds, primarily from fossil fuel burning. Detrimental effects of ‘acid rain’ were first documented in the Pennines, Northern England, following the onset of industrialisation during the mid-19th century and have since
been observed across many areas of the UK. The analysis of diatom fossils in lake sediment cores has provided evidence of long-term freshwater acidification, with a progressive change from acid-sensitive to acid-tolerant species over the last 150 years (Battarbee et al., 1988). UK (S) emissions peaked during the 1970s and have since declined in response to changes in the industrial sector and to a series of emission control agreements, most recently the Multi-Pollutant Multi-Effect Protocol, signed in
Gothenburg in 1999. As a result, UK S emissions are now around 75% lower than their 1970s peak, whilst nitrogen oxide (NOx) emissions have fallen by around 30%, primarily since 1990, and reduced nitrogen (NHy) emissions (mainly from agriculture) have remained approximately constant (NEGTAP, 2001).
High quality monitoring of impacted ecosystems is vital to determine whether reductions in the emissions of acidifying pollutants are leading to the desired improvements in the water quality of damaged systems and also to develop the scientific understanding and predictive models used to support decision making on future emissions reductions. In the UK, monitoring during the 1970s and early 1980s was limited to local programmes in a few areas (e.g. Harriman et al., 2001; Helliwell et al., 2001). Co-ordinated national monitoring began in 1988 with the establishment of the UK
Acid Waters Monitoring Network (AWMN) (Patrick et al., 1995), which provides a regular and controlled programme of chemical, biological and hydrological measurements across a representative range of 22 acid-sensitive waters. A recent report (Monteith and Evans, 2000) presented a detailed analysis of long-term trends over the first ten years of monitoring. During this period, relatively few sites exhibited clear signs of chemical recovery due to a number of factors. Firstly, it appeared that more remote western areas of the UK, where most sites are located, had experienced smaller reductions in S deposition than southern and eastern areas closer to emissions sources. Secondly, the monitoring period coincided with a period of major climatic variation linked to the North Atlantic Oscillation (NAO), an approximately decadal cycle influencing winter weather patterns in the UK (Hurrell, 1995). Warm, stormy winters in the early part of the record led to a combination of increased rainfall and marine ion deposition, and, therefore, to elevated concentrations of sodium (Na), chloride (Cl) and the marine component of sulphate (SO4) at this time. A combination of dilution by high rainfall, and the displacement of hydrogen (H) and aluminium (Al) from soil exchange sites by marine base cations (the ‘sea-salt effect’; Wright et al., 1988; Langan, 1989) also led to naturally acid conditions during this period (Evans et al., 2001a). Cold winters, particularly that of 1995/96, are thought to have increased nitrate (NO3) losses from catchment soils (Monteith et al., 2000), again obscuring the link between anthropogenic deposition inputs and runoff chemistry.
Two additional years of data (April 1998 – March 2000) were included in an analysis of temporal changes at a subset of six unforested mountain lakes in the AWMN by Evans and Monteith (2001). These lakes, with relatively stable short-term chemistry and minimal local influences, were considered most likely to show clear responses to anthropogenic deposition reductions and/or longer-term climatic changes. Results showed that the six lakes exhibited similar chemical changes over time and suggested that anthropogenic SO4 concentrations have begun to fall in recent years. For the present study, the analysis of trends over the 12 year period, and the techniques developed for the analysis of mountain lake sites, are extended to all lakes and streams in the AWMN. The aims of this analysis are: (a) to determine whether the apparent onset of chemical recovery observed at a subset of lakes has occurred elsewhere in the network; (b) to identify the extent to which patterns of temporal change are consistent at the national scale; and (c) to consider the extent to which chemical changes in other solutes have either reduced or obscured recovery from acidification in response to falling S deposition.
Study sites
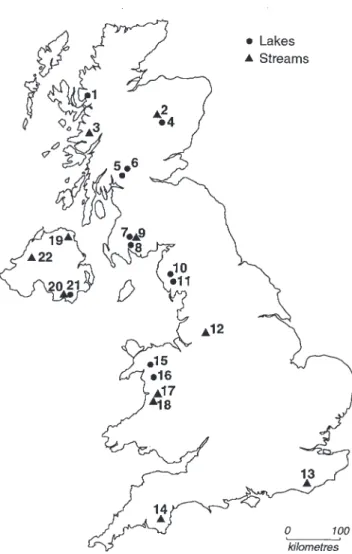
The AWMN consists of 11 lakes and 11 streams in Scotland, England, Wales and Northern Ireland. The majority are located in western and northern areas, reflecting the distribution of acid-sensitive geology within the UK (Fig. 1). Streams have been sampled monthly, and lakes quarterly, for a range of chemical determinands over a 12 year period. Site characteristics vary widely, with minimum altitudes ranging from 10 m to 785 m, catchment areas from 50 to 1300 ha, and soils from thin alpine podzols to deep blanket peats (Table 1). Land-use at most sites is restricted to low-intensity moorland grazing with five catchments containing significant areas of commercial coniferous forestry.
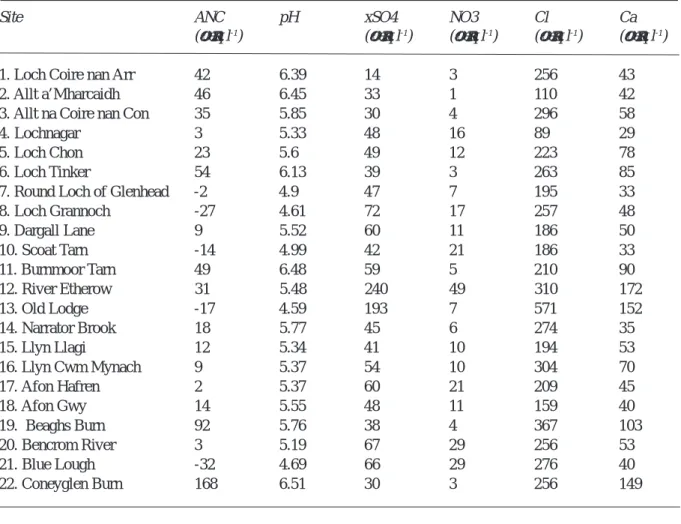
Water chemistry varies within the network (Table 2) with mean pH ranging from 4.7 to 6.5 and acid neutralising capacity (ANC) from –32 to 168 µeq l-1. These variations
are driven by spatial gradients in deposition, mediated by a
Fig. 1. Location of sites in the UK Acid Waters Monitoring
number of catchment-specific factors. In the UK, sources of S and N emissions are mainly concentrated in more populated and industrialised southern and eastern areas and are, therefore, remote from many of the most acid-sensitive regions. AWMN sites closest to these source areas, notably the River Etherow and Old Lodge, generally have the highest levels of SO4 and are strongly acidic, whereas the most remote sites, in northern Scotland and western Northern Ireland, are minimally impacted by anthropogenic deposition. This spatial gradient has also been evident in recent patterns of deposition reductions with large decreases in S deposition observed between 1986 and 1997 in areas near to emissions sources, but little evidence of change over
the same period in the more remote regions where many AWMN sites are located (Fowler and Smith, 2000) (Fig. 2).
A key catchment factor influencing surface water acidity is geological buffering. Although all sites are in acid-sensitive regions, calcium (Ca) concentrations, which provide an indication of weathering rates, vary widely between sites. In areas of more complex geology, closely located sites (e.g. Burnmoor and Scoat Tarns in the English Lake District) may consequently differ substantially in acidity despite similar deposition levels. Concentrations of sea-salts, such as Cl, are generally higher close to western coasts, while nitrate (NO3) appears to be strongly influenced Table 1. Location and catchment characteristics of study sites
Site UK Grid Type Min. Max. Lake Catchment Geology Soils Forest Reference Altitude Altitiude Area Area area
m m ha ha
1. Loch Coire nan Arr NG 808422 Lake 125 896 12 909 Sandstone Podzol,
-gley, peat
2. Allt a’Mharcaidh NH 881045 Stream 325 1111 - 998 Granite Podzol, peat
-3. Allt na Coire nan Con NM 793688 Stream 10 756 - 790 Schist, Peaty gley 48%
gneiss
4. Lochnagar NO 252859 Lake 785 1155 10 101 Granite Alpine podzol
-5. Loch Chon NN 421051 Lake 100 600 100 1670 Schist, grits Podzol, gley 56%
6. Loch Tinker NN 445068 Lake 420 700 11 121 Schist, grits Peat
-7. Round Loch of Glenhead NX 450804 Lake 295 531 13 108 Granite Peat, peaty
-podzol
8. Loch Grannoch NX 542700 Lake 210 601 114 1401 Granite Gley, podzol, 70%
peat
9. Dargall Lane NX 449786 Stream 225 716 - 210 Shale, Peaty podzol
-greywackes
10. Scoat Tarn NY 159104 Lake 602 841 5 100 Volcanics Peaty ranker
-11. Burnmoor Tarn NY 184044 Lake 252 602 24 240 Volcanics, Ranker, podzol,
-granite peat
12. River Etherow SK 116996 Stream 280 633 - 1300 Millstone grit Peat
-13. Old Lodge TQ 456294 Stream 94 198 - 240 Sandstone Brown podzol,
gley
14. Narrator Brook SX 568692 Stream 225 456 - 253 Granite Podzols
-15. Llyn Llagi SH 649483 Lake 380 678 6 163 Slate, shale, Peaty podzol,
-dolerite peat
16. Llyn Cwm Mynach SH 678238 Lake 285 680 6 159 Cambrian Rankers, peat 55%
sedimentary
17. Afon Hafren SN 844876 Stream 355 690 - 358 Shale, gritstone Peaty podzol, 50%
peat
18. Afon Gwy SN 842854 Stream 440 730 - 389 Shale, gritstone Peaty podzol,
-peat
19. Beaghs Burn D 173297 Stream 150 397 - 303 Schist Peat
-20. Bencrom River J 304250 Stream 140 700 - 216 Granite Peat
-21. Blue Lough J 327252 Lake 340 703 2 50 Granite Peat
-by catchment morphology, with the highest concentrations observed at steep, high-elevation sites such as Lochnagar and Scoat Tarn, where soils are thin and biologic activity is low (Kernan and Allott, 1999). Forested sites are consistently more acidic than moorland sites in the same regions (Monteith and Evans, 2000).
Methods
Temporal trends in water chemistry have been assessed for all 22 sites using the non-parametric Seasonal Kendall Test (SKT) (Hirsch et al., 1982; Hirsch and Slack, 1984), and slopes estimated using the method of Sen (1968). This methodology was applied to all monitoring data within the RECOVER:2010 project and is described in detail by Evans et al. (2001b). A significance threshold of p < 0.05 was applied to all trend analyses. Trends were assessed for H, alkalinity, ANC, SO4, non-marine sulphate (xSO4), NO3, Cl, Na, Ca, Magnesium (Mg), labile (free and inorganically complexed) Al, non-labile (organically complexed) Al and dissolved organic carbon (DOC). For this study, ANC was calculated according to the equation:
Table 2. Long-term mean chemistry of study sites
Site ANC pH xSO4 NO3 Cl Ca
(µeq l-1) (µeq l-1) (µeq l-1) (µeq l-1) (µeq l-1)
1. Loch Coire nan Arr 42 6.39 14 3 256 43
2. Allt a’Mharcaidh 46 6.45 33 1 110 42
3. Allt na Coire nan Con 35 5.85 30 4 296 58
4. Lochnagar 3 5.33 48 16 89 29
5. Loch Chon 23 5.6 49 12 223 78
6. Loch Tinker 54 6.13 39 3 263 85
7. Round Loch of Glenhead -2 4.9 47 7 195 33
8. Loch Grannoch -27 4.61 72 17 257 48 9. Dargall Lane 9 5.52 60 11 186 50 10. Scoat Tarn -14 4.99 42 21 186 33 11. Burnmoor Tarn 49 6.48 59 5 210 90 12. River Etherow 31 5.48 240 49 310 172 13. Old Lodge -17 4.59 193 7 571 152 14. Narrator Brook 18 5.77 45 6 274 35 15. Llyn Llagi 12 5.34 41 10 194 53 16. Llyn Cwm Mynach 9 5.37 54 10 304 70 17. Afon Hafren 2 5.37 60 21 209 45 18. Afon Gwy 14 5.55 48 11 159 40 19. Beaghs Burn 92 5.76 38 4 367 103 20. Bencrom River 3 5.19 67 29 256 53 21. Blue Lough -32 4.69 66 29 276 40 22. Coneyglen Burn 168 6.51 30 3 256 149
Fig. 2. Volume-weighted annual mean non-marine SO4
concentrations in rainfall, 1988-1999, at a transect of sites from Central Northern England (high deposition) to Northern Scotland (low deposition). Data from the UK Acid Deposition Monitoring Network (Campbell et al., 1998). Concentrations peaks in 1996
ANC = Alkalinity + (F × DOC) - (3 × labile Al) (1) where ANC and alkalinity (measured by dual end point titration) are expressed in µeq l-1, and DOC and labile Al in µmol l-1. F represents the charge density of DOC at the
equivalence point, estimated as 0.054 for samples with pH < 5.5, and 0.060 for samples with pH > 5.5 (Harriman and Taylor, 1999). This equation also assumes that all inorganic Al is present as Al3+ at the equivalence point (Neal et al.,
1999) and that all organic Al is undissociated. Although ANC is more commonly calculated as the difference between the sum of base cations and the sum of acid anions (Reuss et al., 1986), the random analytical errors associated with this estimate have been shown to be relatively large, especially at sites with high sea-salt concentrations (Evans et al., 2001c). This is a particular problem when attempting to detect long-term trends, which may only be in the order of 1 µeq l-1 yr-1 and Eqn. (1) was, therefore, used in
preference.
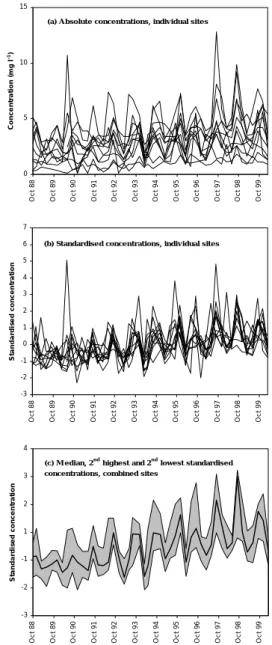
Given the large number of sites and chemical variables under consideration, general patterns in time series were examined by transforming raw data to a more directly comparable form. Concentration data were standardised by subtracting the mean of the full sample set, and dividing by the standard deviation, such that all standardised time series have a mean of zero and a standard deviation of one. At each sampling time, a median of standardised concentrations for all sites was taken and used to generate a dimensionless ‘regional time series’ in which a positive value at any given time demonstrates generally above-average concentrations and a negative value below-average concentrations (Fig. 3). An indication of the variation about these median values was obtained by determining the lowest and second-highest standardised concentrations at each sampling time (for 11 lake or stream sites, this represents the 10th and 90th
percentile). This approach is intended to reveal underlying patterns of regional response and has the advantage that anomalous extreme values, which may obscure trends at individual sites, tend to be excluded. Generally, the narrower the band delimiting the second-highest or second-lowest value, the stronger the temporal coherence across the region. The method has previously been applied to a subset of six high-elevation moorland AWMN lakes by Evans and Monteith (2001) and is extended here to include all 22 sites in the network. Lakes and streams are, however, considered separately due to differences in sampling frequency and potentially also in chemical response. The differing spatial distribution of lakes and streams within the network also has the potential to influence results.
Variables included in the standardised analysis were ANC, H, SO4, xSO4, NO3, Cl, Ca, DOC, labile and non-labile Al.
Data series with more than 50% of values below detection limits, however, (labile Al at Loch Coire nan Arr, Allt a’Mharcaidh, Loch Tinker, Burnmoor Tarn, Coneyglen Burn; NO3 at Allt a’Mharcaidh, Coneyglen Burn) were not used to generate plots. Time series of median standardised concentrations were analysed for trends using the same methods applied to raw concentration data and the stream and lake datasets were further subdivided into those with moorland and forest catchments. The size of the dimensionless slopes obtained is not particularly meaningful, but their direction and significance provide a valuable indicator of changes occurring within the network as a whole.
Fig. 3. Example of the use of median standardised concentrations
to illustrate patterns of temporal change at multiple monitoring sites -3 -2 -1 1 2 3 4 Oc t 8 8 Oc t 8 9 Oc t 9 0 Oc t 9 1 Oc t 9 2 Oc t 9 3 Oc t 9 4 Oc t 9 5 Oc t 9 6 Oc t 9 7 Oc t 9 8 Oc t 9 9 S tan d a rd is ed c o n c en tr at io n (c ) M e dian, 2n d hig he s t and 2n d lo we s t s tandardis e d c o nc e ntratio ns , c o m bine d s ite s
0 5 10 15 Oc t 8 8 Oc t 8 9 Oc t 9 0 Oc t 9 1 Oc t 9 2 Oc t 9 3 Oc t 9 4 Oc t 9 5 Oc t 9 6 Oc t 9 7 Oc t 9 8 Oc t 9 9 C onc e n tr a ti on ( m g l -1)
(a) A bs o lute c o nc e ntratio ns , indiv idual s ite s
-3 -2 -1 0 1 2 3 4 5 6 7 Oc t 8 8 Oc t 8 9 Oc t 9 0 Oc t 9 1 Oc t 9 2 Oc t 9 3 Oc t 9 4 Oc t 9 5 Oc t 9 6 Oc t 9 7 Oc t 9 8 Oc t 9 9 S tan d a rd is ed c o n c en tr at io n
Results
TRENDS AT INDIVIDUAL SITES
Significant (p < 0.05) Seasonal Kendall trends for individual sites (Table 3) show a fair degree of consistency within the network. Where observed, trends are generally indicative of recovery from acidification with ANC increasing significantly at ten sites, alkalinity at four, and H and labile Al both decreasing at seven. Only at the forested Loch Grannoch is there any evidence of continued acidification
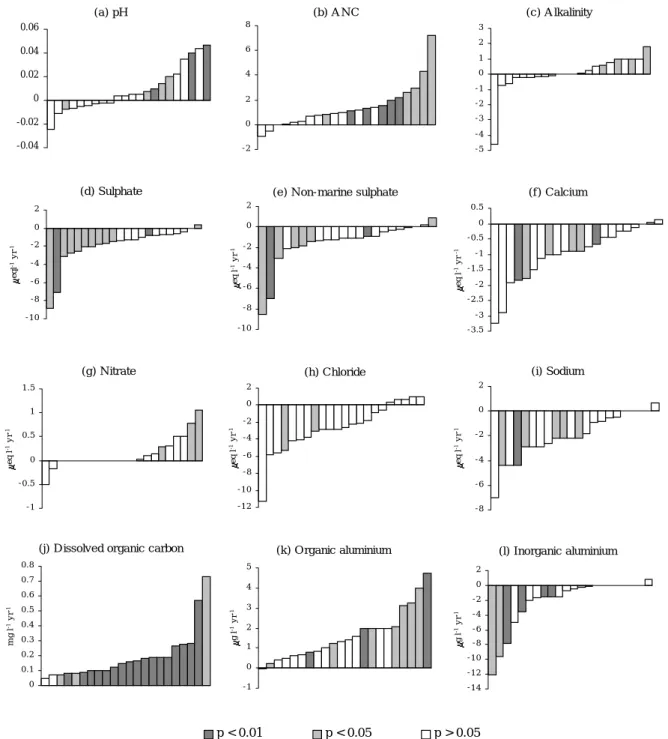
with H having risen significantly over the study period. Considering all trend slopes regardless of significance (Fig. 4) suggests a more general reduction in acidity with ANC having risen and H and labile Al fallen at the majority of sites in the network. Overall patterns of change in alkalinity are less clear, with a number of sites showing small non-significant decreases. The large non-non-significant decrease at one site, Coneyglen Burn, is actually small relative to the high mean alkalinity of this site (152 µeq l-1) and does not
indicate major acidification.
Fig. 4. Estimated trend slopes for all AWMN sites, ordered by slope estimate (a ) pH -0.04 -0.02 0 0.02 0.04 0.06 (h) C hloride - 1 2 - 1 0 - 8 - 6 - 4 - 2 0 2 eq l -1 yr -1
(j) D issolved organic carbon
0 0 .1 0 .2 0 .3 0 .4 0 .5 0 .6 0 .7 0 .8 mg l -1 yr -1 (c ) A lkalinity - 5 - 4 - 3 - 2 - 1 0 1 2 3 (e ) N on-marine sulphate - 1 0 - 8 - 6 - 4 - 2 0 2 eq l -1 yr -1 (g) N itrate - 1 - 0 .5 0 0 .5 1 1 .5 eq l -1 yr -1 (f) Ca lcium - 3 .5 - 3 - 2 .5 - 2 - 1 .5 - 1 - 0 .5 0 0 .5 eq l -1 yr -1 (i) Sodium - 8 - 6 - 4 - 2 0 2 eq l -1 yr -1 (l) Inorganic aluminium - 1 4 - 1 2 - 1 0 - 8 - 6 - 4 - 2 0 2 g l -1 yr -1 (k) O rganic aluminium - 1 0 1 2 3 4 5 g l -1 yr -1 (d) Sulpha te - 1 0 - 8 - 6 - 4 - 2 0 2 eq l -1 yr -1 (b) A N C - 2 0 2 4 6 8 -5 0 p < 0.01 p < 0.05 p > 0.05
T
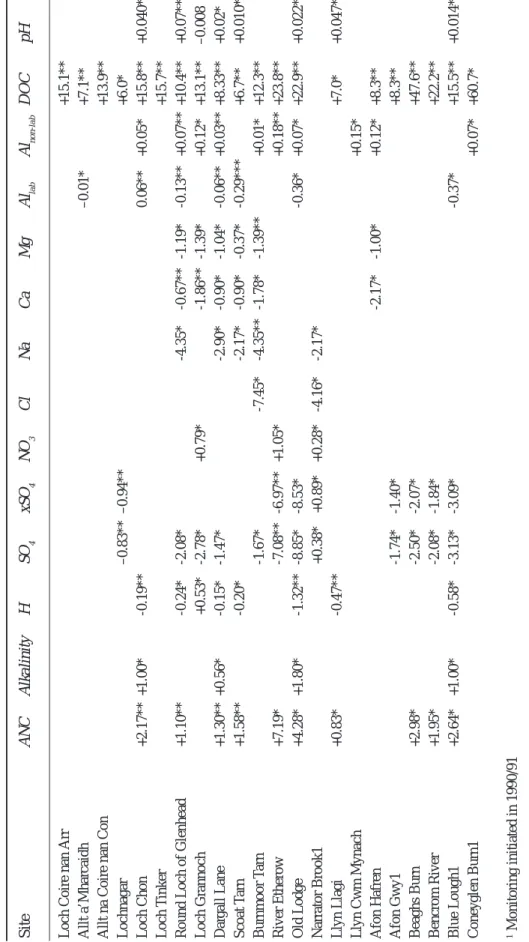
able 3.
Seasonal Kendall trend significance and slope estimates for individual sites. All trend estimates in
µ
eq l
-1 yr -1 except pH (pH units yr -1),
Allab and DOC (both
µ
mol l
-1 yr -1). * indicates trend signficant at p < 0.05, ** trend significant at p < 0.01. T
rends with p > 0.05 not shown.
Site ANC Alkalinity H S O4 xSO 4 NO 3 C l Na Ca Mg Al lab Al non-lab DOC pH
Loch Coire nan Arr
+15.1**
Allt a’Mharcaidh
–0.01*
+7.1**
Allt na Coire nan Con
+13.9** Lochnagar –0.83** –0.94** +6.0* Loch Chon +2.17** +1.00* -0.19** 0.06** +0.05* +15.8** +0.040** Loch T inker +15.7**
Round Loch of Glenhead
+1.10** -0.24* -2.08* -4.35* -0.67** -1.19* -0.13** +0.07** +10.4** +0.07** Loch Grannoch +0.53* -2.78* +0.79* -1.86** -1.39* +0.12* +13.1** –0.008 Dar gall Lane +1.30** +0.56* -0.15* -1.47* -2.90* -0.90* -1.04* -0.06** +0.03** +8.33** +0.02* Scoat T arn +1.58** -0.20* -2.17* -0.90* -0.37* -0.29*** +6.7** +0.010** Burnmoor T arn -1.67* -7.45* -4.35** -1.78* -1.39** +0.01* +12.3** River Etherow +7.19* -7.08** -6.97** +1.05* +0.18** +23.8** Old Lodge +4.28* +1.80* -1.32** -8.85* -8.53* -0.36* +0.07* +22.9** +0.022* Narrator Brook1 +0.38* +0.89* +0.28* -4.16* -2.17* Llyn Llagi +0.83* -0.47** +7.0* +0.047** Llyn Cwm Mynach +0.15* Afon Hafren -2.17* -1.00* +0.12* +8.3** Afon Gwy1 -1.74* -1.40* +8.3** Beaghs Burn +2.98* -2.50* -2.07* +47.6** Bencrom River +1.95* -2.08* -1.84* +22.2** Blue Lough1 +2.64* +1.00* -0.58* -3.13* -3.09* -0.37* +15.5** +0.014* Coneyglen Burn1 +0.07* +60.7* 1 Monitoring initiated in 1990/91
Given the large decrease in S emissions during the 1980s and 1990s, it might be assumed that observed reductions in acidity have been driven by decreases in surface water SO4 concentrations. To some extent this is supported by the trend analysis with significant falls in SO4 recorded at 12 sites and negative slopes at all but two sites (Fig. 4e). Decreases in xSO4, however, are only significant at eight sites and of the 10 sites with rising ANC, only five have significant xSO4 trends. It appears, therefore, that part of the SO4 reduction observed since 1988 has been in the marine component and also that reductions in acidity over the last 12 years are not simply a function of falling anthropogenic S inputs. For the other major acidifying anion, NO3, there is little evidence of widespread change over the monitoring period. Three sites exhibit significant rising trends but at the majority of sites, trend slopes are close to zero. Calcium concentrations have fallen at six sites, primarily in the Lake District and Galloway, and a similar pattern is observed for Mg. The main sea-salt ions, Na and Cl, both show a general pattern of reducing concentrations since 1988, but relatively few trends are significant.
The most widespread change observed in the AWMN over the last 12 years has been a strong increase in DOC. This has risen at every site in the network and trends are significant at 20 sites (three more than for the 1988–1998 period), most at p < 0.01. Non-labile Al has also risen significantly at 10 sites and non-significantly at a further 11 sites. These increases in the organic component of Al appear closely correlated to those in DOC and are consistent with concentrations being determined by the availability of the organic matter for complexation (Driscoll et al., 1984). As a result of the opposing changes in the labile and non-labile Al fractions, total soluble Al has remained relatively unchanged at most sites.
TRENDS AT COMBINED LAKE SITES
Time series of standardised concentrations for lakes (Fig. 5) suggest highly coherent temporal variations at different
sites with, in most instances, a relatively narrow range between the second highest and second lowest values observed at each sampling time. Despite differences in deposition, climate, geology, soils and land-use between sites, therefore, it appears that the underlying factors controlling temporal change are to some extent uniform across the study region.
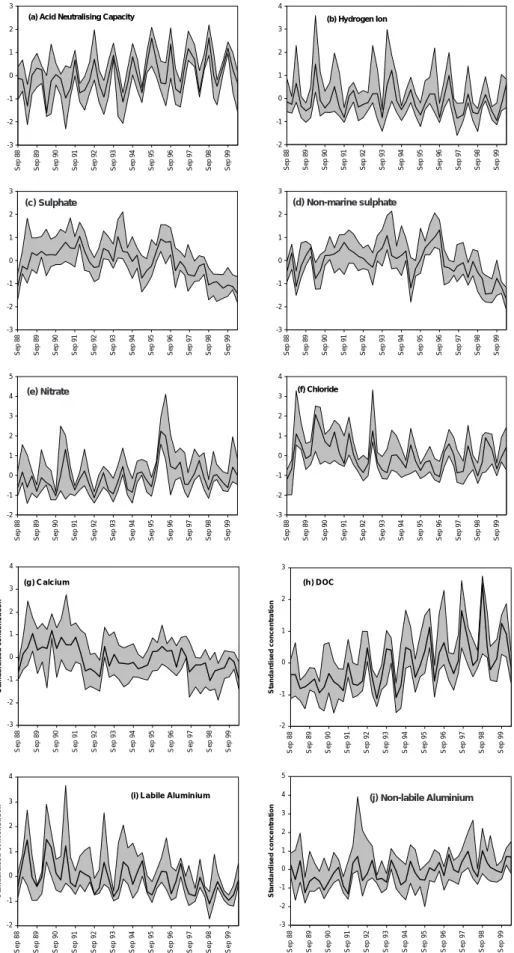
These plots, together with trend analyses of median standardised concentrations (Table 4), allow a number of general patterns at the 11 lakes to be identified. Despite strong seasonality, it is clear that ANC has risen significantly during the 12-year period and that H and labile Al concentrations have both fallen. These observations support the conclusion of individual site analyses that surface waters have tended to become less acidic since 1988. Long-term changes in SO4 and xSO4 are also strongly consistent among sites but xSO4 in particular does not exhibit a linear decrease. As noted earlier, high total SO4 concentrations in the early part of the record were in part due to high marine SO4 deposition at this time. This is well illustrated by time series for Cl which, although fairly constant since 1993 (as a result of which SKT trends are not significant), was clearly much higher from 1989 to 1992. In more recent years, falling standardised concentrations of both SO4 and xSO4 suggest a widespread response to reductions in pollutant deposition at most or all lake sites, with recent concentrations lower than any that have been observed previously at these sites. These results are consistent with observed precipitation chemistry (Fig. 2) which indicates widespread decreases in recent years. Although rates of xSO4 decline have been greatest since 1997, large xSO4 peaks at individual sites in winter 1995/96 have been attributed to flushing following a widespread drought in the preceding summer (Harriman et al., 2001). It is probable, therefore, that the underlying xSO4 trend has been downward since around 1994.
Although there does not seem to be any UK-wide long-term trend in NO3, inter-annual variations are consistent between lakes with the large climate-driven spring 1996 peak observed at all locations. Median standardised Ca has
Table 4. Direction and significance of trends in median standardised concentrations for grouped lakes and streams. Trends are based on the median of standardised concentrations for each site. Single arrows indicate trend significance at 0.05 level, double arrows indicate trend significant at 0.01 level.
Fig. 5. Standardised concentration time series, lakes. Bold solid line shows the median standardised concentration for the eleven lakes, and
shaded areas the range between 2nd highest and 2nd lowest standardised concentrations, for each sampling time -3 -2 -1 0 1 2 3
Sep 88 Sep 89 Sep 90 Sep 91 Sep 92 Sep 93 Sep 94 Sep 95 Sep 96 Sep 97 Sep 98 Sep 99
(a) Acid Neutralising Capacity
-2 -1 0 1 2 3 4
Sep 88 Sep 89 Sep 90 Sep 91 Sep 92 Sep 93 Sep 94 Sep 95 Sep 96 Sep 97 Sep 98 Sep 99
(b) Hydrogen Ion -3 -2 -1 0 1 2 3
Sep 88 Sep 89 Sep 90 Sep 91 Sep 92 Sep 93 Sep 94 Sep 95 Sep 96 Sep 97 Sep 98 Sep 99
-3 -2 -1 0 1 2 3
Sep 88 Sep 89 Sep 90 Sep 91 Sep 92 Sep 93 Sep 94 Sep 95 Sep 96 Sep 97 Sep 98 Sep 99
-3 -2 -1 0 1 2 3 4
Sep 88 Sep 89 Sep 90 Sep 91 Sep 92 Sep 93 Sep 94 Sep 95 Sep 96 Sep 97 Sep 98 Sep 99
(f) Chloride -2 -1 0 1 2 3 4 5
Sep 88 Sep 89 Sep 90 Sep 91 Sep 92 Sep 93 Sep 94 Sep 95 Sep 96 Sep 97 Sep 98 Sep 99
(c) Sulphate (d) Non-marine sulphate
(e) Nitrate (j) Non-labile Aluminium -3 -2 -1 0 1 2 3 4 S e p 88 S e p 89 S e p 90 S e p 91 S e p 92 S e p 93 S e p 94 S e p 95 S e p 96 S e p 97 S e p 98 S e p 99 S ta n d a rd is ed c o n c en tr at io n (g ) C a lc iu m -2 -1 0 1 2 3 S e p 88 S e p 89 S e p 90 S e p 91 S e p 92 S e p 93 S e p 94 S e p 95 S e p 96 S e p 97 S e p 98 S e p 99 S ta n d a rd is ed c o n c en tr at io n (h ) D OC -2 -1 0 1 2 3 4 S e p 88 S e p 89 S e p 90 S e p 91 S e p 92 S e p 93 S e p 94 S e p 95 S e p 96 S e p 97 S e p 98 S e p 99 S ta n d a rd is ed c o n c en tr at io n
(i) L a b ile Alu m in iu m
-3 -2 -1 0 1 2 3 4 5 Se p 8 8 Se p 8 9 Se p 9 0 Se p 9 1 Se p 9 2 Se p 9 3 Se p 9 4 Se p 9 5 Se p 9 6 Se p 9 7 Se p 9 8 Se p 9 9 S ta n d a rd is ed c o n c en tr at io n (j) Non-labile Aluminium
fallen over the monitoring period and is closely correlated to SO4. High concentrations in 1989–1991 are thought to result from the peak in sea-salt deposition with Ca displaced (along with H and labile Al) from soil exchange sites by marine Na and Mg (Evans et al., 2001a). Subsequently, the decrease in Ca leaching by acid deposition has led to a general fall in Ca concentrations. Base cation decreases effectively damp ANC response to changes in SO4 and have been widely observed elsewhere in Europe and North America (eg Stoddard et al., 1999; Evans et al., 2001a). Since reductions in non-marine base cations have generally been smaller than those in xSO4, however, ANC has increased.
In accordance with the strong individual site trends, highly significant rising trends are observed for both DOC and non-labile Al. Increases have been approximately linear over the 12-year period (Fig. 5) and rising trends are apparent in both seasonal maxima and minima. The mechanisms for, and the significance of, these trends are discussed below.
TRENDS AT COMBINED STREAM SITES
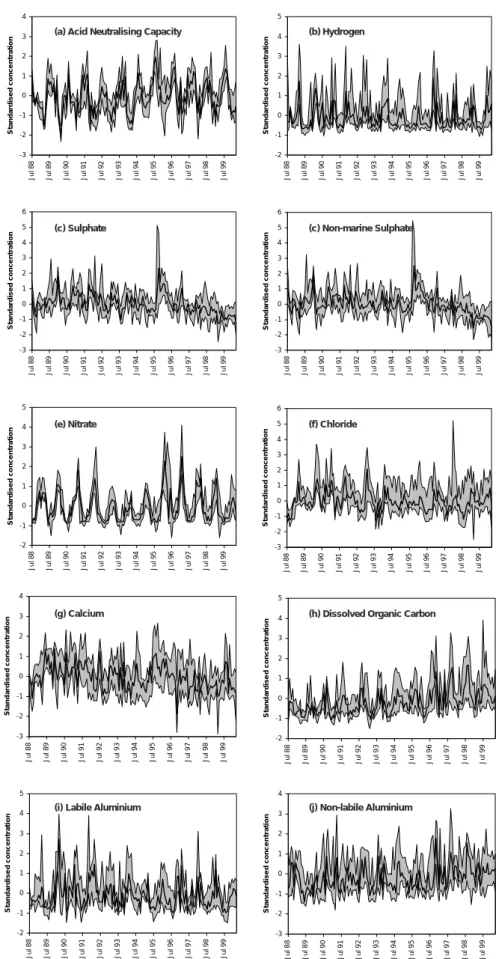
Standardised concentration time series for streams (Fig. 6) are noisier than those for lakes, due partly to the higher sampling frequency but also to the greater impact of episodes in streams. Without the damping effect of lake storage, the range of solute concentrations observed is generally higher and underlying trends in some cases more difficult to detect as a result. In addition, band widths tend to be greater than those for lake sites suggesting weaker temporal coherence. This is perhaps not surprising given the wider geographical spread of streams relative to lakes (Fig. 1). A number of clear temporal patterns remains evident, however, and in most cases corresponds to those observed for lakes. Sulphate concentrations were clearly highest during the early 1990s and have declined since, with a similar but perhaps slightly delayed reduction observed for xSO4. The S flush following the 1995 drought is highly pronounced in most streams. Although an upward trend is observed in median standardised ANC (Table 4), it is weaker than that observed for lakes and trends for H and labile Al are not significant. This is due to the high degree of episodicity, particularly for H, although episode maxima in H and labile Al have both perhaps declined over the monitoring period.
Nitrate variations largely correspond to those for lakes, with strong and spatially consistent inter-annual variations in spring peak values but no overall trend. Calcium variations also correspond well to observations at lakes, with high concentrations coinciding with the peak in sea-salt deposition around 1990 and a second peak concurrent with the 1995-96 SO4 flush. Although the downward trend is not
significant (p = 0.067) over the full 12-year period, concentrations do appear to have fallen along with SO4 in recent years. DOC and non-labile Al concentrations again show strong, linear upward trends, although for DOC it appears that increases have been greater in seasonal/episode maxima than in minima.
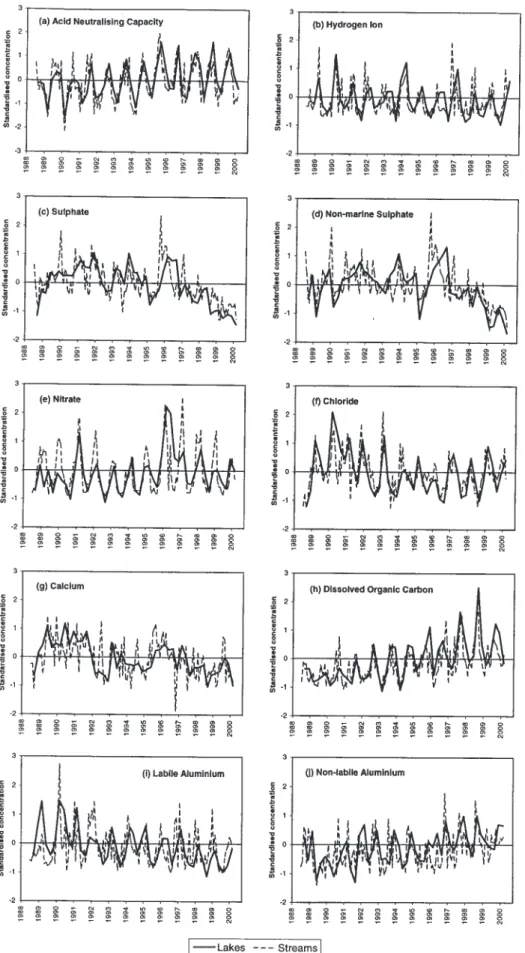
Although short-term variability to some extent masks long-term trends at stream sites, the underlying patterns observed remain consistent with the lakes with recovery over the last 12 years. A direct comparison between median standardised concentrations for lakes and streams (Fig. 7) shows clear similarities between the two surface water types in terms of both long-term trends and inter-annual variations. This suggests: (i) that in-lake processes have not greatly influenced temporal patterns at lake sites; and (ii) that differences in the geographical distribution of lakes and streams within the AWMN have not led to major systematic differences in chemical trends between the two surface water types.
EFFECTS OF FORESTRY ON RECOVERY FROM ACIDIFICATION
Coniferous forestry planting in the UK has been shown to increase acidification of surface waters (e.g. Harriman and Morrison, 1982) through a combination of enhanced dry deposition of acidifying pollutants to the forest canopy (Mayer and Ullrich, 1977), base cation uptake by the growing trees (Miller, 1981) and decreased water yield causing a concentration of pollutants in runoff (Neal et al., 1986). At three sets of paired catchments in the AWMN, forested catchments have consistently higher concentrations of xSO4 and NO3 and are more acid than nearby moorland sites (Monteith and Evans, 2000). In addition to this apparent enhancement of present-day acidity, dynamic modelling studies suggest that forest growth may reduce, or even negate, recovery of surface waters in response to reducing acid deposition (Jenkins et al., 1997). This will occur where uptake by the forest and leaching by acid anions together exceed the supply of base cations from weathering, leading to continued depletion of soil base saturation. With many forest plantations in the UK at or near maturity, harvesting and replanting may intensify this problem.
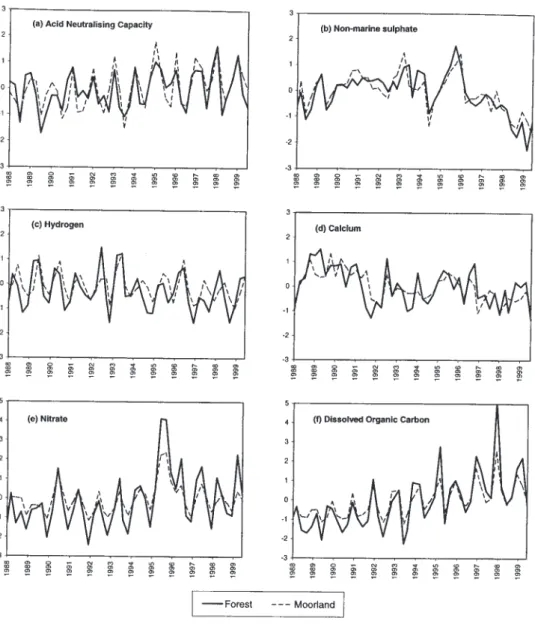
To compare long-term trends, median standardised concentrations were calculated separately for forest and moorland lakes and streams. Time series for lakes (Fig. 8) and trends for each subset (Table 4) show strong similarities in temporal variation for a number of variables, most strikingly xSO4, suggesting that moorland and forest catchments have responded in a similar fashion to deposition changes (streams are not shown as short-term variability
Fig. 6. Standardised concentration time series, streams. Bold solid line shows the median standardised concentration for the eleven streams,
and shaded areas the range between 2nd highest and 2nd lowest standardised concentrations, for each sampling time. -3 -2 -1 0 1 2 3 4 5 6 Ju l 8 8 Ju l 8 9 Ju l 9 0 Ju l 9 1 Ju l 9 2 Ju l 9 3 Ju l 9 4 Ju l 9 5 Ju l 9 6 Ju l 9 7 Ju l 9 8 Ju l 9 9 S ta nda rd is e d conc e n tr at io n -3 -2 -1 0 1 2 3 4 5 6 Ju l 8 8 Ju l 8 9 Ju l 9 0 Ju l 9 1 Ju l 9 2 Ju l 9 3 Ju l 9 4 Ju l 9 5 Ju l 9 6 Ju l 9 7 Ju l 9 8 Ju l 9 9 S ta nda rd is e d conc e n tr at io n -2 -1 0 1 2 3 4 5 Ju l 8 8 Ju l 8 9 Ju l 9 0 Ju l 9 1 Ju l 9 2 Ju l 9 3 Ju l 9 4 Ju l 9 5 Ju l 9 6 Ju l 9 7 Ju l 9 8 Ju l 9 9 S ta nda rd is e d conc e n tr at io n -2 -1 0 1 2 3 4 5 Ju l 8 8 Ju l 8 9 Ju l 9 0 Ju l 9 1 Ju l 9 2 Ju l 9 3 Ju l 9 4 Ju l 9 5 Ju l 9 6 Ju l 9 7 Ju l 9 8 Ju l 9 9 S ta n da rd is e d conc e n tr at io n -3 -2 -1 0 1 2 3 4 Ju l 8 8 Ju l 8 9 Ju l 9 0 Ju l 9 1 Ju l 9 2 Ju l 9 3 Ju l 9 4 Ju l 9 5 Ju l 9 6 Ju l 9 7 Ju l 9 8 Ju l 9 9 S ta n da rd is e d conc e n tr at io n -3 -2 -1 0 1 2 3 4 5 6 Ju l 8 8 Ju l 8 9 Ju l 9 0 Ju l 9 1 Ju l 9 2 Ju l 9 3 Ju l 9 4 Ju l 9 5 Ju l 9 6 Ju l 9 7 Ju l 9 8 Ju l 9 9 S ta nda rd is e d conc e n tr at io n -2 -1 0 1 2 3 4 5 Jul 8 8 Jul 8 9 Jul 9 0 Jul 9 1 Jul 9 2 Jul 9 3 Jul 9 4 Jul 9 5 Jul 9 6 Jul 9 7 Jul 9 8 Jul 9 9 S ta n d a rd is e d c o n c e n tr a tio n -2 -1 0 1 2 3 4 5 Jul 8 8 Jul 8 9 Jul 9 0 Jul 9 1 Jul 9 2 Jul 9 3 Jul 9 4 Jul 9 5 Jul 9 6 Jul 9 7 Jul 9 8 Jul 9 9 S ta n d a rd is e d c o n c e n tr a tio n -3 -2 -1 0 1 2 3 4 Jul 8 8 Jul 8 9 Jul 9 0 Jul 9 1 Jul 9 2 Jul 9 3 Jul 9 4 Jul 9 5 Jul 9 6 Jul 9 7 Jul 9 8 Jul 9 9 S ta n d a rd is e d c o n c e n tr a tio n -3 -2 -1 0 1 2 3 4 Jul 8 8 Jul 8 9 Jul 9 0 Jul 9 1 Jul 9 2 Jul 9 3 Jul 9 4 Jul 9 5 Jul 9 6 Jul 9 7 Jul 9 8 Jul 9 9 S ta n d a rd is e d c o n c e n tr a tio n
(a) Acid Neutralising Capacity
(c) Sulphate
(b) Hydrogen
(c) Non-marine Sulphate
(e) Nitrate (f) Chloride
(g) Calcium (h) Dissolved Organic Carbon
makes visual comparison difficult). It is difficult from this relatively short dataset to discern any long-term divergence in trends between moorland and forest systems, but in general trends in acidity-related variables appear weaker for forests than moorlands (Table 4). Additionally, these grouped data mask some heterogeneity between individual forested sites with Loch Chon exhibiting strong trends towards recovery in ANC, H and labile Al (Table 3), whilst other sites either show no trends in these variables or in the case of H at Loch Grannoch, evidence for continued acidification. At both Loch Grannoch and the Afon Hafren, downward trends in Ca exceed those for moorland sites in the same regions, possibly suggesting depletion of soil base cations by forest uptake.
Overall, therefore, given the small number of forest sites
in the AWMN and their apparent heterogeneity, it is difficult to generalise regarding the impact of forests on recovery. It is likely that trends at forested sites will vary according to the supply of base cations from weathering; at sites where weathering supplies exceed uptake and leaching demands under reduced acid deposition, recovery will be observed (as at Loch Chon) whereas at sites where weathering is insufficient to meet this demand (perhaps at Loch Grannoch) recovery may not occur and in some cases acidification may continue.
Discussion
Any approach whereby large numbers of sites are grouped together to generate a single ‘regional’ temporal pattern
necessarily involves some loss of information regarding changes at individual sites. In this study, the median standardised concentrations used to assess recovery undoubtedly mask considerable spatial heterogeneity among acid sensitive surface waters in the UK, with greater change expected, and observed, at acidified sites in high-deposition regions than at more remote, unimpacted sites. Catchment-specific factors such as land-use, altitude, levels of sea-salt deposition and the presence of standing waters may also influence the behaviour of individual sites. Nevertheless, the analysis undertaken has revealed underlying patterns of temporal change that appear to have operated across much, or all, of the AWMN. These patterns should therefore be fairly representative of changes in acid-sensitive waters across the UK as a whole.
At a simple level, chemical changes during the 12 years of AWMN monitoring can be divided into two periods. From 1988 to 1993 there appears to have been little change in pollutant SO4 concentrations and, therefore, in the anthropogenic contribution to freshwater acidity. This was also a period of elevated storm intensity in the UK, however, leading to higher rainfall and at many sites, increased marine ion deposition. Combined effects of dilution and ‘sea-salt effect’ displacement of soil H and Al led to naturally elevated freshwater acidity during this time. During the second period, from 1994 onwards, marine ion deposition appears to have been lower and more stable whereas anthropogenic S inputs decreased. Consequently, apart from a drought-related flush in the winter of 1995/96, the trend in xSO4 has clearly been downward during this period. It appears coincidental that, in terms of acidity, these two phases of chemical change have combined to cause an approximately linear increase in ANC over the 12-year period, with accompanying decreases in H, labile Al and also Ca.
Nitrate, although subject to large climatically-driven inter-annual cycles, does not exhibit the widespread rising trends that might indicate decreasing retention of N deposition by soils and vegetation. This ongoing process of ‘N saturation’ has been widely predicted (e.g. Aber et al., 1989; Stoddard, 1994), but long-term data for the UK and for other European freshwaters (Wright et al., 2001) do not indicate that such changes are currently occurring. In contrast, concentrations of DOC have risen significantly and in an approximately linear fashion, at lakes and streams throughout the UK since 1988. Since DOC concentrations are affected by many factors, including soil acidity, temperature and moisture content (Kalbitz et al., 2000), it is difficult to isolate the cause of this increase. Previous studies (e.g. Krug and Frink, 1983; Tipping and Hurley, 1988) have suggested an inverse link between mineral acid inputs and the leaching of organic acidity (and hence DOC) to runoff. It is thus possible that
increased DOC concentrations in the UK represent a response to reductions in soil and stream acidity over the last 12 years. The large increases in DOC observed at a number of relatively unimpacted sites in north-west Scotland and north-west Northern Ireland (Table 2), however, argue against an acidity control at all sites and suggest that climatic factors may also be important. It has recently been suggested that peat decomposition may be strongly regulated by an enzyme, phenol oxidase, which appears highly sensitive to climatic variation (Freeman et al., 2001). Changes in the decomposition of peat soils would directly impact DOC output.
While the controlling mechanisms remain uncertain, it is interesting to note that from Eqn. (1), increases in DOC have in effect constituted part of the observed increases in ANC. Converting DOC trends using the charge density estimates given earlier, organic acidity is estimated to have increased by between 3 and 44 µeq l-1 at individual sites
since 1988 (median of all sites +9 µeq l-1). By comparison,
xSO4 has changed by between –102 and +11 µeq l-1 (median
–13 µeq l-1). The increase in organic acidity is thus of a
similar magnitude to the decrease in mineral acidity. Together with observed reductions in labile Al at many sites, this explains why ANC has increased significantly at many sites, but alkalinity has not (Table 2, Fig. 4). In effect, this replacement of mineral by organic acidity represents a ‘confounding factor ’ with regard to recovery from acidification in the UK although it must be emphasised that this replacement has only been partial, since reductions in H and labile Al have also occurred. Furthermore, the change in Al speciation from labile to non-labile forms will have reduced biological toxicity even at an unchanged pH (Baker et al., 1990).
Conclusions
The results of this study contrast with those of previous analyses of AWMN data over shorter time periods (Patrick et al., 1995; Stoddard et al., 1999; Monteith and Evans, 2000) in showing for the first time clear and widespread evidence of the onset of recovery from acidification. At many sites, concentrations of xSO4 were lower between 1998 and 2000 than at any time in the preceding decade, confirming a downward trend in pollutant SO4 levels thought to have begun during the mid-1990s. Together with a reduction in the high levels of rainfall and sea-salt deposition observed during the early years of monitoring, this appears to have resulted in a general reduction in acidity and toxic labile Al concentrations and an increase in ANC. As would be expected, trends are strongest at highly acidified sites closer to emissions sources and weakest at sites in remote,
unimpacted regions. Trends are generally clearest in lakes, but many of the same trends, particularly changes in xSO4, can also be identified at streams despite greater episodicity. Forested sites also show similar SO4 changes to moorland systems but most do not yet show evidence of recovery, possibly due to the continuing depletion of soil base cation stores by forest uptake and enhanced acid deposition.
Reductions in SO4 concentrations, where observed, have been balanced by changes in a range of other solutes. The major changes observed are: (a) decreases in catchment-derived base cations (mainly Ca); (b) increases in organic acids; and (c) reductions in acidity (H and labile Al). In effect, both (a) and (b) can be considered ‘confounding factors’ in that they limit the response of runoff acidity to reductions in acid anion concentrations. Of the two, changes in base cation concentrations are widely recognised as a negative feedback on changes in mineral acid inputs, ameliorating acidification but also slowing recovery. The large observed increases in DOC, and hence organic acidity, are less well understood and a key uncertainty exists as to whether these changes are linked to reductions in mineral acidity (therefore representing a further negative feedback on acidification and recovery) or to climatic changes (thus forming a coincidental, but nonetheless important, counter to reduced mineral acidity in the UK). Two other processes with the potential to limit recovery, increased N leaching and the long-term release of stored S, have not been clearly demonstrated for AWMN waters.
Finally, climatic fluctuations have a major impact on inter-annual chemical variations in many solutes, including SO4, NO3, base cations and acidity. Providing that the drivers underlying these fluctuations, such as the NAO, do not alter over the longer term, these variations will be essentially cyclical and should not, therefore, be considered as confounding factors in recovery. Instead, these climatic fluctuations represent an important source of ‘noise’ in monitoring datasets, potentially on timescales of a decade or more and an understanding of these processes, along with a sufficient period of monitoring, is essential for the accurate identification of underlying trends towards recovery from acidification.
Acknowledgements
This work has been funded by the United Kingdom Department of the Environment, Transport and the Regions (Contract No. EPG 1/3/92), the Environment and Heritage Service, Northern Ireland, and by the Commission of European Communities RECOVER:2010 project (EVK1-CT-1999-00018).
References
Aber, J.D., Nadelhofer, K.J., Streudler, P. and Melillo, J., 1989. Nitrogen saturation in northern forest ecosystems. BioScience,
39, 378–386.
Baker, J.P., Bernard, D.P., Christensen, S.W. and Sale, M.L., 1990. Biological effects of changes in surface water acid-base chemistry. In: Acid Deposition: State of Science and Technology, NAPAP Report 9, National Acid Precipitation Assessment Program, Washington, D.C.
Battarbee, R.W., Anderson, N.J., Appelby, P.G., Flower, R.J., Fritz, S.C., Haworth, E.Y., Higgitt, S., Jones, V.J., Munro, M.A.R., Natkanski, J., Oldfield, F., Patrick, S.T., Richardson, N.G., Rippey, B. and Stevenson, A.C., 1988. Lake acidification in
the UK 1800-1986: evidence from the analysis of lake sediments.
ENSIS Publishing, London.
Campbell, G., Vincent, K., Downing, C., Hasler, S., Donovan, B., Smith, M., Sansom, L. and Page, H., 1998. Acid Deposition
Monitoring in the UK: 1986 to 1997. Report to the Department
of the Environment, Transport and the Regions, AEA Technology, Culham, Oxon, UK.
Driscoll, C.T., Baker, J.P., Bisogni, J.J. and Schofield, C.L., 1984. Aluminum speciation and equilibria in dilute acidic surface waters of the Adirondack region of New York State. In:
Geological Aspects of Acid Deposition, O.P. Bricker (Ed.) .
Butterworth, Boston, USA.
Evans, C.D. and Monteith, D.T., 2001. Natural and anthropogenic changes in the chemistry of six UK mountain lakes, 1988 to 2000. Water Air Soil Pollut., (in press).
Evans, C.D., Monteith, D.T. and Harriman, R., 2001a. Long-term variability in the deposition of marine ions at west coast sites in the UK Acid Waters Monitoring Network: Impacts on surface water chemistry and significance for trend determination. Sci.
Total Envir., 265, 115–129.
Evans, C.D., Cullen, J.M., Alewell, C., Kopácek, J., Marchetto, A., Moldan, F., Prechtel, A., Rogora, M., Veselý, J. and Wright, R.F., 2001b. Recovery from acidification in European surface waters. Hydrol. Earth Syst. Sci., 5, 283–297.
Evans, C.D., Harriman, R., Monteith, D.T. and Jenkins, A., 2001c. Assessing the suitability of acid neutralising capacity as a measure of long-term trends in acid waters based on two parallel datasets. Water Air Soil Pollut., (in press).
Fowler, D. and Smith, R., 2000. Spatial and temporal variability in the deposition of acidifying species in the UK between 1986 and 1997. In: The UK Acid Waters Monitoring Network: 10
Year Report. Analysis and Interpretation of Results, April 1988 – March 1998, D.T. Monteith and C.D. Evans (Eds.). ENSIS
Publishing, London, 363 pp.
Freeman, C., Ostle, N. and Kang, H., 2001. An enzymatic ‘latch’ on a global carbon store. Nature, 409, 149.
Harriman, R. and Morrison, B.R.S., 1982. Ecology of streams draining forested and non-forested catchments in an area of central Scotland subject to acid precipitation. Hydrobiologia,
88, 251–263.
Harriman, R. and Taylor, E.M., 1999. Acid Neutralising Capacity
and Alkalinity: Concepts and Measurement. Report SR (99) 06F,
Freshwater Fisheries Laboratory, Pitlochry, 14 pp.
Harriman, R., Christie, A.E.G., McCartney, A.G., Moore, D.W., Taylor, E.M., Watson, J. and Watt, A.W., 2001. Interpretation of recovery trends in acidic deposition and surface waters in Scotland over the past three decades. Hydrol. Earth Syst. Sci.,
5, 407–420.
Helliwell, R.C., Ferrier, R.C., Johnson, L. and Goodwin, J., 2001. Land use influences on acidification and recovery of freshwaters in Galloway, south-west Scotland. Hydrol. Earth Syst. Sci., 5, 451–458.
Hirsch, R.M. and Slack, J.R., 1984. A nonparametric test for seasonal data with serial dependence. Water Resour. Res., 20, 727–732.
Hirsch, R.M., Slack, J.R. and Smith, R.A., 1982. Techniques of trend analysis for monthly water quality data. Water Resour.
Res., 18, 107–121.
Hurrell, J.W., 1995. Decadal trends in the North Atlantic Oscillation, regional temperatures and precipitation. Science,
269, 676–679.
Jenkins, A., Renshaw, M., Helliwell, R., Sefton, C., Ferrier, R. and Swingewood, P., 1997. Modelling surface water acidification
in the UK. IH Report 131, Wallingford, UK. 53 pp.
Kalbitz, K., Solinger, J-H., Park, B., Michalzik, B. and Matzner, E., 2000. Controls on the dynamics of dissolved organic matter: a review. Soil Sci., 165, 277–304.
Kernan, M.R. and Allott, T.E.H., 1999. Spatial variability of nitrate concentrations in lakes in Snowdonia, North Wales, UK. Hydrol.
Earth Syst. Sci., 3, 395–408.
Krug, E.C. and Frink, C.R., 1983. Acid rain on acid soil: A new perspective. Science, 221, 520–525.
Langan, S.J., 1989. Sea-salt induced streamwater acidification.
Hydrol. Process., 3, 25–41.
Mayer, R. and Ullrich, B., 1977. Acidity of precipitation as influenced by the filtering of atmospheric S and N compounds - its role in the element balance and effect on soil. Water, Air,
Soil Pollut., 9, 409–416.
Miller, H.G., 1981. Forest fertilisation: Some guiding concepts.
Forestry, 54, 157–167.
Monteith, D.T. and Evans, C.D. (Eds.), 2000. The UK Acid Waters
Monitoring Network: 10 Year Report. ENSIS Publishing,
London, 363 pp.
Monteith, D.T., Evans, C.D. and Reynolds, B., 2000. Evidence for a link between temporal variations in the nitrate content of UK upland freshwaters and the North Atlantic Oscillation.
Hydrol. Process., 14, 1745–1749.
Neal, C., Whitehead, P.G., Neale, R. and Cosby, B.J., 1986. Modelling the effects of acidic deposition and conifer afforestation on stream acidity in the British Uplands. J. Hydrol.,
86, 15–26.
Neal, N., Reynolds, B. and Robson, A.J., 1999. Acid neutralising capacity measurements within natural waters: towards a standardised approach. Sci. Total. Envir., 243, 233–241. NEGTAP, 2001. Transboundary Air Pollution: Acidification,
Eutrophication and Ground-level Ozone in the UK. 1st Report
of the National Expert Group on Transboundary Air Pollution. UK Department of the Environment, Transport and the Regions, London, (in press).
Patrick, S.T., Monteith, D.T. and Jenkins, A., 1995. UK Acid
Waters Monitoring Network: The first five years. Analysis and interpretation of results, April 1988—March 1993. ENSIS
Publishing, London, 320 pp.
Reuss, J.O., Christophersen, N. and Seip, H.M., 1986. A critique of models for freshwater and soil acidification. Water Air Soil
Pollut., 30, 909–930.
Sen, P.K., 1968. Estimates of the regression coefficient base on Kendall’s Tau. J. Amer. Statis. Assn., 63, 1379–1389. Stoddard, J., 1994. Long-term changes in watershed retention of
nitrogen. In: Environmental Chemistry of Lakes and Reservoirs, L.A. Baker. (Ed.), 223–284. American Chemical Society. Stoddard, J.L., Jeffries, D.S., Lükewille, A., Clair, T.A., Dillon,
P.J., Driscoll, C.T., Forsius, M., Johannessen, M., Kahl, J.S., Kellogg, J.H., Kemp, A., Mannio, J., Monteith, D.T., Murdoch, P.S., Patrick, S., Rebsdorf, A., Skjelkvåle, B.L., Stainton, M.P., Traaen, T., van Dam, H., Webster, K.E., Wieting, J. and Wilander, A., 1999. Regional trends in aquatic recovery from acidification in North America and Europe. Nature, 401, 575– 578.
Tipping, E. and Hurley, M.A., 1988. A model of solid-solution interactions in acid organic soils, based on the complexation properties of humic substances. J. Soil Sci., 39, 505–519. Wright, R.F., Norton, S.A., Brakke, D.F. and Frogner, T., 1988.
Experimental verification of episodic acidification of freshwaters by sea salts. Nature, 334, 422–424.
Wright, R.F., Alewell, C., Cullen, J., Evans, C.D., Marchetto, A., Moldan, F., Prechtel, A. and Rogora, M., 2001. Trends in nitrogen deposition and leaching in acid sensitive streams in Europe. Hydrol. Earth Syst. Sci., 5, 299–310.