HAL Id: hal-00317052
https://hal.archives-ouvertes.fr/hal-00317052
Submitted on 1 Jan 2003
HAL is a multi-disciplinary open access
archive for the deposit and dissemination of
sci-entific research documents, whether they are
pub-lished or not. The documents may come from
teaching and research institutions in France or
abroad, or from public or private research centers.
L’archive ouverte pluridisciplinaire HAL, est
destinée au dépôt et à la diffusion de documents
scientifiques de niveau recherche, publiés ou non,
émanant des établissements d’enseignement et de
recherche français ou étrangers, des laboratoires
publics ou privés.
Finland HF and Esrange MST radar observations of
polar mesosphere summer echoes
T. Ogawa, N. F. Arnold, S. Kirkwood, N. Nishitani, M. Lester
To cite this version:
T. Ogawa, N. F. Arnold, S. Kirkwood, N. Nishitani, M. Lester. Finland HF and Esrange MST radar
observations of polar mesosphere summer echoes. Annales Geophysicae, European Geosciences Union,
2003, 21 (4), pp.1047-1055. �hal-00317052�
Annales
Geophysicae
Finland HF and Esrange MST radar observations of polar
mesosphere summer echoes
T. Ogawa1, N. F. Arnold2, S. Kirkwood3, N. Nishitani1, and M. Lester2
1Solar-Terrestrial Environment Laboratory, Nagoya University, 3–13 Honohara, Toyokawa, Aichi 442–8507, Japan 2Department of Physics and Astronomy, University of Leicester, University Road, Leicester, LE1 7RH, UK 3Swedish Institute of Space Physics, Box 812, S–981 28 Kiruna, Sweden
Received: 12 April 2002 – Revised: 16 August 2002 – Accepted: 1 October 2002
Abstract. Peculiar near range echoes observed in summer
with the SuperDARN HF radar in Finland are presented. The echoes were detected at four frequencies of 9, 11, 13 and 15 MHz at slant ranges of 105–250 km for about 100 min. Inter-ferometer measurements indicate that the echoes are returned from 80–100 km altitudes with elevation angles of 20◦–60◦. Echo power (≤ 16 dB), Doppler velocity (between –30 and + 30 m s−1) and spectral width (≤ 60 m s−1) fluctuate with periods of several to 20 min, perhaps due to short–period at-mospheric gravity waves. When the HF radar detected the echoes, a vertical incidence MST radar, located at Esrange in Sweden (650 km north of the HF radar site), observed po-lar mesosphere summer echoes (PMSE) at altitudes of 80– 90 km. This fact suggests that the near range HF echoes are PMSE at HF band, although both radars did not probe a common volume. With increasing radar frequency, HF echo ranges are closer to the radar site and echo power becomes weaker. Possible mechanisms to explain these features are discussed.
Key words. Meteorology and atmospheric dynamics
(mid-dle atmosphere dynamics; thermospheric dynamics; waves and tides; instruments and techniques)
1 Introduction
Polar mesosphere summer echoes (PMSE) at northern high latitudes have been well studied using vertical incidence radars at VHF–UHF frequencies (see reviews by Cho and Kelley, 1993; R¨ottger, 1994; Cho and R¨ottger, 1997). Re-cently, vertical incidence HF systems (Karashtin et al., 1997; Kelley et al., 2002) and a dynasonde collocated with the EIS-CAT VHF radar (Lee et al., 2001; Liu et al., 2002) have also been utilized for PMSE observations. The Super Dual Auro-ral Radar Network (SuperDARN) HF radars at northern and southern high latitudes use oblique multiple beams to investi-gate the high latitude E- and F-region ionosphere (Greenwald
Correspondence to: T. Ogawa
et al., 1995). These radars are also capable of measuring neu-tral winds in the upper mesosphere and lower thermosphere (80–100 km) by detecting meteor echoes (Hall et al., 1997; Jenkins and Jarvis, 1999; Arnold et al., 2003).
The first HF radar observations of Antarctic upper meso-sphere summer echoes, being different from meteor echoes, have been recently reported by Ogawa et al. (2002) who ana-lyzed 11–MHz SuperDARN radar data from Syowa Station, Antarctica (69.0◦S, 39.6◦E). They showed that near range (180–315 km) echoes were characterized by a duration of less than 80 min, quasi–periodic oscillations of Doppler ve-locity and echo power with periods of 5–20 min, velocities between −40 and +20 m s−1and narrow spectral widths less than 40 m s−1. They then concluded, without other support-ing evidences, that these echoes were well explained by the PMSE hypothesis. Data analyzed by them were obtained during the normal SuperDARN operation (“common” mode: first range gate of 180 km, range resolution of 45 km and time resolution of 2 min) to detect ionospheric echoes. However, the common mode parameters, in particular, the first range gate and the range resolution, are not always suitable for the detailed study of PMSE that usually appear within altitudes of 80–90 km. To confirm that HF radars like SuperDARN can detect PMSE and to investigate generation mechanisms of oblique HF–PMSE, more sophisticated observations coor-dinated with other instruments have been required.
In this paper, we examine in detail near range upper meso-sphere echoes observed with an HF radar in Finland (one of the SuperDARN radars) on 8 August 1999. The HF echoes are compared with PMSE detected on the same day with a mesosphere–stratosphere–troposphere (MST) radar in Swe-den to demonstrate that oblique inciSwe-dence HF radars are suit-able for the PMSE study.
2 Observations
Echoes on which we focus in this paper were observed with the CUTLASS HF radar at Hankasalmi (62.3◦N, 26.6◦E) in Finland and a 52–MHz MST radar at Esrange (67.6◦N,
1048 T. Ogawa et al.: HF and MST radar observations of PMSE Esrange 70 65 0 Eo 20 40 60 70 N 60 65 0 15 5 Hankasalmi 200 km 400 1200 1000 800 600 o o o o o o o o
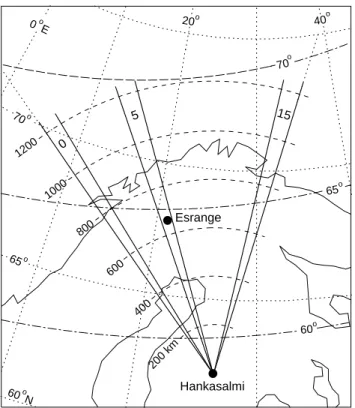
Fig. 1. Field of view of the Finland HF radar, covered with 16
narrow beams (beam numbers 0, 1, 2, . . ., 15), located at Han-kasalmi. Beam 5 looks toward Esrange in Sweden where the ES-RAD radar is located. Geomagnetic latitudes and ground ranges from Hankasalmi are indicated by dot-dashed and dashed curves, respectively.
21.0◦E), called the ESRAD radar, in Sweden (Chilson et al., 1999). Figure 1 shows the field of view (FOV) of the HF radar in geographic coordinates. The FOV is covered with 16 narrow beams (beam numbers 0, 1, 2, ldot s, 15; each beam width ∼3.5◦) over an azimuth sector of 52◦. Beam 5 looks toward Esrange, about 650 km from Hankasalmi, where the ESRAD radar is located.
On 8 August 1999, the Finland radar was operated in a special mode to investigate detailed meteor echo characteris-tics and neutral winds (Arnold et al., 2003); that is, the radar emitted sequentially four frequencies close to 9, 11, 13 and 15 MHz. At each frequency, the radar beam was scanned from beam 15 to 0 for about 35 s with a range resolution of 15 km and the first range gate of 60 km. On this day, the ES-RAD radar, having nearly vertical beams, performed routine observations of echo power and three dimensional velocity of scatterers over Esrange with time and altitude resolutions of 4 min and 300 m, respectively.
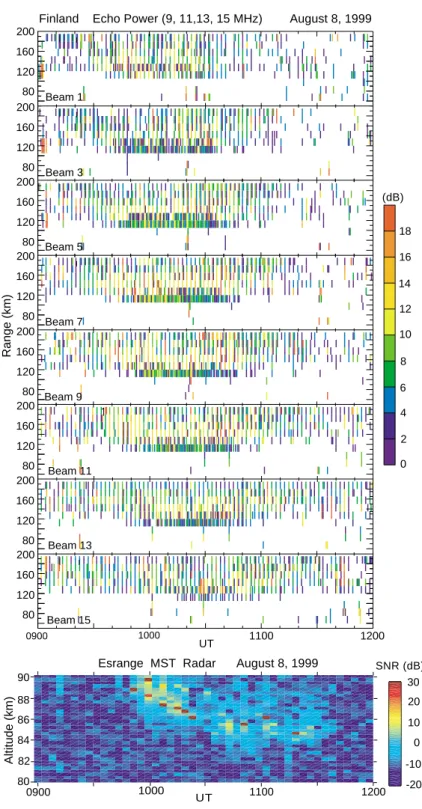
The upper panel in Fig. 2 displays time and slant range dis-tributions of the echo power, observed at four frequencies on eight beams (beams 1, 3, . . ., 15), of the Finland radar from 09:00 to 12:00 UT. In addition to meteor echoes appearing sporadically in range and time, a cluster of echoes is seen on all the beams; these exist mainly at 105–135 km ranges from 09:40 to 10:40 UT, and shift to later hours with increasing
beam number, meaning the eastward movement of the echo region (see Fig. 1).
The lower panel in Fig. 2 shows the distribution of the echo power observed at altitudes of 80–90 km with the ES-RAD radar. Clear PMSE appear first at around 09:45 UT at 89 km. The echo altitudes decrease with a rate of about 1.2 m s−1due to semi–diurnal tide (Williams et al., 1995), reach 85 km at around 10:40 UT and thereafter are almost station-ary until 11:40 UT when the echoes disappear. The vertical extent of the echo region is about 5 km. The echo powers vary in time and altitude with short periods, perhaps caused by short-period atmospheric gravity waves (Williams et al., 1989; R¨uster et al., 1996). Unfortunately, the echo powers are too weak to show detailed variations of the velocity com-ponents. From close inspection, however, we see that the vertical velocities below 88 km are less than −2 m s−1, be-ing consistent with the downward motion (−1.2 m s−1) of the echo region.
A comparison between the upper and lower panels in Fig. 2 indicates that the HF echoes at 105–135 km between 09:40 and 10:40 UT are coincident with the ESRAD PMSE and though the HF and ESRAD radar sites are 650 km apart, thus suggesting the HF echoes to be PMSE at HF band.
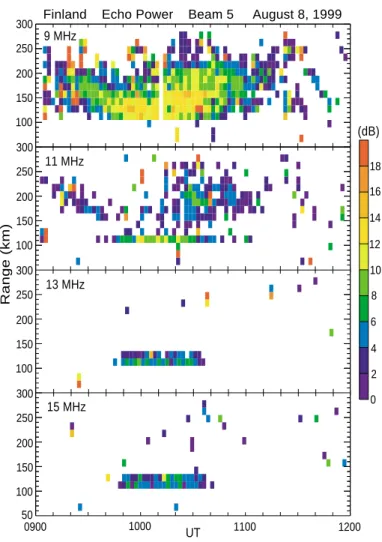
To investigate detailed characteristics of the HF echoes, Fig. 3 shows time and slant range distributions of the echo power observed at 9, 11, 13 and 15 MHz on beam 5 that looks toward Esrange. At 9 MHz, although meteor echoes are randomly distributed, a cluster of strong echoes (8–16 dB) appears at ranges of 105–225 km between 09:25 and 11:00 UT. At 11 MHz, the strong echo region (6–14 dB) is limited to within 105–120 km and around 200 km at about 10:30 UT. At 13 and 15 MHz, the echo regions with weak powers (≤ 10 dB) are mostly limited to within 105–135 km. Thus, the echo range and power are wider and stronger, re-spectively, with decreasing radar frequency.
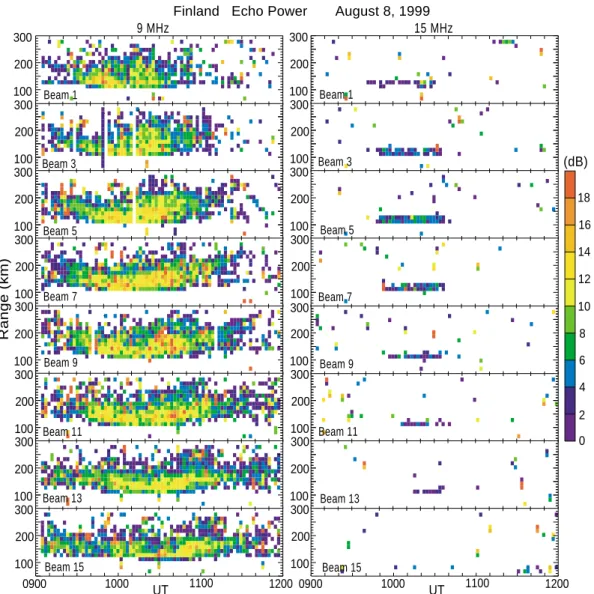
Figure 4 displays distributions of the echo power ob-served at 9 and 15 MHz on eight beams between 09:00 and 12:00 UT. At 9 MHz, the strong echo regions appear between 105 and 250 km from 09:20 UT (beam 1) until 11:30 UT (beam 15), during which time the ESRAD PMSE occurred (Fig. 2). With time, the echo ranges tend to shift toward the radar site at early hours and away from it at later hours. The echo region shifts slowly toward later hours with increasing beam number, as also seen in Fig. 2. At 15 MHz, weak echoes (≤ 10 dB) exist at 105–135 km and between 09:40 and 10:40 UT during which time the ESRAD PMSE region moves downward (Fig. 2). With increasing beam number, the echo region also shifts slowly toward later hours without changing the echo ranges.
It is estimated that the vertical pattern of the SuperDARN antenna array is quite broad with an average half power beamwidth of ∼ 30◦ (Greenwald et al., 1985). At 8 MHz, the sensitivity maximizes at an elevation angle (EL) of 35◦ whereas, at 20 MHz, this EL decreases to 15◦. This means that the Finland HF radar has a maximum gain at about EL = 33◦at 9 MHz and EL = 23◦at 15 MHz (Arnold et al., 2003). The sensitivity at EL’s larger than 60◦is believed to
Finland Echo Power (9, 11,13, 15 MHz) August 8, 1999 Range (km) 200 160 120 80 1000 UT (dB) Beam 1 Beam 15 Beam 13 Beam 11 Beam 9 Beam 7 Beam 5 Beam 3 0900 1100 1200 0 16 18 2 4 6 8 10 12 14 200 160 120 80 200 160 120 80 200 160 120 80 200 160 120 80 200 160 120 80 200 160 120 80 200 160 120 80 80 82 84 86 88 90
Esrange MST Radar August 8, 1999
-20 -10 0 10 20 30 SNR (dB) Altitude (km) 1000 UT 0900 1100 1200
Fig. 2. (Upper) Time and slant range
distributions of echo power observed at four frequencies on eight beams (beams 1, 3, ..., 15) of the Finland HF radar, and (lower) time and altitude distribution of echo power observed with the ESRAD radar between 09:00 and 12:00 UT on 8 August 1999.
be extremely low, being the reason why the HF radar could not detect echoes at ranges of 60–105 km (Fig. 2). Now we assume that HF echoes return from altitudes of 80–90 km (ESRAD–PMSE altitudes) without wave refraction during propagation. Then the observed slant ranges of 105–250 km at 9 MHz correspond to EL’s of 19◦– 59◦, within which the radar beam at 9 MHz has the maximum gain. Similarly, EL’s are between 36◦and 59◦for the observed ranges of 105–135 km at 15 MHz; these angles, however, are deviated from the
angle (23◦) with the maximum gain at 15 MHz, resulting in the weak echo power at 15 MHz as shown in Fig. 4. Actually, the 15 MHz antenna pattern has a secondary gain peak at 64◦ that is 8 dB down (two way of transmitting and receiving) from the main peak at 23◦. This secondary peak might also favor detecting the weak 15 MHz echoes.
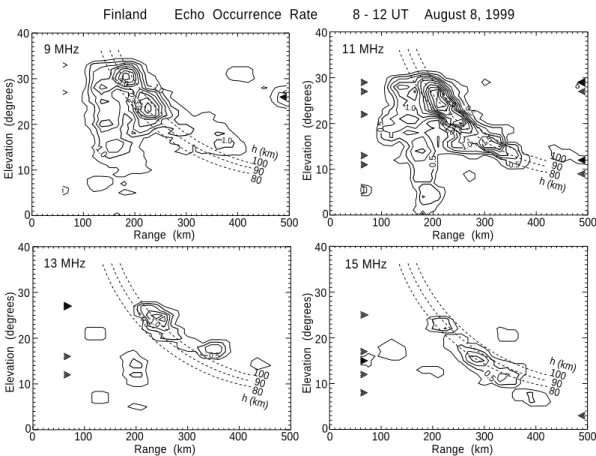
The Finland HF radar has a function of interferometry to measure angle–of–arrival of returned signal (Milan et al., 1997). Figure 5 shows contour maps of the echo occurrence
1050 T. Ogawa et al.: HF and MST radar observations of PMSE
Finland Echo Power Beam 5 August 8, 1999 9 MHz 11 MHz 13 MHz 15 MHz 300 250 200 150 100 1000 UT 0900 1100 1200 Range (km) 16 18 10 12 14 6 8 0 2 4 (dB) 300 250 200 150 100 300 250 200 150 100 300 250 200 150 100 50
Fig. 3. Time and slant range distributions of echo power at 9, 11, 13 and 15 MHz on beam 5.
rate at four frequencies as a function of range and EL. To make these maps, we selected EL data with echo powers ex-ceeding 20 dB (to avoid possible meteor echo contamina-tion) during 08:00–12:00 UT and then sorted the data into bins (one bin has a range gate of 15 km and an EL of 1◦) to perform a simple two-dimensional three-point smoothing of the data. The contour lines have intervals of 0.5 for 9 MHz and 0.25 for other frequencies. The relation between range and EL for constant altitude (h = 80, 90 and 100 km) is rep-resented by a dashed curve. Low occurrence rates at 13 and 15 MHz are due to the high threshold of 20 dB in selecting the data. The 9 and 11 MHz plots in Fig. 5 indicate that high occurrence rates exist between the curves of h = 80 and 100 km. The echoes at ranges beyond 250 km in these plots are not PMSE (see Fig. 3) but meteor echoes with powers above 20 dB that usually appear at 80–100 km altitudes. Also, the echoes beyond 140 km in the 13 and 15 MHz plots are me-teor echoes. It is noted that the interferometer is accurate to a few degrees, meaning that, for a range resolution of 15 km, it is impossible to determine echo altitude with a resolution better than about 10 km (Arnold et al., 2003).
EL’s shown in Fig. 5 do not always give true EL’s of ar-rival because of 2π ambiguity peculiar to an interferometer.
This ambiguity occurs when true EL’s exceed a threshold and calculated EL’s become lower than the true EL’s. According to Milan et al. (1997), on the central beam of the Finland radar, the maximum EL (MEL) below which no ambiguity takes place is around 35◦, 32◦, 29◦and 27◦for 9, 11, 13 and 15 MHz, respectively. This is the reason why no data points appear at EL’s beyond these MEL’s in Fig. 5. When returned signals have EL’s higher than MEL’s, aliasing occurs so that data are plotted at EL’s lower than the true values; for exam-ple, the 9 MHz rays with true EL’s of 37◦, 40◦, 45◦and 50◦ are misjudged as 12◦, 19◦, 28◦and 35◦, respectively. These considerations suggest that most data existing in the left of the h = 80 km curve and also at ranges less than 200 km are aliased and should be placed at higher EL’s beyond MEL’s. If this is not the case, the echoes should return from altitudes below about 70 km. Thus, we can conclude that almost all the echoes return from altitudes of 80–100 km, are consis-tent with the ESRAD PMSE altitudes in Fig. 2 and also with meteor echo altitudes.
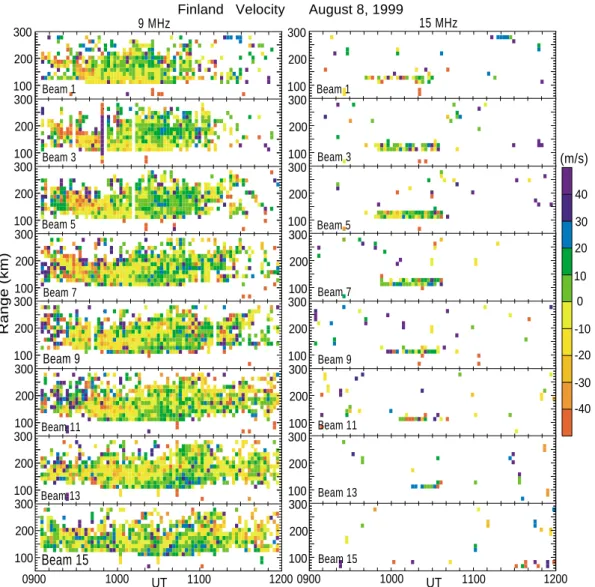
Time and slant range distributions of the line-of-sight Doppler velocity at 9 and 15 MHz are displayed in Fig. 6. Positive (negative) sign means motion toward (away) from the radar. It can be seen that the velocities fluctuate with
Finland Echo Power August 8, 1999 9 MHz 15 MHz Beam 1 200 Range (km) 100 300 200 100 300 200 100 300 200 100 300 200 100 300 200 100 300 200 100 300 200 100 300 1000 UT 0900 1100 1200 16 12 8 10 6 2 4 0 200 100 300 200 100 300 200 100 300 200 100 300 200 100 300 200 100 300 200 100 300 200 100 300 18 14 (dB) Beam 5 Beam 3 Beam 7 Beam 9 Beam 11 Beam 13 Beam 15 Beam 1 Beam 3 Beam 5 Beam 7 Beam 9 Beam 11 Beam 13 Beam 15 1000 UT 0900 1100 1200
Fig. 4. Time and slant range distributions of echo power at (left) 9 and (right) 15 MHz on eight beams (beams 1, 3, ..., 15).
magnitudes less than ± 30 m s−1. At 9 MHz, the veloci-ties are predominantly northward (southward) before (after) about 10:00 UT, probably caused by tidal motion of neutral winds.
Time variations of the echo power, Doppler velocity and spectral width at four frequencies at the range gate of 105– 120 km on beam 5 are plotted in Fig. 7 where the following is observed: (1) powers decrease with increasing frequency, (2) velocities are mostly within ± 20 m/s, (3) widths are less than 60 m s−1, which is characteristic of the widths of me-teor echoes to derive neutral winds (e.g. Arnold et al., 2001, 2003), when the power is strong, (4) the power, velocity and width fluctuate with periods of several to 20 min and (5) no particular correlation among three parameters exists. It is noted that the echoes are often contaminated with sporadic meteor echoes so that the short period fluctuations (less than, say, 5 min) of the three parameters do not always represent the PMSE-related fluctuations.
3 Discussion
The results are summarized as follows: (1) the Finland HF radar detected peculiar echoes at four frequencies at slant ranges of 105–250 km with EL’s of 20◦–60◦. (2) Angle-of-arrival measurements of echoes indicates echo altitudes of 80–100 km, (3) echo power (≤ 16 dB), Doppler velocity (≤ ± 30 m s−1) and spectral width (≤ 60 m s−1) fluctuate with periods of several to 20 min, (4) Echo ranges are 105– 250 km at 9 and 11 MHz while they are 105–135 km at 13 and 15 MHz and power decreases with increasing frequency, (5) At the same time as when the HF echoes were detected, the ESRAD MST radar, located at 650 km north of the HF radar site, observed typical PMSE lasting for about 100 min at altitudes of 80–90 km over Esrange.
The above items 1 and 5 suggest that the HF echoes are categorized as PMSE. The echo altitudes (item 2) are consis-tent with previous vertical incidence HF radar observations (Karashtin et al., 1997; Kelley et al., 2002).
1052 T. Ogawa et al.: HF and MST radar observations of PMSE
90 80 100
Finland Echo Occurrence Rate 8 - 12 UT August 8, 1999
9 MHz 15 MHz 13 MHz 11 MHz h (km) 1.0 1.0 2.03.0 0.5 0.5 0.5 0.5 0.5 1.01.5 2.0 1.0 0.5 3.0 1.0 1.0 1.0 1.5 0.5 90 80 100 h (km) 90 80 100 h (km) 90 80 100 h (km) 40 0 10 20 30 Elevation (degrees) Range (km) 0 100 200 300 400 500 Range (km) 0 100 200 300 400 500 Range (km) 40 0 10 20 30 Elevation (degrees) 40 0 10 20 30 Elevation (degrees) 40 0 10 20 30 Elevation (degrees) 0 100 200 300 400 500 Range (km) 0 100 200 300 400 500
Fig. 5. Contour maps of echo occurrence rate at four frequencies as a function of range and elevation angle. Contour lines have intervals of
0.5 for 9 MHz and 0.25 for other frequencies. Relation between range and elevation angle for constant altitude (h = 80, 90 and 100 km) is represented by dashed curve.
The echo characteristics (item 3) together with the echo duration (∼ 100 min) are quite similar to those of up-per mesosphere echoes detected at near ranges in summer with the SuperDARN radars (∼ 11 MHz) at Syowa Station, Antarctica (Ogawa et al., 2002), supporting that the Syowa echoes were PMSE. R¨ottger (1994) summarized some im-portant features of the Arctic PMSE observed with vertical incidence VHF radars as follows: (i) echoes are highly vari-able with typical temporal scales of 10 s to 5–20 min and their variations are barely correlated adjacent range gates separated by 1 km, (ii) Vertical velocities oscillate up to ± 5 m s−1with periods of 6–15 min and are not sinusoidal, (iii) echo amplitude variability is not clearly related to certain phases of the velocity oscillations, and (iv) spectral widths are extremely narrow but also large. R¨ottger (1994) sug-gested that short-period atmospheric gravity waves caused these features (e.g. Williams et al., 1989; R¨uster et al., 1996) which seems to be the case for our observations too.
We speculate, from items 1 and 5, that the HF-VHF PMSE region extended over 550 km, from over Esrange to 100 km north of the HF radar. Unfortunately, we have no informa-tion of the PMSE occurrence in between (over 400 km from Esrange to 250 km north of the HF radar) to confirm this. As shown in Figs. 2 and 4, the HF-PMSE appeared at ranges of 105–250 km on all the beams (item 1), which means that instantaneous zonal extension of the HF–PMSE region is at
least 150–200 km (Fig. 1). For the Syowa HF radar case, the meridional extension is estimated to be at least 180–300 km (Ogawa et al., 2002). In the past, Bremer et al. (1996) reported PMSE structures having zonal extensions of more than 130 km (Andenes and Tromsø in Norway) and Kirk-wood et al. (1995) studied those having meridional exten-sions of at least 200 km (Esrange and Tromsø).
The current HF–PMSE were detected in oblique directions with EL’s of 20◦– 60◦(item 1) while the Syowa PMSE were observed at 15◦–30◦ (corresponding to ranges of 180–315 km). Previous VHF–UHF observations of PMSE utilized vertical (or nearly vertical) pointing beams because PMSE were believed to be strongest for a vertical beam with a very high aspect sensitivity (e.g. Zecha et al., 2001). Using a VHF radar, Czechowsky et al. (1988) found highly aspect– sensitive echoes in the main vertical beam and non-aspect-sensitive echoes with two grating lobes at EL’s of 52◦ and
55◦; they suggested that there was a transition from domi-nant quasi-specular to more isotropic backscattering with in-creasing off-zenith angle. Thus, our HF echoes at EL’s less than 60◦seem to be caused by the rather “isotropic” target. This target might be also sensitive to vertical and oblique beams with EL’s larger than 60◦, as observed by Kelley et al. (2002) using an HF sounding system. The SuperDARN radars cannot detect echoes with EL ≥ 60◦where the antenna gain is extremely low; if the vertical sensitivity were not
Finland Velocity August 8, 1999 1000 UT 0900 1100 1200 (m/s) 200 Range (km) Beam 1 40 9 MHz 15 MHz 100 300 200 100 300 200 100 300 200 100 300 200 100 300 200 100 300 200 100 300 200 100 300 1000 UT 0900 1100 1200 200 100 300 200 100 300 200 100 300 200 100 300 200 100 300 200 100 300 200 100 300 200 100 300 20 30 0 10 -10 -30 -20 -40 Beam 3 Beam 11 Beam 9 Beam 7 Beam 5 Beam 13 Beam 15 Beam 1 Beam 3 Beam 9 Beam 5 Beam 7 Beam 11 Beam 13 Beam 15
Fig. 6. Time and slant range distributions of line-of-sight Doppler velocity at (left) 9 and (right) 15 MHz on eight beams (beams 1, 3, . . .,
15). Positive (negative) sign means motion toward (away from) the radar.
poor, PMSE would be observed at the 2nd and/or 3rd range gates (75–105 km) of the Finland radar.
The HF echo range and power depend on radar frequency (item 4). In explaining this fact, we take into account fac-tors such as wavenumber spectrum of radar reflectivity, as-pect sensitivity of scatterers (that is, the scattering is much higher in the vertical direction than from off–vertical) and in-strumental effect (antenna gain pattern in the vertical plane). Using a theoretical beam pattern, it was inferred in the pre-vious section that the 9 MHz echoes with EL’s of 19◦– 59◦
were detected by the main antenna lobe (EL ' 33◦), while the 15 MHz echoes had EL’s of 36◦– 59◦that are deviated from the main lobe direction (EL ' 23◦): we suggested that the 15 MHz echoes might be also detected with a side lobe (8 dB down) at ∼ 64◦. Thus, we suppose the following sce-narios to explain the results. (1) The radar reflectivity be-comes smaller at higher wavenumber (frequency) (e.g. Cho and Kelley, 1993) to make echoes are detectable at 9 MHz (Bragg wavelength = 17 m) but not for 15 MHz (10 m) with
the respective HF main lobe. (2) PMSE may be more as-pect sensitive at higher wavenumber (this sensitivity is very high at VHF–UHF; Czechowsky et al., 1988; Zecha et al., 2001); if this is the case, 15 MHz echoes are detectable only at higher elevation angles. Checking these possibilities is not easy, however, mainly because the frequency dependencies of the HF radar antenna gain pattern and hardware system are not well known. Moreover, the HF radar for the current observations had a range resolution of 15 km, corresponding to altitude resolutions of 5–13 km at EL’s of 20◦– 60◦. Ob-viously, these altitude resolutions are too large to reveal the detailed physical processes of the HF–PMSE.
Note that the northward semi–diurnal component of neu-tral winds, derived from meteor echo observations using the Finland radar, has a maximum of about −20 m s−1 at about 10:00 UT and of −15 m s−1at about 22:00 UT in July (Arnold et al., 2003). Thus, the timing (09:30–11:30 UT) of our PMSE occurrence seems to be close to the maximum phase of semi-diurnal tide (Williams et al., 1995).
1054 T. Ogawa et al.: HF and MST radar observations of PMSE
Finland Beam 5 August 8, 1999
9 MHz 15 MHz 13 MHz 11 MHz Power (dB) 1000 UT 0930 1100 20 Range : 105 - 120 km Velocity (m/s) 5 10 15 1030 0 40 -20 0 20 100 80 20 40 60 Width (m/s) ( ) ( ( ) ) 20 5 10 15 20 5 10 15 20 5 10 15 -40 40 -20 0 20 -40 40 -20 0 20 -40 40 -20 0 20 -40 100 80 20 40 60 100 80 20 40 60 100 80 20 40 60 0
Fig. 7. Time variations of echo power (solid line), Doppler velocity
(dashed line) and spectral width (dot-dashed line) at four frequen-cies at range gate of 105–120 km on beam 5.
4 Conclusions
Peculiar near range echoes, detected at 9, 11, 13 and 15 MHz with the Finland HF radar in summer, can be identified as PMSE at HF frequencies. This conclusion seems to be sup-ported by concurrent PMSE observations with the Esrange MST radar located at 650 km north of the HF radar site. HF echo power, Doppler velocity and spectral width fluctuate with periods of several to 20 min, perhaps due to short-period gravity waves. These characteristics are quite similar to those of upper mesosphere summer echoes first detected with the Antarctic HF radars. Angle-of-arrival measurements of HF echoes indicates echo altitudes of 80–100 km, being con-sistent with the MST–PMSE altitudes. HF echo range and power depend on radar frequency. At present, we have no clear mechanisms to explain this fact and we speculate that this is caused by frequency dependencies of radar reflectivity, aspect sensitivity and the radar hardware system. Obviously, more observations and analyses of HF–PMSE are required in the future to understand the nature of scatterers causing oblique HF echoes.
Finally, as exemplified in this paper, sophisticated Super-DARN operation, using short range resolution (15 km), first range gate (60 km) and multiple frequencies, is quite use-ful for the HF–PMSE study. Many SuperDARN radars have been routinely working under the common mode operation to observe the northern and southern high latitude ionosphere.
We believe that these radars also provide data that are use-ful for exploring the global climatology, long-term variability and north-south asymmetry of PMSE occurrences.
Acknowledgements. The authors wish to thank the team of the
Ra-dio and Space Plasma Physics group at the University of Leicester who constructed, deployed and operated the CUTLASS HF radars. The ESRAD radar is jointly funded by the Swedish Space Corpora-tion and the Swedish Research Council. N. F. Arnold was supported by an advanced fellowship from the UK Particle Physics and As-tronomy Research Council and CUTLASS operations were funded by PPARC grant RP16021.
Topical Editor, D. Murtagh, thanks G. Kelly and another referee for their help in evaluating this paper.
References
Arnold, N. F., Robinson, T. R., Lester, M., Byrne, P. B., and Chap-man, P. J.: Super Dual Auroral Radar Network observations of fluctuations in the spectral distribution of near range meteor echoes in the upper mesosphere and lower thermosphere, Ann. Geophysicae, 19, 425–434, 2001.
Arnold, N. F., Cook, P. A., Robinson, T. R., Lester, M., Chapman, P. J., and Mitchell, N.: Validation of D-region Doppler drift winds measured by the SuperDARN Finland HF radar over an annual cycle using the Kiruna VHF meteor radar, Ann. Geophysicae, in press, 2003.
Bremer, J., Hoffmann, P., Manson, A. H., Meek, C. E., R¨uster R., and Singer, W.: PMSE observations at three different frequencies in northern Europe during summer 1994, Ann. Geophysicae, 14, 1317–1327, 1996.
Chilson, P., Kirkwood, S., and Nilsson, A.: The Esrange MST radar: A brief introduction and procedure for range validation using bal-loons, Radio Sci., 34, 427–463, 1999.
Cho, J. Y. N. and Kelley, M. C.: Polar mesosphere summer radar echoes: Observations and current theories, Rev. Geophys., 31, 243–265, 1993
Cho, J. Y. N. and R¨ottger, J.: An updated review of polar meso-sphere summer echoes: Observation, theory, and their relation-ship to noctilucent clouds and subvisible aerosols, J. Geophys. Res., 102, 2001–2020, 1997.
Czechowsky, P., Reid, I. M., and R¨uster, R.: VHF radar measure-ments of the aspect sensitivity of the summer polar mesopause
echoes over Andenes (69◦N, 16◦E), Norway, Geophys. Res.
Lett., 15, 1259–1262, 1988.
Greenwald, R. A., Baker, K. B., Hutchins, R. A., and Hanuise, C.: An HF phased-array radar for studying small-scale structure in the high-latitude ionosphere, Radio Sci., 20, 63–79, 1985. Greenwald, R. A., Baker, K. B., Dudeney, J. R., Pinnock, M., Jones,
T. B., Thomas, E. C., Villain, J.-P., Cerisier, J.-C., Senior, C., Hanuise, C., Hunsucker, R. D., Sofko, G., Koehler, J., Nielsen, E., Pellinen, R., Walker, A. D. M., Sato, N., and Yamagishi, H.: DARN/SuperDARN: A global view of the dynamics of high-latitude convection, Space Sci. Rev., 71, 761–796, 1995. Hall, G. E., MacDougall, J. W., Moorcroft, D. R., St.-Maurice,
J.-P., Manson, A. H., and Meek, C. E.: Super Dual Auroral Radar Network observations of meteor echoes, J. Geophys. Res., 102, 14 603–14 614, 1997.
Jenkins, B. and Jarvis, M. J.: Mesospheric winds derived from Su-perDARN radar meteor echoes at Halley, Antarctica, Earth Plan-ets Space, 51, 685–689, 1999.
Karashtin, A. N., Shlyugaev, Yu. V., Abramov, V. I., Belov, I. F., Berezin, I. V., Bychkov, V. V., Eryshev, E. B., and Komrakov, G. P.: First HF radar measurements of summer mesopause echoes at SURA, Ann. Geophysicae, 15, 935–941, 1997.
Kelley, M. C., Huaman, M. M., Chen, C. Y., Ramos, C., Djuth, F., and Kennedy, E.: Polar mesosphere summer echo observations at HF frequencies using the HAARP Gakona Ionospheric Ob-servatory, Geophys. Res. Lett., 29(12), 10.1029/2001GL013411, 2002.
Kirkwood, S., Cho, J., Hall, C. M., Hoppe, J.-P., Murtagh, D. P., Stegman, J., Swartz, W. E., van Eyken, A. P. Wannberg, G., and Witt, G.: A comparison of PMSE and other ground–based obser-vations during the NLC–91 campaign, J. Atmos. Terr. Phys., 57, 35–44, 1995.
Lee, C. C., Liu, J. Y., Pan, C. J., and Liu, C. H.: Doppler velocities obtained by the EISCAT VHF radar and the dynasonde during the PMSE95 campaign, J. Atmos. Solar-Terr. Phys., 63, 193– 199, 2001.
Liu, J. Y., Pan, C. J., and Lee, C. C.: VHF radar and MF/HF dy-nasonde observations during polar mesosphere summer echoes conditions at EISCAT, Earth Planets Space, 54, 691–698, 2002. Milan, S. E., Jones, T. B., Robinson, T. R., Thomas, E. C., and
Yeoman, T. K.: Interferometric evidence for the observation of
ground backscatter originating behind the CUTLASS coherent radars, Ann. Geophysicae, 15, 29–39, 1997.
Ogawa, T., Nishitani, N., Sato, N., Yamagishi, H., and Yuki-matu, A. S.: Upper mesosphere summer echoes detected with the Antarctic Syowa HF radar, Geophys. Res. Lett., 29(7), 10.1029/2001GL014094, 2002.
R¨ottger, J.: Polar mesosphere summer echoes: Dynamics and aeronomy of the mesosphere, Adv. Space Res., 14, (9)123– (9)137, 1994.
R¨uster, R., Czechowsky, P., Hoffmann, P., and Singer, W.: Gravity wave signatures at mesospheric heights, Ann. Geophysicae, 14, 1186–1191, 1996.
Williams, P. J. S., van Eyken, A. P., Hall, C., and R¨ottger, J.: Mod-ulation in the polar mesosphere summer echoes and associated with atmospheric gravity waves, Geophys. Res. Lett., 16, 1437– 1440, 1989.
Williams, P. J. S., Jones, G. O. L., Palmer, J. R., and Rishbeth, H.: The association of polar mesosphere summer echo layers with tidal modes, Ann. Geophysicae, 13, 454–457, 1995.
Zecha, M., R¨ottger, J., Singer, W., Hoffmann, P., and Keuer, D.: Scattering properties of PMSE irregularities and refinement of velocity estimates, J. Atmos. Solar–Terr. Phys., 63, 201–214, 2001.