HAL Id: hal-00461660
https://hal.archives-ouvertes.fr/hal-00461660
Submitted on 6 Apr 2010HAL is a multi-disciplinary open access archive for the deposit and dissemination of sci-entific research documents, whether they are pub-lished or not. The documents may come from teaching and research institutions in France or abroad, or from public or private research centers.
L’archive ouverte pluridisciplinaire HAL, est destinée au dépôt et à la diffusion de documents scientifiques de niveau recherche, publiés ou non, émanant des établissements d’enseignement et de recherche français ou étrangers, des laboratoires publics ou privés.
Energy transfer up-conversion in Tm3+-doped silica
fiber
David A. Simpson, Gregory Baxter, Stephen F. Collins, W.E.K. Gibbs,
Wilfried Blanc, Bernard Dussardier, Gérard Monnom
To cite this version:
David A. Simpson, Gregory Baxter, Stephen F. Collins, W.E.K. Gibbs, Wilfried Blanc, et al.. Energy transfer up-conversion in Tm3+-doped silica fiber. Journal of Non-Crystalline Solids, Elsevier, 2005, 352, pp.136-141. �hal-00461660�
Energy transfer up-conversion in Tm
3+- doped silica fibre
D. A. Simpson, G. W. Baxter and S. F. Collins
Centre for Telecommunications and Micro-Electronics, Optical Technology Research Laboratory, Victoria University, PO Box 14428 Melbourne, VIC 8001, Australia.
W. E. K. Gibbs
Centre for Imaging and Applied Optics, Swinburne University, VIC 3122, Australia.
W. Blanc, B. Dussardier and G. Monnom
Laboratoire de Physique de la Matière Condensée UMR6622, Université de Nice - Sophia Antipolis Parc Valrose, 06108 Nice, Cedex 2, France.
Abstract
A study of the mechanisms responsible for the infra-red to near infra-red up-conversion in thulium doped silica fibres is presented. Up-conversion luminescence was observed from the 3H
4 level of Tm3+ under
1586 nm pumping into the 3F
4 level. The quadratic dependence of the up-conversion luminescence at 800
nm on the 1800 nm luminescence from the 3F
4 level confirms that the 3H4 level is populated by a two
photon process. Two possible processes are proposed as mechanisms responsible for the up-conversion: excited state absorption and energy transfer up-conversion. The decay characteristics of the luminescence from the 3H
4 level were studied under direct and indirect pumping at 786 and 1586 nm, respectively. By
comparing the decay waveforms to the solution of a simple set of rate equations, the energy transfer up-conversion process (3F
4,3F4→3H4,3H6) is established at Tm2O3 concentrations greater than 35 ppm mol.
PACS codes: 31.70.Hq; 32.70.Cs; 33.50.-j
1. Introduction
The broadband emission from the 3H
4→3F4 transition in Tm3+ has been identified as one of the more
promising candidates for optical amplification in the telecommunication S-Band (1470 - 1530 nm). Amplification in the S-band region has been observed in many Tm3+ doped fluoride crystals [1-4]. The
low phonon energies associated with fluoride crystals allow many of the thulium transitions to operate with quantum efficiencies near 100%. When doped into glasses with higher phonon energies such as silica, the quantum efficiencies of these transitions are reduced, in some cases, to a few percent. Although recent work in thulium doped silica fibres showed a four fold increase in the quantum efficiency of the 3H
4 → 3F4 amplifying transition through the incorporation of aluminium, this is still considerably
less than the almost 100% efficiency observed in Tm3+ doped fluoride glasses. If further improvements in
the efficiency of the thulium transitions are to be realised in silica glass, an understanding of the spectroscopic processes involved in the related levels is required.
Extensive studies have been carried out on the cross relaxation process (3H
4,3H6→3F4,3F4) originating
from the 3H
4 level in various thulium doped crystals and oxide glasses [5-7]. However, little attention has
been given to the energy transfer up-conversion process originating from the 3F
4 level (3F4,3F4→3H4,3H6).
This process has been observed in thulium doped crystals [8-10]. However, in some cases, the sharp spectral lines associated with these materials results in a lack of spectral overlap between the 3F
4→3H4
absorption and the 3F
4→3H6 emission cross section, which reduces the efficiency of the energy transfer
process. In silica glasses, where the energy levels are inhomogeneously broadened, the spectral overlap between the absorption and emission cross sections is expected to be much stronger and therefore the effect of energy transfer up-conversion is expected to be much greater. Work done in heavily thulium doped silica fibres by Jackson has attributed quenching of the 3F
4 level’s population to the
(3F
(3F
4,3F4→3H5,3H6) [11]. Here the energy transfer up-conversion process (3F4,3F4→3H4,3H6) is established
and studied in thulium doped silica fibres at low Tm2O3 concentrations.
Room temperature up-conversion luminescence has been observed from the 3H
4 level of thulium under
1586 nm pumping into the 3F
4 level. Spectroscopic methods were used to investigate the mechanisms
responsible for this up-conversion in fibre samples with three different concentrations (35, 105 and 515 ppm mol Tm2O3).
2. Experimental Details
The samples used in this investigation were fabricated using the modified chemical vapour deposition and solution doping techniques. The three alumino-silicate samples had Tm2O3 concentrations of 35, 105 and
515 ppm mol and contained 4.8, 4.5 and 4.6 mol% of Al2O3, respectively. The Tm2O3 concentration was
estimated by measuring the absorption peak at 780 nm and using a cross-section value of (8.7×10⁻²⁵ m2)
[12]. The concentration in at/m3 was converted into ppm mol assuming that the silica density is 2.2 [13].
A York S14 index profiler was used to obtain the refractive index profiles of the fibre samples and the Al2O3 concentrations were estimated from these profiles since Al2O3 has been shown to increase the
optical index of silica by 2.3×10⁻³ per mol % [14]. It was assumed that the concentration of Tm3+ did not
contribute significantly to the index difference. No other standard modifiers of silica, such as Ge, P, F, were used in the fabrication of these samples.
A pigtailed Alcatel laser diode provided excitation at 1586 nm to study the steady state luminescence intensities. An Avtech laser driver ran the diode from 1-15 mW in quasi-cw mode with 12.5 ms pulses at a repetition rate of 40 Hz to allow for lock-in detection. As the 12.5 ms pulse length is at least 10 times longer than the longest rise time of any excited energy level in the thulium-doped silica system, the intensity of the luminescence at 800 and 1800 nm represents the intensity under steady state conditions.
The luminescence was collected immediately after the splice to the excitation source with a collimating lens transverse to the doped fibre. Sample lengths were kept to 50 mm to minimise the effects of amplified spontaneous emission and re-absorption. The up-conversion luminescence at 800 nm was directed through a 900 nm short pass filter and detected using a Hamamatsu R928 photomultiplier. The luminescence at 1800 nm was directed through a 1500 nm long pass filter and detected using a Thorlabs (FG20) InGaAs photodiode.
Decay measurements were carried out using the same arrangement as described above, but with the lock-in amplifier replaced by a Tektronix TDS320 digital oscilloscope. Lumlock-inescence decay waveforms were recorded under 786 and 1586 nm pump excitation. The 12.5 ms pulses at a repetition rate of 40 Hz at 786 nm were provided by a Spectra Physics argon-ion pumped Ti-sapphire laser in conjunction with an acousto-optic modulator. The 800 nm and 1800 nm detection systems had response times of 0.8 and 15 µs, respectively. The luminescence decay waveforms were averaged 256 times before being sent to a PC for processing.
3. Results:
The counter propagating up-conversion luminescence spectrum from the 3H
4 level of thulium when
excited at 1586 nm is shown in Figure 1. The emission spectrum observed is characteristic of the 3H 4
level. The large dip in the spectrum at ~ 795 nm, is assigned to the strong ground state absorption (3H
6→3H4).
The origin of this luminescence lies in two possible processes, excited state absorption (ESA) and energy transfer up-conversion (ETU). In ESA, a pump photon excites an ion to the 3F
4 level. The excited ion
then absorbs the energy of another pump photon promoting itself to the 3H
4 level. In ETU, two pump
photons excite two ions to the 3F
promoting one excited ion to the 3H
4 level, whilst demoting the other ion to the 3H6 ground state (see
Figure 2). It should be noted that there is an energy mismatch between the 3F
4→ 3H4 absorption and the 3F
4 → 3H6 emission that necessitates the assistance of phonons. The minimum energy gap required to
complete the transition in Tm3+:YCL
3 was -698 cm-1 (the negative sign indicating an endothermic
process) [15], in silica glass this energy gap can be bridged with the absorption of just one vibrational mode of the glass.
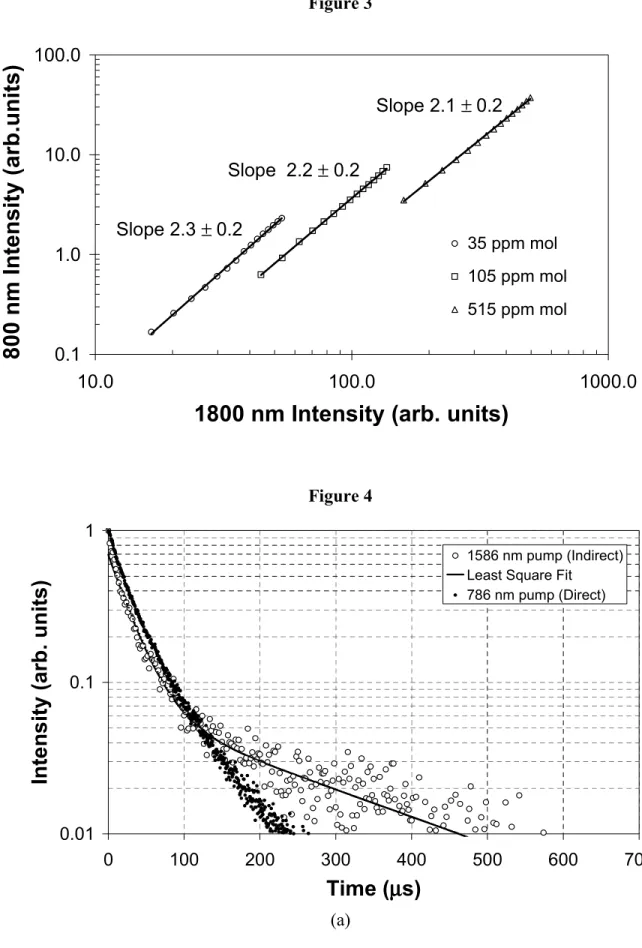
Both processes illustrated in Figure 2 require two pump photons in the process of exciting one ion to the
3H
4 level. Hence, the luminescence from the 3H4 level at 800 nm should be proportional to the square of
the population in the 3F
4 level. i.e. proportional to the square of the luminescence from this level at 1800
nm. This was investigated by measuring the steady state luminescence intensities at 800 and 1800 nm over a range of pump powers. Figure 3 shows the dependence of the 800 nm luminescence on the 1800 nm luminescence for the three samples over the available range of pump powers. The approximate quadratic dependence observed for all samples is consistent with the 3H
4 level being populated by a two
photon process.
3.1 Direct pumping of the 3H
4 level
Luminescence decay waveforms from the 3H
4 level were recorded under direct excitation at 786 nm with
an incident pump power of 1.6 mW. The luminescence decay waveforms were non-exponential; therefore the lifetime of the 3H
4 level was taken as the time required for the fluorescence intensity to decrease to 1/e
of its peak intensity. This non-exponential behaviour has been observed in many other thulium doped glasses [5, 16, 17]. In many cases, the non exponential nature of the decay is a result of energy transfer processes and diffusion occurring from the 3H
4 level [18]. However,Lincoln states that in the absence of
broadening of the atomic levels in silica [19]. The 1/e lifetime for each sample including the fitting errors is listed in Table 1.
The measured lifetime of the 3H
4 level in these thulium samples is considerably less than the radiative
lifetime expected in silica glass (~ 650 µs) [20], due to the dominance of multi-phonon decay from the
3H
4 level to the 3H5 (then the 3F4 level). This multi-phonon decay limits the radiative quantum efficiency
of the 3H
4 level to ~ 5 %.
It is noted that the decay constant of the 3H
4 level does not appear to be affected by the well known cross
relaxation process (3H
4,3H6→3F4,3F4). If this cross relaxation process was operating efficiently in these
samples a decrease in the 3H
4 level’s decay constant with increasing concentration would be evident.
Recent work on these types of silica fibres has shown that the decay constant of the 3H
4 level is more
sensitive to the amount of aluminium incorporated into the fibre’s core [21].
3.2 Indirect pumping of the 3H
4 level
Indirect pumping of the 3H
4 level was achieved by exciting the fibre samples at 1586 nm. The
up-conversion luminescence decay characteristics were studied to ascertain the mechanism/s responsible for populating the 3H
4 level. Figure 4 shows the semi-log plot of the up-conversion luminescence decay
under 1586 nm pumping for each sample and, as a comparison, the decay of the 3H
4 level under direct
excitation is presented also.
The luminescence decay from the 3F
4 level was also studied under 1586 nm pumping; the decay from that
level at 1800 nm was characterised by a single exponential. The measured 3F
4 lifetime for each sample is
4. Discussion:
The behaviour of the up-conversion luminescence when the pump excitation has been removed can be described by considering a simple set of rate equations relating the populations of the 3F
4 and 3H4 energy levels, namely
c
n
W
n
dt
dn
ETU 2 1 1 1 1=
−
−
τ
(1)c
n
W
n
dt
dn
ETU 2 1 2 2 22
1
+
−
=
τ
, (2)where n1 and n2 represent the normalised population of the 3F4 and 3H4 levels respectively, c is the Tm3+
concentration, WETU is the energy transfer up-conversion co-efficient and τ1 and τ2 are the lifetimes of the 3F
4 and 3H4 levels, respectively.
These rate equations involve several assumptions. Firstly, it has been assumed that any population in the
3H
5 level will relax rapidly to the 3F4 level in a time scale which is short in comparison to the other decay
times involved; thus the presence of the 3H
5 level has been ignored. Secondly, by representing the ETU
process with the term
W
ETUn
12 we have ignored any energy migration processes, which is justifiable since this process occurs on a much smaller time scale (~10-10 s) [22]. Thirdly, it was assumed that ESA of thepump and signal photons can be ignored due to the relatively low ESA cross sections at the respective wavelengths. Peterka et al [23], have estimated the ESA cross section at the pump and signal wavelengths (1586 and 1800 nm) to be ~ 3×10-31 and ~ 0 m2, respectively. Although there is a relatively
large error associated with these values, it suggests that ESA does not play a significant role in the up-conversion process at these wavelengths.
It has been noted in section 3.2 that the luminescence decay from the 3F
4 level was a single exponential,
implying 1
τ
n
− = 1 10 1 n exp t
τ
n , (3)where n10 represents the initial population of the 3F4 level after the pump excitation is removed.
By inserting equation (3) into (2) we can solve for n2, giving
− − + − − − = − − − − 1 1 1 1 2 2 1 1 1 2 20 2 2 exp 2 exp 2
τ
τ
τ
τ
τ
τ
t A t A n n , (4) where 2 2 10 c n W A= ETU , and n20 represents the initial population of the 3H4 level after the pump excitation
is removed.
From Equation (4) we see that the up-conversion luminescence, resulting from ETU, decays as a double exponential with two characteristic time constants: one being equal to the lifetime of the 3H
4 level (τ2) and
the other being equal to (τ1/2) i.e. one half of the 3F4 level lifetime.
It is clear in Figure 4 that the up-conversion luminescence decay has two exponential components. A least squares fit to Equation (4) was applied to the up-conversion luminescence decay waveforms, with τ2
being the 1/e lifetime for the 3H
4 level (obtained under direct pumping), leaving τ1 and A as the fitting
parameters. The least squares fit was in excellent agreement with the measured waveforms. Table 1 shows that the fitted and measured values of τ1 are also in good agreement verifying the validity of this
analysis.
The ETU exhibited in these samples suggests the presence of ion pairs or clusters. These results imply that, even at low Tm2O3 concentrations, ion pairs can still be formed in alumino-silicate glasses. The
pairs. The spectroscopic measurements reported here do not allow the determination of the relative strength of the ETU process; this measurement is planned.
5. Conclusion
Up-conversion luminescence from the 3H
4 level in thulium-doped silica fibres, when excited at 1586 nm
has been identified. The up-conversion luminescence from the 3H
4→3H6 transition showed a quadratic
dependence on the luminescence from the 3F
4→3H6 transition, indicating a two photon up-conversion
process. The double exponential decay of the up-conversion luminescence confirmed that ETU was operating at Tm2O3 concentrations as low as 35 ppm mol. The fitted value of τ1 obtained from the rate
equation analysis is in good agreement with the measured τ1 value for all samples studied. The presence
of ETU at Tm2O3 concentrations greater than 35 ppm mol will be an important consideration when
designing and fabricating active thulium-doped silica fibre devices in the future.
Acknowledgements
The authors gratefully acknowledge helpful discussions with Dr. Pavel Peterka from the Institute of Radio Engineering and Electronics in Prague, Czech Republic. This work was supported by the Australian Research Council, and Centre National de la Recherche Scientifique, in France.
References
[1]
S. Tanabe, T. Tamaoka, J. Non-Cryst. Solids 326-327 (2003) 283
[2]
M. Shi Qing, W. Sun Fat, E. Y. B. Pun, C. Po Shuen, J. Opt. Soc. Am. B, Opt. Phys. 21
(2004) 313
[3]
L. Dong Jun, H. Jong, P. Se Ho, J. Non-Cryst. Solids 331 (2003) 184
[4]
A. M. Jurdyc, G. Rault, W. Meffre, J. Le Person, S. Guy, F. Smektala, J. L. Adam, Proc.
SPIE - Int. Soc. Opt. Eng. 4645 (2002) 79
[5]
A. S. S. de Camargo, S. L. de Oliveira, D. F. de Sousa, L. A. O. Nunes, D. W. Hewak, J.
Phys., Condens. Matter. 14 (2002) 9495
[6]
I. R. Martin, V. D. Rodriguez, R. Alcala, R. Cases, J. Non-Cryst. Solids 161 (1993) 294
[7]
A. Sennaroglu, A. Kurt, G. Ozen, J. Phys., Condens. Matter. 16 (2004) 2471
[8]
J. B. Gruber, M. E. Hills, R. M. Macfarlane, C. A. Morrison, G. A. Turner, G. J. Quarles,
G. J. Kintz, L. Esterowitz, Phys. Rev. B, Condens. Matter 40 (1989) 9464
[9]
J. B. Gruber, M. D. Seltzer, M. E. Hills, S. B. Stevens, C. A. Morrison, J. Appl. Phys. 73
(1993) 1929
[10]
L. B. Shaw, R. S. F. Chang, N. Djeu, Phys. Rev. B, Condens. Matter 50 (1994) 6609
[11]
S. D. Jackson, Opt. Commun. 230 (2004) 197
[12]
D. C. Hanna, I. R. Perry, J. R. Lincoln, J. E. Townsend, Opt. Commun. 80 (1990) 52
[13]
H. Kakiuchida, N. Shimodaira, E. H. Sekiya, K. Saito, A. J. Ikushima, Appl. Phys. Lett. 86
(2005) 161907
[14]
G. G. Vienne, W. S. Brocklesby, R. S. Brown, Z. J. Chen, J. D. Minelly, J. E. Roman, D.
N. Payne, Opt. Fiber Technol., Mater. Devices Syst. 2 (1996) 387
[15]
J. Ganem, J. Crawford, P. Schmidt, N. W. Jenkins, S. R. Bowman, Phys. Rev., B, Condens,
Matter Mater. Phys. 66 (2002) 245101
[16]
M. Bettinelli, F. S. Ermeneux, R. Moncorge, E. Cavalli, J. Phys., Condens. Matter. 10
(1998) 8207
[17]
J. R. Lincoln, W. S. Brocklesby, F. Cusso, J. E. Townsend, A. C. Tropper, A. Pearson, J.
Lumin. 50 (1991) 297
[18]
A. Brenier, C. Pedrini, B. Moine, J. L. Adam, C. Pledel, Phys. Rev. B, Condens. Matter 41
(1990) 5364
[19]
J. Lincoln, University of Southampton, (1992)
[20]
M. J. F. Digonnet, Rare earth doped fiber lasers and amplifiers, 2nd Ed., Marcel Dekker,
Inc., New York, (2001)
[21]
B. Faure, W. Blanc, B. Dussardier, G. Monnom, P. Peterka, Technical Digest of Optical
Amplifiers and Their Applications, San Francisco, (2004), OWC2
[22]
D. L. Drexter, J. H. Schulman, 22 (1964) 1063
[23]
P. Peterka, B. Faure, W. Blanc, M. Karasek, B. Dussardier, Opt. Quantum Electron. 36
(2004) 201
List of Tables:
Table 1: Measured and fitted lifetimes of the
3H
4and
3F
4energy levels under direct and indirect
pumping.
Tm
2O
3conc.(ppm mol)
35
105
515
3H
4lifetime (
µs)
λ
p= 786 nm
(
τ
2)
(measured)
28.3
± 0.7 28.2 ± 0.6 31.0 ± 0.5
(
τ
1)
(fitted)
482
± 8
466
± 2
460
± 2
3F
4lifetime (
µs)
λ
p= 1586 nm
(
τ
1)
(measured)
475 ± 3
459 ± 2
473 ± 2
List of figures:
Figure 1
0
0.2
0.4
0.6
0.8
1
760
780
800
820
840
Wavelength (nm)
Sign
al (arb
. un
its)
Up-coversion luminescence Ground State Absorption 3H 6 ® 3H4 3H 4 ® 3H6Figure 2
Pump
1586 nm
ETU
1800 nm
800 nm
1470 nm
ESA
3H
4 3H
5 3F
4 3H
6Figure 3
Slope 2.3
± 0.2
Slope 2.2
± 0.2
Slope 2.1
± 0.2
0.1
1.0
10.0
100.0
10.0
100.0
1000.0
1800 nm Intensity (arb. units)
800 nm Intensity (ar
b
.units)
35 ppm mol 105 ppm mol 515 ppm molFigure 4
0.01 0.1 1 0 100 200 300 400 500 600 700Time (
µµµµs)
Inte
n
s
ity (arb. units)
1586 nm pump (Indirect) Least Square Fit
786 nm pump (Direct)
0.01 0.1 1 0 100 200 300 400 500 600 700
Time (
µµµµs)
Inte
n
s
ity (arb. units)
1586 nm pump (Indirect) Least Square Fit
786 nm pump (Direct)
(b)
0.01 0.1 1 0 100 200 300 400 500 600 700Time (
µµµµs)
Inte
n
s
ity (arb. units)
1586 nm pump (Indirect) Least Square Fit
786 nm pump (Direct)