HAL Id: hal-02935242
https://hal.archives-ouvertes.fr/hal-02935242
Submitted on 13 Nov 2020HAL is a multi-disciplinary open access
archive for the deposit and dissemination of sci-entific research documents, whether they are pub-lished or not. The documents may come from teaching and research institutions in France or abroad, or from public or private research centers.
L’archive ouverte pluridisciplinaire HAL, est destinée au dépôt et à la diffusion de documents scientifiques de niveau recherche, publiés ou non, émanant des établissements d’enseignement et de recherche français ou étrangers, des laboratoires publics ou privés.
Mercury species export from the Arctic to the Atlantic
Ocean
Mariia Petrova, Stephan Krisch, Pablo Lodeiro, Ole Valk, Aurélie Dufour,
Micha J.A. Rijkenberg, Bruno Hamelin, Eric Achterberg, Benjamin Rabe,
Michiel Rutgers van der Loeff, et al.
To cite this version:
Mariia Petrova, Stephan Krisch, Pablo Lodeiro, Ole Valk, Aurélie Dufour, et al.. Mercury species export from the Arctic to the Atlantic Ocean. Marine Chemistry, Elsevier, 2020, 225, pp.103855. �10.1016/j.marchem.2020.103855�. �hal-02935242�
Paper ‘Mercury species export from the Arctic to the Atlantic Ocean’
Mariia V. Petrova1*, Stephan Krisch2, Pablo Lodeiro2, Ole Valk3, Aurelie Dufour1, Micha J.A. Rijkenberg4, Eric P. Achterberg2, Benjamin Rabe3, Michiel Rutgers van der Loeff 3
, Bruno Hamelin5, Jeroen E. Sonke6, Lars-Eric Heimbürger-Boavida1*
1. , IRD, Mediterranean Institute of Oceanography, Marseilles, France
2. Marine Biogeochemistry Division, GEOMAR Helmholtz Centre for Ocean Research, 24148 Kiel, Germany
3. Alfred Wegener Institute Helmholtz Centre for Polar and Marine Research, Bremerhaven, Germany
4. Department of Ocean Systems, NIOZ Royal Netherlands Institute for Sea Research and Utrecht University, Den Burg, the Netherlands
5. Aix , CNRS, IRD, INRA, Coll France, CEREGE, Aix en Provence, France
6. Laboratoire Géosciences Environnement Toulouse, CNRS/Institute for Research and Development/Université Paul Sabatier–Toulouse III, Toulouse, France
*Corresponding authors contact:
Present address: Bâtiment Méditerranée, Campus de Luminy, 163 Avenue de Luminy, 13288 Marseille, France
Abstract
The Fram Strait is the only deep connection between the Arctic and Atlantic Oceans. The main water and mercury (Hg) fluxes between these oceans occur via the Fram Strait and Barents Sea Opening. Several Hg mass balance studies indicated a net Hg export from the Arctic to the Atlantic Ocean. However, in the absence of Hg measurements in the Fram Strait and Barents Sea Opening, these estimates were based on North Atlantic and central Arctic Ocean data alone. Here, we refine the Arctic total Hg (tHg) and methylated Hg (MeHg) mass budgets using new data acquired during the 2015 GEOTRACES (section GN04) TransArcII cruise in the Barents Sea Opening and the 2016 GEOTRACES (section GN05) GRIFF cruise, which covered the Fram Strait and Northeast Greenland Shelf. Total Hg increased westward along the Fram Strait transect, reaching the highest concentrations on the Northeast Greenland Shelf. Concentrations of tHg averaged 1.29 ± 0.43 pM in the East Greenland Current, while core waters of the West Spitsbergen Current had average values of 0.80 ± 0.26 pM. Using our new data, we estimate that 43 ± 9 Mg y-1 of tHg is transported to the Arctic Ocean in the core of the West Spitsbergen Current, while 54 ± 13 Mg y-1 of tHg is exported from the Arctic Ocean in the East Greenland Current and Recirculated Atlantic Water. This results in a net tHg export of 11 ± 8 Mg y-1 via the Fram Strait. We find a shallow MeHg maximum (at 150 m depth) in the East Greenland Current, in agreement to what was reported for the central Arctic Ocean and Canadian Arctic Archipelago. The West Spitsbergen Current is characterized by lower MeHg concentrations and a deeper MeHg maximum, that is located at approximately 1000 m depth. We estimate a net MeHg export of 6 ± 2 Mg y-1 from the Arctic Ocean via the Fram Strait, which is nearly half of the exported tHg. Most of the exported MeHg is in the form of DMHg (2:1 ratio of dimethylmercury to monomethylmercury). Previous studies reported lower MeHg proportions. Our observations show that the Arctic Ocean is producing and exporting MeHg to the Atlantic Ocean. In total, the Arctic Ocean
exports about 18 Mg y-1 of tHg to the Nordic Seas and North Atlantic via the Fram Strait and Davis Strait, of which 7.5 Mg y-1 is in the MeHg form.
Key words
Fram Strait, methylmercury, mercury budget, Arctic Ocean, GEOTRACES
Introduction
Mercury (Hg) concentrations in Arctic biota, mostly as monomethylmercury (MMHg), are often higher than those in biota at similar trophic levels from lower latitudes (Dietz et al., 2009, 2013). This observation is surprising because the Arctic is sparsely populated and industrial Hg sources are limited. Northern peoples traditionally rely strongly on marine mammals and fish as protein sources. Consequently, there is a health concern because much of their food contains elevated levels of MMHg.
Several Hg mass balance studies have been reported and provide insight into Hg sources, sinks and processes, to explain the persistently high levels of Hg in biota and trends of Hg in the Arctic Ocean (Outridge et al., 2008; Fisher et al., 2012; Kirk et al., 2012; Dastoor and Durnford, 2014; Soerensen et al., 2016; Sonke et al., 2018). Mercury enters the Arctic Ocean via atmospheric deposition (Steffen et al., 2008; DiMento et al., 2019), inputs from rivers (mostly from Siberian rivers) and coastal erosion (Sonke et al., 2018). In addition, water exchanges with the Atlantic and Pacific Oceans are potentially important for Hg fluxes (Outridge et al., 2008; Soerensen et al., 2016), but remain poorly constrained. Water exchange with the Atlantic Ocean takes place through three major gateways: Fram Strait (southward net water flux of 1.1 ± 1.2 Sv), Barents Sea Opening (BSO, northward net water flux of 2.3 ± 1.2 Sv), and Davis Strait (southward net water flux of 2.1 ± 0.7 Sv) (Tsubouchi et al., 2018). The Fram Strait, an ocean passage between Greenland and Spitsbergen, is the only deep connection between the Arctic and Atlantic Oceans via the Nordic Seas. Warm and saline
Atlantic waters enter the Arctic Ocean via the Fram Strait as the West Spitsbergen Current (WSC, 6.6 ± 0.4 Sv, Beszczynska-Möller et al, 2012), while cold and less saline Arctic waters exit the Arctic Ocean as the East Greenland Current (EGC, 5.8 ± 1.8 Sv along the 79°N, Steur et al., 2014) (Fig. 1a). Approximately 40% of the inflowing Atlantic Waters (AW) enter the Arctic Ocean as the Norwegian Atlantic Current (NwAC) via the BSO (Mauritzen et al., 2011).
Recent studies indicate that the present Arctic Ocean exports Hg to the Atlantic Ocean (Soerensen et al., 2016; Sonke et al., 2018); however, measurements of Hg species distribution in the Fram Strait and BSO have been lacking thus far. A first Hg mass balance for the Arctic Ocean was developed by Outridge et al. (2008). In this model, atmospheric deposition and coastal erosion were suggested to be dominant sources of Hg, while sedimentation was the largest sink of Hg in the Arctic Ocean. The authors estimated oceanic Hg inflows and outflows based only on data from the North Atlantic Ocean (Cossa et al., 1992, Mason et al, 1998; Cossa et al., 2004) and suggested a net Hg export to the North Atlantic Ocean of 20 Mg y-1. The Arctic Hg mass balance was further refined by Soerensen et al. (2016), including methylated Hg species (MeHg) for the first time. This model study used new tHg and MeHg data from oceanographic cruises in the Canadian Arctic and two profiles in the Central Arctic Ocean (St. Louis et al., 2007; Kirk et al., 2008; Lehnherr et al., 2011; Wang et al., 2012; Zdanowicz et al., 2013; Heimbürger et al., 2015). The authors suggested that the Arctic Ocean is a net source of Hg to the atmosphere and reported a net inorganic Hg and MeHg flux of 19 Mg y-1 and 7 Mg y-1, respectively, to the North Atlantic Ocean.
We determined the Hg species distribution in the main water masses in the Fram Strait and BSO and estimated tHg and MeHg fluxes to and from the Arctic Ocean. We used our observations, combined with the latest modeling studies, to establish a refined Arctic Hg
budget and to investigate the relative importance of atmospheric, oceanic, and terrestrial Hg fluxes in the Arctic Ocean.
Methods
Sampling and analytical methods
Seawater and suspended particle samples were acquired during the 2015
GEOTRACES (section GN04) TransArc II (17th August to 15th October 2015) and the 2016 GEOTRACES (GN05) GRIFF (21st July to 1st September 2016) cruises onboard FS
Polarstern.
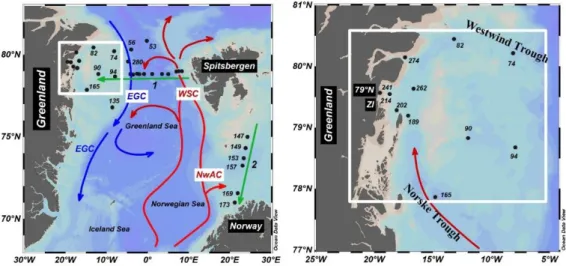
In 2015, the study area included a section in the BSO between continental Norway and Spitsbergen (Fig. 1a). In 2016, the study area included a meridional transect along 78.8°N in the Fram Strait, several stations in the northern part of Fram Strait (St. 53, 56, 280), as well as stations on the NE Greenland Shelf (NEGS, Fig.1a). The NEGS is dominated by a C-shaped trough system consisting of the Westwind Trough and Norske Trough (Schaffer et al., 2017). Special emphasis was paid to the characterization of the North-East Greenland Ice Stream (NEGIS) glaciers, the largest of which is the 79°N Glacier (Fig. 1b).
Sea water was sampled at 32 full depth stations: 8 stations in the Fram Strait (24 water depths at each station), 11 stations on the NEGS (< 500 m depth), 6 stations along the slopes of Greenland and Spitsbergen, and 7 stations in the BSO. In 2015, sea water was sampled using a titanium ultraclean frame (De Baar et al., 2008) equipped with 24 x 24 L polyvinylidene fluoride samplers. In 2016, an Ultra Clean CTD system equipped with 24 x12 L GOFLO (Cutter et al., 2017) sampling bottles were used. Subsampling of individual Hg samples was conducted in a class 100 ultraclean laboratory container within 1 h of retrieval. During both cruises unfiltered subsamples were collected into 60 mL acid-cleaned FEP (Fluorinated ethylene propylene) bottles for analysis of total Hg (tHg), and two separate 250 mL acid-cleaned Teflon bottles (PFA, Perfluoroalkoxy alkane) were used for quantification of
MeHg, dissolved gaseous Hg (DGM) and MMHg following rigorous GEOTRACES protocols (Cutter et al., 2017). Samples for tHg and MeHg were taken from each depth. Samples for DGM and MMHg were taken from selected depths, mainly in the upper 500 m. Total Hg and DGM concentrations were analyzed onboard, while seawater samples for MeHg and MMHg measurements were transported to the home laboratories for analysis.
Fig. 1. (a) Schematic view of oceanic circulation in the Nordic Seas, the Fram Strait and the BSO. Station locations are shown as black circles. Green arrows represent the transects: 1- a meridional transect of 78.8°N, the 2016 GEOTRACES GRIFF cruise, 2- a section between Spitsbergen and Tromsoe, the 2015 GEOTRACES TransArc II cruise. (b) bathymetric map of the trough system on the Northeast Greenland continental shelf based on Shaffer et al., 2017. The main geographical features, water masses and currents are indicated: West Spitsbergen Current (WSC), Norwegian Atlantic Current (NwAC), East Greenland Current (EGC), Nioghalvfjerdsfjorden Glacier (79°N), and Zachariæ Isstrøm (ZI). Figure was produced using Ocean Data View (Schlitzer, 2018) and modified manually.
Suspended total particulate Hg (pHg) samples were collected using McLane in situ pumps at 10 stations in the Fram Strait and at 3 stations in the BSO. Surface pHg samples were taken in the eastern, central, and western Fram Strait, at 25 – 425 m depth on the NEGS,
and at 25 – 115 m-depth in the BSO. Particles were collected on precombusted QMA filters (1 – 53µm, 142 mm, Millipore). Filters were kept frozen at -20°C until analysis.
Mercury species determination
Water samples for Hg species determination were unfiltered to avoid possible contamination with inorganic Hg and loss of DGM during filtration. Water samples collected in 2015 in the BSO included samples for tHg, pHg, and MeHg determination, while water samples were collected during the 2016 cruise for tHg, pHg, DGM, MeHg, and MMHg determination.
Total Hg was measured on a 35 mL aliquot following the US EPA method 1631, which was modified after Heimbürger et al. (2015). Prior to tHg analysis, all Hg species were oxidized to inorganic labile Hg2+ w h c c B (30 μL f 0.2 B concentrated double-distilled HCl added to each aliquot). Then, Hg2+ was reduced to form volatile Hg0 with an acidic SnCl2 (100 μL f 20w % 2 in 1 N HCl solution). To ensure a low Hg contribution from reagents, potassium bromide (Sigma Aldrich, USA) and potassium bromate (Sigma Aldrich, USA) were heated for 6 h at 250°C to remove traces of Hg before preparing the BrCl solution, and the HCl was double-distilled. Reduced Hg0 was purged from the solution with Hg-free Argon gas (0.6 L total at 0.15 L min-1) and amalgamated onto a gold trap, followed by thermal desorption and detection via cold vapor atomic fluorescence spectrometry (CVAFS, Brooks Rand Model III, USA). Dissolved gaseous mercury was determined from 250 mL PFA bottles within 6 h of sampling, by purging with Hg-free Argon gas (3.75 L total at 0.15 L min-1) and without the oxidation and reduction steps, amalgamation onto a gold trap followed by detection via CVAFS similar to the tHg analysis.
The CVAFS to determine tHg and DGM was calibrated against NIST 3133 (National Institute of Standards and Technology) certified reference material, and the accuracy was
evaluated by regular analysis of the ORMS-5 certified reference material provided by the National Council of Canada. We modified the CVAFS system with a mirrored quartz cuvette (Hellma Optics, Germany) to achieve a detection limit of 0.025 pM (Heimbürger et al., 2015). Subsamples for MeHg and MMHg were acidified to 0.4% (v/v) with double-distilled 9 M HCl immediately after sampling or after purging DGM. Acidification quantitatively converts dimethylmercury (DMHg) into MMHg (Black et al., 2009); we thus measured MeHg as the sum of MMHg and DMHg. Monomethylmercury was measured in acidified sea water after removal of DGM. Both, MeHg and MMHg, were measured via species specific isotope dilution using gas chromatography coupled to a sector field inductively coupled plasma-mass spectrometry (GC-HR-ICP-MS), following Heimbürger et al. (2015). Briefly, enriched spikes of 199iHg and MM201Hg were added to a known amount of sea water (110 – 115 mL) subsampled in a glass bottle (Fisher Scientific, DWK Life Sciences 223748). After 24h of equilibration, the pH was adjusted to 3.9 with 2 mL of 5 M buffer solution of acetic acid (glacial, ULTREX®-II Ultrapure Reagent, J.T. Baker, USA)/sodium acetate (J.T. Baker, USA) and NH3 (ULTREX®II Ultrapure Reagent, J.T. Baker, USA). A derivatization agent solution of 1% (m:v) NaBPr4 (Merseburger Spzialchemikalien, Germany) was freshly prepared in deionized water, under cold conditions and stored in a freezer, 1 mL of this solution was added together with 200 µL of hexane (Sigma-Aldrich, USA). The glass bottles were sealed and intensively shaken for 20 min using a shaking table. The overlying organic phase was collected with a micropipette and 2 µL was injected in duplicate into the GC (Thermo Ultra Trace, using a Restek rxi-5ms column) coupled to a sector field ICP-MS (Thermo Element XR). The typical detection limit for MeHg and MMHg using this method was below 0.005 pM. Dimethylmercury concentrations were calculated as the difference between MeHg and MMHg.
Prior to pHg analysis, the filters were freeze-dried (Christ Gamma 1-16 LSCplus). Subsamples of 25 mm diameter punchouts were used for pHg analysis. Particulate Hg was analyzed by combusting the filter in the CV-AAS (LECO AMA 254) equipped with a low level optical cell. The limit of detection of this method, estimated as three times the standard deviation of the blank samples, was 1.2 pg, which was equivalent to approximately 0.0001 pM considering the amount of filtered sea water.
Mercury species flux estimations
We estimated annual oceanic Hg fluxes based on average tHg and MeHg concentrations and used the monthly volume transport from one-year mooring observations of water masses in the Fram Strait and BSO (Tsubouchi et al., 2018). Following Tsubouchi et al. (2018), w g h 4 c mp h F m : W ( f g ≥ 5°E) EGC (between 6.5°W and 2.0°E), Middle (between 2.0°E and 5.0°E), and Belgica (longitude ≥6.5°W) 1 c mp h B O ( ). F y c mp f h F m t we defined 5 layers bounded by isopycnal surfaces: (1) Surface Water (SURF) layer, (2) Upper Atlantic Water (UAW) layer, (3) Atlantic Water (AW) layer, (4) Intermediate Water (IW) layer, (5) Deep Water (DW) layer (Table S1). We estimated tHg and MeHg fluxes for every layer of each component in the Fram Strait and for the entire water column in the BSO. The uncertainties in the tHg and MeHg fluxes for every layer and each component were determined by error estimations, taking in account the standard deviations of water transport and tHg and MeHg concentration determinations. Since water transport into and out of the Arctic Ocean and Hg concentrations are not independent variables, we cannot use classical error estimation for the uncertainty of the net annual water and Hg balance. Instead we used monthly mean water transport across the different components and layers of the Fram Strait, BSO, and Davis Strait (Tsubouchi et al., 2018), together with tHg and MeHg observations to
calculate monthly net fluxes. We then averaged monthly mean net tHg and MeHg fluxes and report uncertainty as the standard deviation of monthly variations scaled to units of Mg y-1.
Results
Hydrological setting
The hydrography in Fram Strait during the 2016 GRIFF cruise is described in detail by Richter et al. (2018). Briefly, AW enters the Arctic Ocean via the Fram Strait as a part of the WSC (Fig. 1a). A part of the AW returns to the Nordic Seas within the Fram Strait area, creating Recirculated Atlantic Water (RAW). A second branch of the AW enters the Arctic Ocean via the BSO, as NwAC. The main outflow from the Arctic Ocean occurs along the Greenland margin and above the NEGS as EGC, formed from Polar Water (PW), Arctic Atlantic Water (AAW), and RAW.
The complex subsurface current system above the NEGS is described in detail by Schaffer et al. (2017). Briefly, reaching the seaward inlet of the Norske Trough (near St. 135, Fig. 1a), the RAW can penetrate the trough system (referred to by Bourke et al., 1987, as Atlantic Intermediate Water, AIW) and move towards the termini of the NEGIS glaciers. As such, the Norske Trough provides a pathway for warm AIW to move to the glacial base where it contributes to the submarine melting of the glacier.
Total and particulate Hg
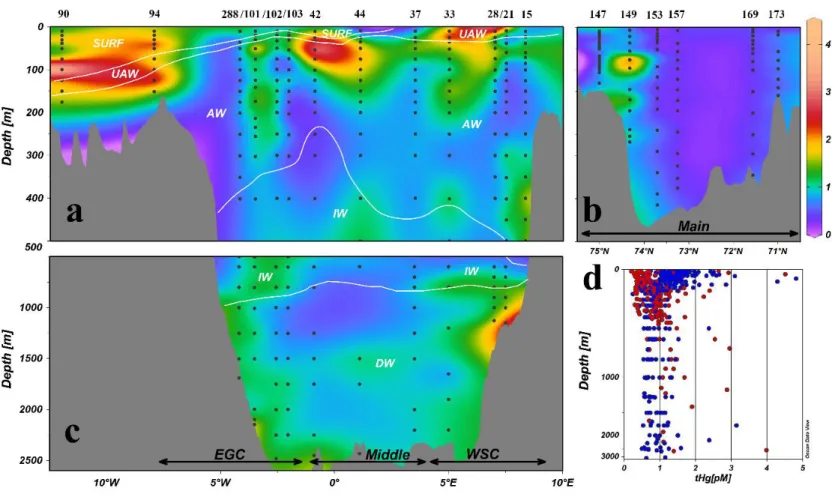
The tHg concentrations averaged 1.10 ± 0.56 pM (0.20 – 4.81 pM, n = 586) (Fig. 2d) for all stations and depths in the Fram Strait, on the NEGS and BSO. The overall distribution of tHg along the 78.8°N transect is presented in Fig. 2a, c. The vertical profiles of tHg east of 5°E (St.15, 21, 28, 33) were characterized by peaks in subsurface (60 – 100 m depth) and intermediate waters (500 – 800 m depth). The central part of the Fram Strait (St. 37, 42 and 44) was also characterized by a surface maximum (50 – 75 m depth); however, deeper layers showed a smoother tHg distribution, increasing with depth. In the northern Fram Strait (St.
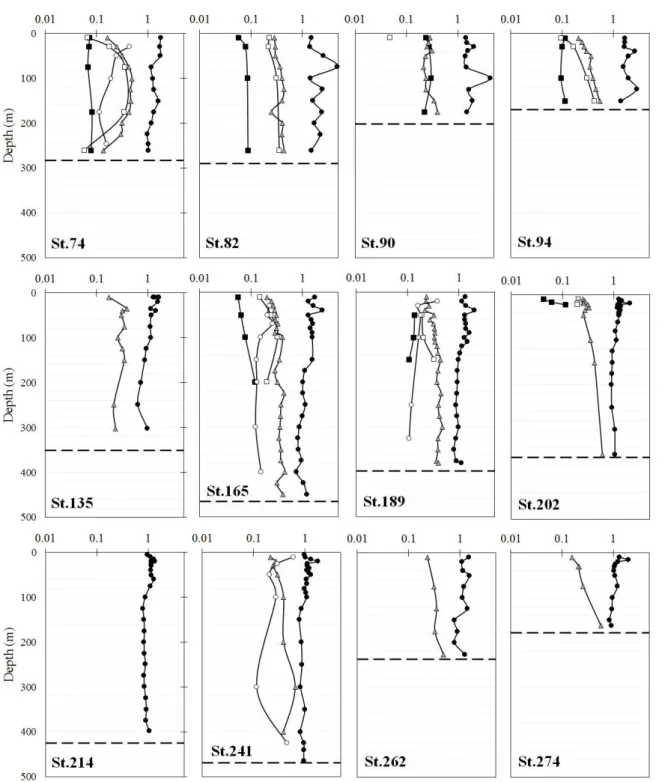
53, 56 and 280), we again observed tHg peaks in the subsurface (120 m depth) and intermediate (400 – 500 m depth) waters (SI Fig. 1). Complex tHg vertical patterns with several peaks in subsurface and intermediate waters were observed in the western Fram Strait (St. 101, 102 and 103). The tHg concentrations in the BSO averaged 0.43 ± 0.14 pM (0.20 – 0.78 pM, n = 52). The distribution of tHg in the BSO was relatively uniform, and was characterized by a minor subsurface peak at 40 – 50 m depth (Fig. 2b). The tHg concentrations in the NEGS and close to the NEGIS glaciers ranged between 0.64 and 4.81 pM in the upper 100 m depth, while the tHg distribution in the waters below 100 m showed a more uniform pattern (except for St.82, Fig. 3). In general, tHg concentrations on the NEGS and close to the NEGIS glaciers were enriched relative to those all other stations in this study.
Particulate Hg concentrations averaged 0.24 ± 0.13 pM (0.06 – 0.60 pM, n = 46) for all stations and depths in the Fram Strait, on the NEGS and BSO. The lowest pHg concentrations (0.06 – 0.07 pM) were found in the upper 25 m of the BSO, while the highest pHg concentrations were found in the NEGS. The vertical distribution of pHg on the NEGS generally showed a uniform pattern with slightly higher concentrations at the surface (Fig. 3)
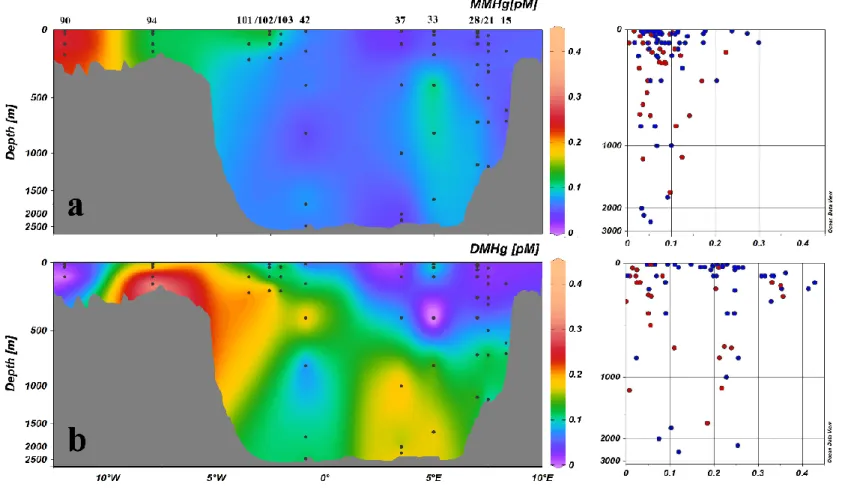
Fig. 2. The distribution of the tHg (pM) in the upper 500 m depth along the Fram Strait transect (a) and along the Barents Sea transect (b) and below 500 m depth along the Fram Strait transect (c). The overall tHg distribution in the southward (red) and the northward flowing waters (blue) is given in (d). The indicated water masses distributions follow Tsoubouchi et al. (2018). Sections were produced using Ocean Data View (Schlitzer, 2018) and modified manually.
Fig. 3. The distribution of the tHg (black circles), MeHg (grey triangles), MMHg (black square), DMHg (open square), and pHg (open circles) over the Greenland Shelf. Dashed line represents the bottom sediments. Note the logarithmic concentration scales.
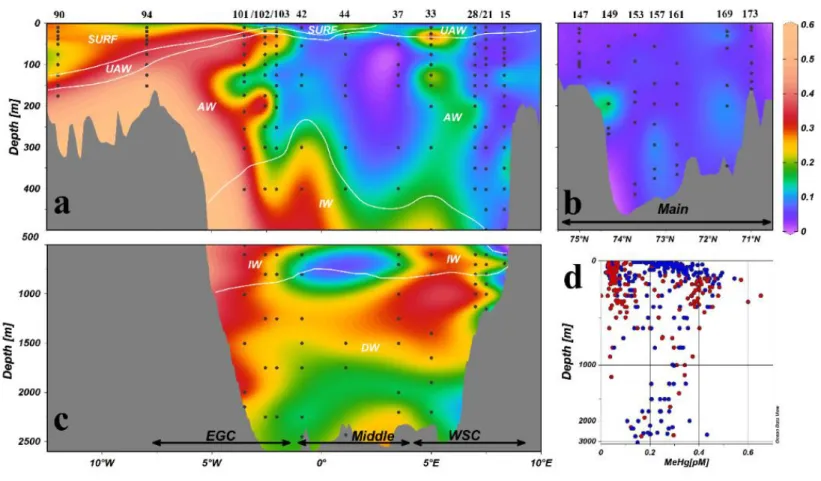
Fig. 4. The distribution of the MeHg (pM) in the upper 500 m depth along the Fram Strait transect (a) and along the Barents Sea transect (b) and below 500 m depth along the Fram Strait transect (c). The overall tHg distribution in the southward (red) and the northward flowing waters (blue) is given in (d). The indicated water masses distributions follow Tsoubouchi et al. (2018). Sections were produced using Ocean Data View (Schlitzer, 2018) and modified manually.
Methylmercury species
Methylated Hg concentrations averaged 0.23 ± 0.14 pM (0.02 – 0.65 pM, n = 387, Fig. 4d) for all stations and depths in the Fram Strait, on the NEGS and BSO. The lowest MeHg concentrations (0.02 pM) were found in the upper 10 m of water, while the highest MeHg concentrations occurred in subsurface waters on the NEGS (0.25 – 0.54 pM, 150 – 200 m depth). The surface waters on the NEGS also showed relatively high MeHg values (0.14 – 0.24 pM). The vertical distribution of MeHg at most stations in the eastern and central part of the Fram Strait (St. 15, 21, 28, 33, 34, 42, and 44) showed relatively low concentrations (<0.1 pM) in surface waters. For those stations, we found a subsurface maximum at 600 – 1500 m depth, below which MeHg concentrations slightly decreased and then increased again near the seafloor (Fig. 4a, c). The northern part of the Fram Strait (St. 53 and 56) was characterized by two distinct MeHg peaks, at 150 m and at 400 m depth (SI Fig. 1). A similar vertical MeHg distribution was found in the western part of the Fram Strait (St. 101, 102, 103). The MeHg distribution in the BSO was different, with much lower (0.02 to 0.18 pM) concentrations that were nearly uniform with depth (0.06 ± 0.03, n = 47; Fig. 4b). On the NEGS, we determined a subsurface MeHg maximum at ~150 m depth (Fig. 3). Stations near the NEGIS glaciers showed higher variability. For station 241, closest to the 79°N glacier, we found the highest MeHg concentrations of up to 0.65 pM at 300 – 350 m depth.
Among all stations and depths, concentrations of MMHg averaged 0.09 ± 0.06 pM (<0.005 – 0.30 pM, n = 86) (Fig. 3 and Fig. 5a). The lowest MMHg concentrations (<0.005 pM) were found in surface waters of the AW, while highest MMHg levels (0.24 pM) were determined for subsurface waters on the NEGS. The MMHg profiles showed little variability with depth in the Fram Strait and on the NEGS.
Concentrations of DMHg averaged 0.17 ± 0.12 pM (<0.005 – 0.43 pM, n = 73) (Fig. 3 and Fig. 5b). The lowest DMHg concentrations (< 0.005 pM) were found in surface waters,
while the highest DMHg concentration (0.43 pM) was measured on the NEGS. For AW entering the Arctic Ocean we determined maxima DMHg at approximately 600 – 1000 m depth, while the maximum for waters on the NEGS was located at 150 m depth.
Dissolved gaseous Hg
Among all stations and depths, concentrations of DGM averaged 0.11 ± 0.09 pM (0.025 – 0.43 pM, n = 103). The lowest DGM concentrations (0.025 pM) were found in surface waters along a transect in Fram Strait, while the higher DGM concentrations (>0.30 pM) were determined at 100 – 200 m depth in outflowing Arctic waters and at approximately 500 m depth in the AW. Dimethylmercury was the larger fraction of DGM and averaged 50 ± 30% (3 – 92%, n = 14), and was higher than values reported by Agather et al. (2019) for the central and Western Arctic Ocean (21 ± 15%, 2 – 64%).
Fig. 5. Overall (a) MMHg (pM) and (b) DMHg (pM) distribution along the Fram Strait transect. The overall MMHg and DMHg distribution is given for the southward (red) and the northward flowing waters (blue). Sections were produced using Ocean Data View (Schlitzer, 2018) and modified manually.
Discussion
Total Hg and total particulate Hg
The main feature of the tHg distribution along the 78.8°N transect was a westward enrichment in the upper (50 – 400 m-depth) waters. Atlantic Water entered the Arctic Ocean as a part of the WSC (50 – 500 m-depth, Richter et al., 2018) with an average tHg concentration of 0.80 ± 0.26 pM (0.47 – 1.60 pM). The average tHg concentrations for the Arctic waters in the EGC were higher, at 1.29 ± 0.43 (0.60 – 2.51 pM), reaching an average of 1.58 ± 0.53 (0.87 – 4.29 pM) on the NEGS. A similar enrichment in tHg concentrations in the Arctic waters was found in the central Arctic Ocean (Heimbürger et al., 2015, Agather et al., 2019) and the Canadian Arctic Archipelago (CAA; Kirk et al., 2008; Wang, et al., 2012; Wang et al., 2018). The outflowing Arctic water masses carried the Hg-enriched surface waters from the Arctic Ocean into the Atlantic.
A remarkable feature of tHg at Fram Strait was the high variability of the tHg concentrations compared to those in other ocean basins (Schlitzer et al., 2018). The tHg distribution typically shows minor variability in remote ocean regions (Lamborg et al., 2014; Schlitzer et al., 2018). The high tHg variability in the Fram Strait was consistent with a range of variables including macronutrients, which were more variable in the Fram Strait than in the open ocean. The high tHg variability was likely due to the strong dynamics of water masses from various Arctic Ocean and Atlantic Ocean origins. We observed minor tHg variability in the BSO because the waters were mainly of Atlantic origin.
The vertical distribution of tHg in the incoming AW was comparable to that observed along the GEOTRACES-GA01 transect in the Eastern North Atlantic (Cossa et al., 2018). Well-pronounced tHg maxima in subsurface waters were co-located with fluorescence maxima (data not shown), while the position of a second peak in intermediate waters was close to the maximum in apparent oxygen utilization (AOU), which reached up to 50 µmol L
-1
. The average tHg concentrations in the AW that form the WSC were higher than tHg concentrations in the AW reported further south in the Eastern North Atlantic (0.61 ± 0.18 pM, Cossa et al., 2018). The difference in tHg concentrations between AW in the Fram Strait and North Atlantic indicates additional inputs of Hg to the northerly flowing AW (Fig. 6). An average tHg concentration in the BSO (0.43 ± 0.14 pM, n = 52) was comparable to tHg concentrations found in the North Atlantic by Cossa et al. (2018) (generalized linear model, GLM: F = 0.11, p = 0.75).
Vertical distributions of tHg in the northern Fram Strait were consistent with tHg profiles observed in the central Arctic Ocean: surface tHg enrichment followed by a gradual decrease with depth (Heimbürger et al., 2015). Vertical tHg patterns at these stations differ from the vertical distribution of tHg in the western Fram Strait where more complex tHg profiles were found. We explain the complex tHg vertical pattern as a result of mixing between the AAW in the EGC and RAW (Richter et al., 2018). The outflowing waters of the EGC were enriched in tHg compared with tHg concentrations in the Irminger Sea (0.45 ± 0.51 pM, Cossa et al., 2018, Fig. 6). We found that the outflowing waters might lose tHg on their way through the Nordic Seas, possibly due to mixing with the AW that contains less Hg. Additionally, on the way to the North Atlantic, the outflowing waters pass over a relatively shallow sill (650 m) in the Denmark Strait, where Hg is possibly scavenged by coastal sediments and/or evolved to the atmosphere after reduction, as proposed for the Celtic Sea (Cossa et al., 2004).
The average pHg (0.24 ± 0.13 pM, n = 46) in the Fram Strait was an order of magnitude higher than pHg concentrations in the North Atlantic reported by Bowman et al. (2015) and Mason et al. 1998 (0.038 ± 0.039 pM and 0.035 ± 0.02 pM, respectively) and higher than values reported for the central Arctic Ocean (Agather et al., 2019, 0.1 ± 0.1 pM and Tesán et al., 2020, 0.08 ± 0.05 pM). The pHg accounted for 20 ± 11% of tHg, which is
twofold higher than values reported for the North Atlantic in Bowman et al. (2015). Our elevated pHg concentrations may be explained by the higher particle load on the Greenland shelf.
Fig. 6. Schematic view of the oceanic circulation in the North Atlantic and Arctic Ocean, tHg concentrations (pM) and fluxes (Mg y-1) in main water masses and currents. c ‘’w m’’ c w b c ‘’c ’’ c c w . Green squares represent the 2014 GEOVIDE cruise (Cossa et al., 2018) with corresponding tHg concentrations and estimated fluxes (*). Violet diamonds represent stations of the 2015 Canadian Arctic GEOTRACES cruise, tHg fluxes were estimated based on Wang et al., 2018 (**). Red triangles represent the 2015 GEOTRACES TransArc II cruise. Yellow circles represent the 2016 GEOTRACES GRIFF cruise. The main oceanic currents are indicated: West Spitsbergen Current (WSC), Norwegian Atlantic Current (NwAC), East Greenland Current (EGC), Labrador Current (LC). Figure was produced using Ocean Data
View (Schlitzer, 2018) and modified manually.
Methylmercury species
Methylated Hg concentrations in the upper water column also showed a westward increase along the 78.8°N transect. Mean MeHg concentrations in the core of the AW of the WSC were 0.09 ± 0.05 (0.05 – 0.19 pM), while MeHg concentrations in the Arctic waters (50 – 400 m depth) of the EGC averaged 0.35 ± 0.09 (0.15 – 0.49 pM) and 0.33 ± 0.10 pM (0.05 – 0.65 pM) on the NEGS. Therefore, the outflowing Arctic water masses carry MeHg-enriched upper waters to the North Atlantic.
The subsurface maximum of MeHg at 600 – 1000 m depth in the WSC was consistent with observations in the Atlantic Ocean (Mason et al., 1998; Bowman et al., 2015). We observed a significant positive correlation between concentrations of MeHg and AOU (r = 0.64 p ≤ 0.001) wh ch c w h the results of previous work (Kirk et al., 2008; Lehnherr et al., 2011). Waters in the EGC and on the NEGS were characterized by much shallower MeHg maxima (100 – 300 m depth), in good agreement with recent studies in the Beaufort Sea (Wang et al., 2018) and central Arctic Ocean (Heimbürger et al., 2015, Agather et al., 2019). The observed low MeHg concentrations in the surface waters were likely due to photochemical decomposition of MMHg and DMHg, uptake of MMHg by phytoplankton, and DMHg evasion to the atmosphere (Monperrus et al., 2007; Lehnherr et al., 2011). The elevated MeHg concentrations in surface waters on the NEGS might be explained by production (Heimbürger et al. 2010). The shallow MeHg peak on the NEGS is a source of methylated Hg species to surface waters, and subsequently the atmosphere. Following Hammerschmidt and Bowman (2012), we calculated from the MeHg concentration gradients (0.33 pM at 125 m – 0.23 pM at 10 m; and 0.23 pM at 10 m – 0 pM at 0 m) and the eddy diffusion coefficient (2 x 10⁻⁶ m2 s-1, Wallace et al., 1987, and 0.8 x 10⁻⁴ m2 s-1, Soerensen et al., 2016) vertical diffusive fluxes of 0.14 – 5.71 pmol m-2 d-1 and 6 – 159 pmol m-2 d-1,
respectively. Thus, estimated total loss of MeHg due to the evasion of DMHg to the atmosphere and photochemical decomposition of MeHg (MMHg degradation rate of 51.7 pmol m-2 day-1, DiMento and Mason, 2017), is higher than the estimated vertical flux from the MeHg peak at 100 – 150 m depth, suggesting MeHg production in surface waters.
For all stations and depths in the Fram Strait and BSO, the MeHg percentage averaged 24 ± 14% of tHg (< 2 – 78% of tHg), indicating that at several depths, MeHg is the dominant species as was found in an upwelling zone of the Southern Ocean (up to 78%, Cossa et al., 2011) and in stratified anoxic waters of the Black Sea (up to 57%, Rosati et al., 2018). A similar average MeHg percentage was found in the Central Arctic Ocean (30 – 33%, Heimbürger et al., 2015).
The average DMHg/MMHg ratio in the Fram Strait was 2.6 ± 1.8, making DMHg the dominant MeHg species. However, for the upper 100 m of the water column at all stations the ratio varied between 0.03 and 6.9, which implies that either species was dominant. The DMHg/MMHg ratios were similar to those found in surface waters of the North Atlantic (0.06 ± 0.04, Bowman et al., 2015) and in the Western Arctic Ocean (0.33 ± 0.25, Agather et al., 2019), as well as to those estimated for the upper water column of the Arctic Ocean (0.6 ± 0.6, Soerensen et al., 2016). At the depth of the MeHg maximum in the WSC (600 – 1000 m depth), DMHg was always the dominant MeHg species with a DMHg/MMHg molar ratio of 3.3 ± 2.7. Similar values were found for the MeHg maximum of the EGC (150 – 200 m depth).
Hg species distribution and the melting of NEGIS glaciers
h EG b hym y c h w m W ( ≥1° ) g h k ough to the 79°N glacier cavity (St.241, Schaffer et al., 2018). This AIW causes basal melting of the 79°N glacier ice sheet. The freshwater coming from basal melting can potentially be an additional source of Hg to the NEGS waters. The glacially modified water (GMW) is less
dense and can be distinguished from water that was not in contact with the glacier. Following Schaffer et al. (personal communication), GMW occupied the layer between 120 and 270 m depth. Our observations at St. 241 indicated a minor impact of the basal melting on tHg concentrations, in contrast with other trace metals, for example, dissolved Fe and Mn (Krisch et al., in review). The tHg concentrations in the water column measured near the glacier are in agreement with ones found in the Greenland ice sheet (average of 2.15 pM, Boutron et al., 1998). Below the GMW, at 300 m depth, we observed MeHg concentrations of up to 0.65 pM (78% of tHg), which were the highest in our study. These concentrations were not consistent with the smooth MeHg profiles found upstream of the AIW (St. 189 and 165). A possible reason for the higher MeHg concentration is in situ Hg methylation stimulated by particles, organic matter or nutrient inputs from the overlying GMW to the AIW at this depth. We did not find elevated pHg concentrations. Additionally, after reaching the terminus of the 79°N glacier AIW is blocked by a sill across the trough system; therefore, it has potentially more time to convert inorganic Hg into MeHg.
Mercury species flux estimates at the Fram Strait and BSO
From our Hg species observations, we determined a tHg inflow via the Fram Strait to the Arctic Ocean of 43 ± 9 Mg y-1 (of which 7.5 ± 2 Mg y-1 is in the form of MeHg, Table S1 and Fig. 7). In spite of a relatively high water transport via the BSO (2.3 ± 1.2 Sv, Tsubouchi et al., 2018), the tHg inflow via the BSO was estimated to be 6 ± 4 Mg y-1, of which just a minor amount is in the form of MeHg (1 Mg y-1, Table S1, Fig. 7). These tHg fluxes are comparable with those estimated by Outridge et al. (2008) (44 Mg y-1 tHg via the Fram Strait, MeHg not calculated) and Soerensen et al. (2016) (47 Mg y-1 of tHg and 7 Mg y-1 of MeHg, via Fram Strait and BSO). We further estimated a tHg outflow from the Arctic Ocean via the Fram Strait of 54 ± 13 Mg y-1, of which 14 ± 3 Mg y-1 is in the form of MeHg with an average DMHg/MMHg ratio of 2.5. Based on the average concentrations found in the Eastern
CAA and Baffin Bay (Wang et al., 2018), we estimated net tHg and MeHg fluxes via the Davis Strait. With an average southward net water transport of 2.1 ± 0.7 Sv (Tsoubouchi et al., 2018), approximately 19 ± 8 Mg y-1 of tHg (of which 2.5 ± 1 Mg y-1 is in the form of MeHg) is transported from the Arctic Ocean to the North Atlantic via the Davis Strait. Our estimated tHg fluxes from the Arctic Ocean via the Fram Strait and Davis Strait are comparable with the reported values of 68 Mg y-1 (Outridge et al., 2008) and 79 Mg y-1 (Soerensen et al., 2016).
The net outflow (southward) of tHg via the Fram Strait, BSO, and Davis Strait was estimated as 18 ± 6 Mg y-1, which is lower than the value reported by Sonke et al. (2018) (tHg net southward export of 30 Mg y-1). Our observations indicated that approximately 40% of the exported tHg is in the MeHg forms (7.5 ± 2 Mg y-1). The only other available estimate of a MeHg flux (Soerensen et al., 2016), suggested a net MeHg export of 7.9 Mg y-1 via the
Fram Strait and CAA; however, this estimation incorporates a much lower proportion of MeHg (25%) to tHg.
The uncertainty in the estimated Hg fluxes is explained by the temporal variability in water fluxes, in Hg concentrations, and uncertainties in Hg measurements. We estimated tHg and MeHg fluxes based on monthly water transport observations from 2005-2006 (Tsubouchi et al., 2018), with the hypothesis that the water transport is representative of the water transport during the time of our sampling. Moreover, the Hg flux estimates were based on mean tHg and MeHg concentrations observed during summer/early fall of 2015-2016 and therefore neglect any possible seasonal variability of Hg concentrations and speciation.
Implication for arctic Hg budget and perspectives
Mercury mass budget estimations for the Arctic Ocean have been developed for the last 10 years. Based on only a few observations, an initial Arctic Ocean budget was provided by Outridge et al. (2008). Fisher et al. (2012) used a global three-dimensional ocean –
atmosphere model to revise this budget, suggesting a large evasion flux to the atmosphere. Soerensen et al. (2016) developed a mass budget by inclusion of MeHg for the first time. Most recently, Sonke et al. (2018) conducted extensive Eurasian river mercury observations and refined the Arctic Hg budget. In this study, we report oceanic tHg and MeHg fluxes via the Fram Strait and BSO and combine them with current observations and modelling studies (Soerensen et al., 2016; Sonke et al., 2018, Tesán Onrubia et al., 2020) which allows us to summarize the essential features of the modern Arctic tHg and MeHg cycles (Fig. 7). The tHg burial flux to the sediments was estimated following Tesán Onrubia et al. (2020) by extrapolating average Hg burial rates determined for the outer shelf for the entire Arctic shelf area.
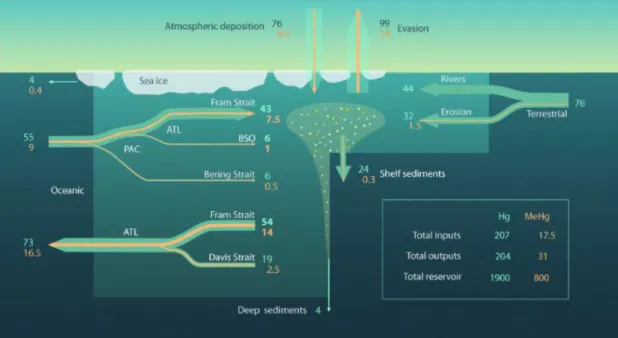
The total oceanic tHg inflow to the Arctic Ocean via the Fram Strait, BSO, and Bering Strait (3.7 – 7.6 Mg y-1, Soerensen et al., 2016) was estimated as 55 ± 7 Mg y-1. This inflow is comparable with the best estimated values of the model (52.8 Mg y-1, Soerensen et al., 2016); however, our estimates have a lower range of uncertainty than the model (between 40 and 62 Mg y-1). The total oceanic tHg outflow via the Fram Strait and Davis Strait was estimated as 73 ± 8 Mg y-1, which is similar to published values by Soerensen et al. (2016) (79 Mg y-1, ranging between 49 and 122 Mg y-1). Our Arctic Ocean tHg mass budget portrays a balanced system: the estimated total inflow (207 Mg y-1) is similar to the total outflow (204 Mg y-1) (Fig. 7). In contrast, Outridge et al. (2008) suggested a net gain of 24 Mg y-1. However, due to the relatively high uncertainties in atmospheric deposition and evasion (145 – 110 Mg y-1 and 35 – 112 Mg y-1, respectively, Table S2, Soerensen et al., 2016) in our updated Hg budget, the balanced system might be speculative.
Based on the field observations we revised the total amount of Hg present in the Arctic Ocean water column (reservoir size) to 1,900 Mg compared to 2,800 Mg reported previously (Soerensen et al., 2016). Thus, we estimated that tHg in the Arctic Ocean reservoir
has a residence time against outflow of approximately 9.5 years. The annual total inflow corresponds to approximately 10% of the reservoir size, which makes the Arctic Ocean tHg inventory sensitive to changes in the input and output fluxes.
Fig. 7. Arctic Ocean budget (Mg) and fluxes (Mg y-1) for tHg (labelled blue) and MeHg (labelled orange).
The total oceanic inflow of MeHg to the Arctic Ocean via the Fram Strait, BSO, and Bering Strait (0.5 Mg y-1, Soerensen et al., 2016) was estimated as 9 ± 1.5 Mg y-1. This MeHg inflow is slightly higher than model results (7 Mg y-1, range between 3 to 12 Mg y-1, Soerensen et al., 2016) and is equivalent to the atmospheric deposition. The total oceanic MeHg outflow via the Fram Strait and Davis Strait was estimated to be 16.5 ± 2 Mg y-1, which is similar to previous estimates (Soerensen et al., 2016; 15 Mg y-1, range between 8 and 26 Mg y-1). Estimated total MeHg output is approximately twice as high (31 Mg y-1) as input (17.5 Mg y-1; Fig. 7). We find that the in situ MeHg production in the Arctic Ocean is approximately equal to the sum of all other MeHg inflows such as the inflow from the rivers and atmospheric deposition. The total oceanic MeHg outflow is equally important as the
DMHg evasion to the atmosphere. However, due to high uncertainties in the MeHg deposition and evasion fluxes (8 – 10 Mg y-1 and 2 – 22 Mg y-1, respectively, Table S2, Soerensen et al., 2016) further investigations are needed at the atmosphere-ocean interface. It is also important to better evaluate the mercury export flux to marine sediments (which is the only final Hg sink), differentiating the inner and outer shelves and the open ocean export fluxes.
Summary and conclusions
This work presents Hg species distributions in the Fram Strait and BSO obtained from samples collected during the 2015 GEOTRACES TransArc II and 2016 GEOTRACES GRIFF cruises. Using our new observations, we provide inflows and outflows of tHg and MeHg in the Fram Strait and BSO. The main conclusions of this study are as follows:
- the outflowing upper Arctic waters in the EGC and on the NEGS were characterized by higher surface water tHg concentrations (1.29 ± 0.43 pM and 1.58 ± 0.53 pM, respectively) compared to the inflowing AW in the WSC (0.80 ± 0.26 pM).
- the shallow MeHg maximum typically found throughout the Arctic Ocean (100 – 300 m-depth) was found in the outflowing Arctic waters. Therefore, the outflowing Arctic water masses carry MeHg-enriched upper waters to the North Atlantic.
- among all stations and depths, the MeHg fraction ranged between < 2 and 78% of tHg (24 ± 14% of tHg), indicating that MeHg is the dominant species at several depths. The average DMHg/MMHg ratio in the Fram Strait was 2.6 ± 1.8, indicating that DMHg is the dominant MeHg species.
- oceanic tHg and MeHg fluxes via the Fram Strait and BSO were estimated to be in the range of model results. However, our estimated fluxes were based on field observations and these fluxes were characterized by lower uncertainties. A net outflow of tHg
11 ± 8 Mg y-1. Our observations indicated that approximately half of the exported tHg is in the MeHg form. In total, the Arctic Ocean exports approximately 18 Mg y-1 of tHg to the Nordic Seas and North Atlantic via the Fram Strait and Davis Strait, of which 7.5 Mg y-1 is in the MeHg form.
- the new estimated smaller tHg reservoir size (1,900 Mg) of the Arctic Ocean leads to a lower residence time against losses (approximately 9.5 years). The annual total inflow corresponds to about 10% of the reservoir size; therefore, tHg in the Arctic Ocean is relatively reactive to changes in the inputs and outputs. For instance, under climate change forcing, permafrost thawing and weather events are expected to increase the mobilization of tHg in river runoff (Schuster et al., 2018), which will likely lead to a rapid response of the Arctic Ocean.
- the outflowing waters of the EGC were determined to be enriched in tHg compared with the tHg concentrations in the Irminger Sea (1.29 ± 0.43 pM and 0.45 ± 0.51 pM, respectively). These results might be explained by rapid scavenging and/or evasion of Hg to the atmosphere. We propose that the late summer/early fall atmospheric Hg maximum in the Arctic might be partly supported by the evasion of Arctic outflowing Hg in the Nordic Seas. However, future investigations of Hg speciation and distribution in the Nordic Seas are needed.
Acknowledgments
We thank chief scientists Ursula Schauer and Torsten Kanzow; Captain Schwarze and his amazing crew of the FS Polarstern. We would like to thank the GEOTRACES team from the 2015 cruise: Sven Ober, Hans Slagter, Aridane G. González, as well as the sampling team from the 2016 cruise: Nicola Herzberg, Jaw Chuen Yong, and Florian Evers. We thank Takamasa Tsubouchi for sharing the water transport data and for fruitful discussions, and Wilken-Jon von Appen for providing helpful feedback. We also thank graduate students Javier A. Tesán Onrubia and Marine Canesi for their assistance with the laboratory work. We also thank Itziar Tesán Onrubia for the support with a graphical design. We thank the associate editor and all reviewers for their helpful comments and feedback.
References
Agather, A.M., Bowman, K.L., Lamborg, C.H., Chad, R., 2019. Distribution of mercury species in the Western Arctic Ocean (U.S. GEOTRACES GN01). Mar. Chem. 103686
Beszczynska-Möller, A., Fahrbach E., Schauer U., Hansen E., 2012. Variability in Atlantic water temperature and transport at the entrance to the Arctic Ocean, 1997 - 2010. Marine Science. 69, 852–863
Black, F.J., Paytan, A., Knee, K.L., De Sieyes, N.R., Ganguli, P.M., Gray, E., Flegal, A.R., 2009. Submarine groundwater discharge of total mercury and monomethylmercury to central California coastal waters. Environ. Sci. Technol. 43, 5652–5659
Bowman, K.L., Hammerschmidt, C.R., Lamborg, C.H., Swarr, G., 2015. Mercury in the North Atlantic Ocean: The U.S. GEOTRACES zonal and meridional sections. Deep. Res. Part II Top. Stud. Oceanogr. 116, 251–261
Cossa, D., Michel P., Noel J., Auger D., 1992. Vertical mercury profile in relation to arsenic, cadmium and copper at the eastern North Atlantic ICES reference station. Oceanol. Acta. 15, 603–608
Cossa, D., Cotte-Krief, M.H., Mason, R.P., Bretaudeau-Sanjuan, J., 2004. Total mercury in the water column near the shelf edge of the European. Mar. Chem. 90, 21–29
Cossa, D., Heimbürger, L.E., Lannuzel, D., Rintoul, S.R., Butler, E.C.V. V, Bowie, A.R., Averty, B., Watson, R.J., Remenyi, T., 2011. Mercury in the Southern Ocean. Geochim. Cosmochim. Acta. 75, 4037–4052
Cossa, D., Heimbürger, L.E., Pérez, F.F., García-Ibáñez, M.I., Sonke, J.E., Planquette, H., Lherminier, P., Boutorh, J., Cheize, M., Lukas Menzel Barraqueta, J., Shelley, R., Sarthou, G., 2018. Mercury distribution and transport in the North Atlantic Ocean along the GEOTRACES-GA01 transect. Biogeosciences. 15, 2309–2323
Cutter G., Casciotti K., Croot P., Geibert W., Heimbürger L.E., Lohan M., Planquette H., 2017. Sampling and Sample-handling Protocols for GEOTRACES Cruises. Version 3. http://www.geotraces.org/images/Cookbook.pdf
De Baar, H.J.W., Timmermans, K.R., Laan, P., De Porto, H.H., Ober, S., Blom, J.J., Bakker, M.C., Schilling, J., Sarthou, G., Smit, M.G., Klunder, M., 2008. Titan: A new facility for ultraclean sampling of trace elements and isotopes in the deep oceans in the international Geotraces program. Mar. Chem. 111, 4–21
Dietz, R., Sonne, C., Basu, N., Braune, B., Hara, T.O., Letcher, and others, 2013. Wh h c g c ff c f m c y c c b ? ci. Total Environ. 443, 775– 790
Fisher, J.A., Jacob, D.J., Soerensen, A.L., Amos, H.M., Corbitt, E.S., Streets, D.G., Wang, Q., Yantosca, R.M., Sunderland, E.M., 2013. Factors driving mercury variability in the Arctic atmosphere and ocean over the past 30 years. Global Biogeochem. Cycles. 27, 1226–1235
Fisher, J.A., Jacob, D.J., Soerensen, A.L., Amos, H.M., Steffen, A., Sunderland, E.M., 2012. Riverine source of Arctic Ocean mercury inferred from atmospheric observations. Nat. Geosci. 5, 499–504
Heimbürger, L., Sonke, J.E., Cossa, D., Point, D., Lagane, C., Laffont, L., Galfond, B.T., Nicolaus, M., Rabe, B., 2015. Shallow methylmercury production in the marginal sea ice zone of the central Arctic Ocean. Nat. Publ. Gr. 1–6
Kirk, J.L., St. Louis, V.L., Hintelmann, H., Lehnherr, I., Else, B., Poissant, L., 2008. Methylated mercury species in marine waters of the Canadian high and sub arctic. Environ. Sci. Technol. 42, 8367–8373
Lamborg, C.H., Hammerschmidt, C.R., Bowman, K.L., Swarr, G.J., Munson, K.M., Ohnemus, D.C., Lam, P.J., Heimbürger, L.E., Rijkenberg, M.J.A.A., Saito, M.A., 2014. A
global ocean inventory of anthropogenic mercury based on water column measurements. Nature 512, 65–68
Lehnherr, I., Louis, V.L.S., Hintelmann, H., Kirk, J.L., 2011. Methylation of inorganic mercury in polar marine waters. Nat. Geosci. 4, 298–302
Mason, R.P., Rolfhus, K.R., Fitzgerald, W.F., 1998. Mercury in the North Atlantic. Mar. Chem. 61, 37–53
Mauritzen, C., Hansen, E., Andersson, M., Berx, B., Beszczynska-Möller, A., Burud, I., Christensen, K.H., Debernard, J., de Steur, L., and others, 2011. Closing the loop - Approaches to monitoring the state of the Arctic Mediterranean during the International Polar Year 2007-2008. Prog. Oceanogr. 90, 62–89
Monperrus, M., Tessier, E., Amouroux, D., Leynaert, A., Huonnic, P., Donard, O.F.X., 2007. Mercury methylation, demethylation and reduction rates in coastal and marine surface waters of the Mediterranean Sea. Mar. Chem. 107, 49–63
Outridge, P.M., MacDonald, R.W., Wang, F., Stern, G.A., Dastoor, A.P., 2008. A mass balance inventory of mercury in the Arctic Ocean. Environ. Chem. 5, 89–111
Richter, M.E., Von Appen, W.J., Wekerle, C., 2018. Does the East Greenland Current exist in the northern Fram Strait? Ocean Sci. 14, 1147–1165
Rosati, G., Heimbürger, L.E., Melaku Canu, D., Lagane, C., Laffont, L., Rijkenberg, M.J.A.A., Gerringa, L.J.A.A., Solidoro, C., Gencarelli, C.N., Hedgecock, I.M., De Baar, H.J.W.W., Sonke, J.E., 2018. Mercury in the Black Sea: New Insights From Measurements and Numerical Modeling. Global Biogeochem. Cycles 32, 529–550
Schaffer, J., von Appen W. J., Dodd P. A., Hofstede C., Mayer C., de Steur L., Kanzow T., 2017. Warm water pathways toward Nioghalvfjerdsfjorden Glacier, Northeast Greenland. J. Geophys. Res. Oceans. 122, 4004–4020
The GEOTRACES Intermediate Data Product 2017. Chem. Geol. 493, 210–223
Soerensen, A.L., Jacob, D.J., Schartup, A.T., Fisher, J.A., Lehnherr, I., St Louis, V.L., Heimbürger, L.E., Sonke, J.E., Krabbenhoft, D.P., Sunderland, E.M., 2016. A mass budget for mercury and methylmercury in the Arctic Ocean. Global Biogeochem. Cycles 30, 560– 575
Sonke, J.E., Teisserenc, R., Heimbürger-Boavida, L.-E., Petrova, M. V, Marusczak, N., Le Dantec, T., Chupakov, A. V, Li, C., Thackray, C.P., Sunderland, E.M., Tananaev, N., Pokrovsky, O.S., 2018. Eurasian river spring flood observations support net Arctic Ocean mercury export to the atmosphere and Atlantic Ocean. Proc. Natl. Acad. Sci. 201811957
St. Louis, V.L., Hintelmann, H., Graydon, J.A., Kirk, J.L., Barker, J., Dimock, B., Sharp, M.J., Lehnherr, I., 2007. Methylated mercury species in Canadian high arctic marine surface waters and snowpacks. Environ. Sci. Technol. 41, 6433–6441
Steffen, A., Douglas, T., Amyot, M., Ariya, P., Aspmo, K., Berg, T., Bottenheim, J., Brooks, S., Cobbett, F., 2008. A synthesis of atmospheric mercury depletion event chemistry in the atmosphere and snow. Atmos. Chem. Phys. 8, 1445–1482
Steur, L. De, Hansen, E., Mauritzen, C., Beszczynska-Möller, A., Fahrbach, E., 2014. Deep- ch mp c f c c h E G F m : Results from moored current meter measurements between 1997 and 2009. Deep. Res. Part I 92, 26–40
Tsubouchi, T., Bacon, S., Aksenov, Y., Garabato, A.C.N., Curry, B., Lee, C.M., 2018. h c c Oc cyc f h f hw f : b - based inverse estimates. J. Phys. Ocean. 48, 2029-2055
Wang, F., MacDonald, R.W., Armstrong, D.A., Stern, G.A., 2012. Total and methylated mercury in the beaufort sea: The role of local and recent organic remineralization. Environ. Sci. Technol. 46, 11821–11828
Wang, K., Munson, K.M., Beaupré-Laperrière, A., Mucci, A., Macdonald, R.W., Wang, F., 2018. Subsurface seawater methylmercury maximum explains biotic mercury concentrations in the Canadian Arctic. Sci. Rep. 8, 14465
Zdanowicz, C., Kru, E.M., Lean, D., Poulain, A.J., Yumvihoze, E., Chen, J., Hintelmann, H., 2013. Accumulation , storage and release of atmospheric mercury in a glaciated Arctic catchment , Baffin Island , Canada 107, 316–335