HAL Id: ird-00288736
https://hal.ird.fr/ird-00288736
Submitted on 18 Jun 2008
HAL is a multi-disciplinary open access
archive for the deposit and dissemination of sci-entific research documents, whether they are pub-lished or not. The documents may come from teaching and research institutions in France or abroad, or from public or private research centers.
L’archive ouverte pluridisciplinaire HAL, est destinée au dépôt et à la diffusion de documents scientifiques de niveau recherche, publiés ou non, émanant des établissements d’enseignement et de recherche français ou étrangers, des laboratoires publics ou privés.
affecting Trichodesmium spp. (filamentous
cyanobacteria) blooms in the south-west lagoon of New
Caledonia
Martine Rodier, Robert Le Borgne
To cite this version:
Martine Rodier, Robert Le Borgne. Population dynamics and environmental conditions affecting Trichodesmium spp. (filamentous cyanobacteria) blooms in the south-west lagoon of New Cale-donia. Journal of Experimental Marine Biology and Ecology, Elsevier, 2008, 358 (1), pp.20-32. �10.1016/j.jembe.2008.01.016�. �ird-00288736�
Population dynamics and environmental conditions affecting Trichodesmium spp.
(filamentous cyanobacteria) blooms in the south-west lagoon of New Caledonia
Martine Rodier* and Robert Le Borgne1
* IRD, UR 167, Centre Océanologique de Marseille, Faculté des Sciences de Luminy, Case 901,
13288 Marseille Cédex 9, France
1
Centre IRD, UR 103, B.P. A5, 98800 Nouméa Cédex, New Caledonia
* Corresponding author: rodier@com.univ-mrs.fr
Suggested running head: Trichodesmium population dynamics
Abstract. The present description of Trichodesmium spp. population dynamics and associated
1
environmental variables is the first one using a very short sampling interval (2-3 days). Such a 2
strategy allows a fine description of changes involving the population density and characteristics. It 3
also lends itself to interpreting those changes from past environmental conditions. During the two 4
surveys, 2 and 5 month-long, T. erythraeum dominated the Trichodesmium population, with 5
temporary occurrence of T. thiebautii and five blooms could be described. These events appeared at 6
temperatures > 24°C and followed, in all cases, nitrate, soluble reactive phosphorus and chlorophyll 7
a enrichments, with a 3-7 day time lag. Low wind speed (< 4m s-1) was not a prerequisite for 8
Trichodesmium bloom developments as long as temperatures exceeded 26°C. As abundance
9
increased during the bloom, so did the number of filaments (trichomes) in colonies and their 10
buoyancy, leading to a clear positive biomass gradient from the bottom to the surface. A simple 11
model, using variable growth rates, showed trichome ascent would be responsible for 87-99% of 12
concentrations at 0.5m, with Trichodesmium net growth rates ranging from 0.11 to 0.38 d-1. Finally, 13
rapid trichome density declines could be ascribed to nutrient depletion and massive surface death 14 following ascent. 15 16 17 1. Introduction 18 19
High surface concentrations of the chain-forming diazotrophic cyanobacteria Trichodesmium spp. 20
have drawn attention, not only for their spectacular characteristics, but also for their potential 21
toxicity (Landsberg, 2002, ) and contribution to the carbon and nitrogen cycles in oligotrophic 22
regions via diazotrophy, i.e. di-nitrogen (N2) fixation (Karl et al., 2002). Such natural phenomena,
23
called "blooms" in most references, have often been observed in the south-west Pacific, both in the 24
open ocean (Dupouy et al., 2000) and coastal areas (Jones et al., 1982), as well as in other parts of 25
the tropical belt (Capone et al., 1997). While many causative mechanisms for bloom development 26
have been proposed in the past (Sellner, 1997), we still lack reliable descriptions of past 27
environmental conditions that triggered their increase. The word "bloom" itself remains imprecise 28
and is generally understood as corresponding to rapid and intense growth, as it does for other 29
phytoplankters, although it is now admitted that aggregation may be responsible for many observed 30
surface Trichodesmium concentrations. One of the reasons for such uncertainties is that many reports 31
are based on instant observations, no account being provided on past characteristics, biomass and 32
vertical distribution of the Trichodesmium population, as stressed by Carpenter et al. (2004). 33
Therefore, the understanding of bloom dynamics and causes would benefit from high frequency 34
observations of both cyanobacteria and environmental variables over the water column. 35
Such a strategy, involving very frequent sampling on a long period of time can virtually be made 36
in coastal areas, only. Present knowledge, however, rely on rather low frequency observations with 37
sampling being made every 7 – 15 days (Lugomela et al., 2002), 1 month (Post et al., 2002) or 10 – 38
15 days (Muslim and Jones, 2003). While correlations between simultaneous data on Trichodesmium 39
densities and environmental variables could be evidenced in these studies (Post et al., 2002; Muslim 40
and Jones, 2003), effect of potential bloom triggers and environmental conditions that are required 41
for bloom developments were not clearly proved because no information was collected in the few 42
days preceding the start of the blooming event. For the same reason, causes of high surface 43
aggregations remained hypothetical for lack of high temporal resolution surveys of Trichodesmium 44
density along the water column, so that discriminating between effects of growth, vertical migrations 45
and physical aggregation was impossible. Such considerations led to organizing “high” frequency 46
sampling at the entrance of the Bay of Ste Marie (Noumea, New Caledonia) with two surveys made 47
during the austral spring and summer, as both seasons are reported to be favourable for bloom 48
development. Surveys lasted for 2.5 (Survey I: 9 October - 19 December 2003) and 5 months 49
(Survey II: 15 November 2004 - 12 April 2005) with field measurements made at the same station, 50
three times per week. 51
Here, we describe the Trichodesmium population, the changes in filament (trichome) density, 52
degree of aggregation in colonies and vertical distribution during bloom development. From such a 53
description and observed biovolume increase rates, we will show that high surface concentrations are 54
due to growth and trichome ascent. Further, potential bloom triggers and favourable environmental 55
conditions, will be identified from monitored environmental variables that prevailed between 2 and 7 56
days before. These variables were selected, taking into account results of the Muslim and Jones 57
(2003) study in a similar shallow coastal site of the Great Barrier Reef (GBR, Australia): 58
meteorology (wind strength and rainfall), hydrology (temperature and salinity), dissolved inorganic 59
nutrients, turbidity, a proxy of suspended sediments, and chlorophyll, in addition to phytoplankton 60
and zooplankton composition. Finally, one of the usual criticism of conclusions based on a solitary 61
station deals with the effect of spatial heterogeneity on time-series data. This point will be 62
considered taking into account observations made simultaneously at the entrance and 2.0 km off the 63
bay. 64
65
2. Materials and methods
66 67
2.1. Sampling sites and general conditions (Fig. 1)
68
The study site, Sta. SM (22°18.86' S - 166°27.95' E, Fig. 1), was visited every Monday, 69
Wednesday and Friday, between 07:00 and 09:00. While the station is away from inhabited areas 70
and from urban inputs, it is protected from the prevailing SE trade winds and swell. A second 71
station, Sta. O (22°19.80’ S – 166°28.48’ E) was visited in 2004-2005, weather permitting for 72
comparison. Water column depth is 12 m and 28 m for Stas SM and O, respectively. 73
74
2.2. Meteorology, hydrology, and water sampling
75
Meteorological data were recorded at Faubourg Blanchot Meteo-France Station, 4.2 km away 76
from the entrance of the Bay of Ste Marie. 77
CTD profiles (1 m to bottom) were obtained with a SeaBird® SBE 19 probe, fitted with pressure, 78
temperature, salinity, turbidity, fluorescence and Photosynthetic Available Radiation (PAR) sensors. 79
Water samples were collected with 5 L-Niskin bottles at 0.5, 4, 7, and 10 m in 2003 and 0.5, 3, 6, 80
and 10 m in 2004-2005. Niskin bottles were siphoned in the laboratory on land for nutrient and 81
pigment analyses and Trichodesmium abundance, within one hour of sampling. 82
83
2.3. Nutrients and pigments
84
Nutrients were analyzed on HgCl2-preserved samples from 0.5 and 6-7 m. Nitrate (NO3)
85
concentrations were determined by colorimetry using a Technicon® auto-analyzer and standard 86
techniques (Strickland and Parsons, 1972), except for NO3 < 0.1µM, when the “high sensitivity”
87
procedure of Raimbault et al. (1990) was used. Soluble reactive phosphorus (SRP) concentrations 88
were measured with a Cecil® CE 1011 (10cm length-cell) spectrophotometer, using the molybdenum
89
blue reaction (Murphy and Riley, 1962). 90
Chlorophyll a (Chl a) was measured on the < 20 and > 20 µm size fractions at all sampled depths, 91
except for the > 20 µm fraction in 2004-2005, when analyses were only made at 3 and 10 m. For the 92
< 20 µm Chl a, 200ml were prefiltered through a 20 µm nylon screen and collected on Whatman® 93
GF/F filters. For the > 20 µm fraction, the whole Niskin bottle content was filtered through a 20 µm 94
screen and gently rinsed off with filtered seawater onto GF/F filters. All filters were stored in liquid 95
nitrogen until analysis within less than 2 weeks. Chl a was extracted in methanol and measured by 96
fluorometry as described by Le Bouteiller et al. (1992). 97
98
2.4. Trichodesmium abundance and biometry
99
Trichodesmium were collected on 20 µm nylon screen from the total content of Niskin bottles
100
(mean volume: 5.74 L) and transferred to a “sedimentation cell” with 5% formaldehyde. When 101
trichomes did not sink, a few drops of pure acetic acid were added to the cell, in order to lower 102
solution pH and break gas vesicles (Carpenter and Carmichael, 1995). Microscopic examinations and
enumeration were made 24 h later using a Leitz® Fluovert inverted microscope. Enumeration 104
considered free trichomes and fusiform (tuft) and spherical (puff) aggregates, usually called 105
“colonies” in the literature. The number of trichomes per colony was recorded and the volume of 106
each trichome was calculated from its measured length and diameter, assuming a cylindrical shape 107
for the organism. In this paper, Trichodesmium abundance has been expressed in terms of total 108
number of trichomes (i.e. free and in colonies) per litre (trich. L-1), or as trichome biovolume per 109
litre (µm3 L-1). Integrated values have been computed by the trapezoidal method. While trichome 110
density and biovolume are closely related (Fig. 2), due to the fact that biovolume data includes 111
trichome numbers, biovolume is often preferred as it gives a better estimate of the biomass. 112
Two species of Trichodesmium were identified according to Carpenter and Carmichael (1995) 113
and Janson et al. (1995). Individual cells of T. thiebautii Gomont are more long than wide and the 114
trichome has a convex apex whereas T. erythraeum Ehrenberg cells are more wide than long and the 115
trichomes have a flat apex. T. erythraeum colonies are usually darker than T. thiebautii colonies 116
(Carpenter et al., 1993). Such morphological differences between the two species have also been 117
confirmed by genetic finger prints of Trichodesmium spp. sampled in different areas of New 118
Caledonia, considering the hetR and rrs encoding for 16S rDNA genes, the internal transcribed 119
spacer (ITS) of the 16S-23S rDNA region and a highly iterated palindrome, HIP1 (Trottet, 2003). 120
121
2.5. Trichodesmium C, N and chlorophyll a contents
122
Plankton nets (35-µm mesh), towed at 1 m below the surface, were the source of 18-75 colonies 123
hand-picked, using a plastic inoculation loop, and transferred onto 25 mm Whatman GF/F filters for 124
Chl a measurements, or on pre-combusted filters for carbon (C) and nitrogen (N) analyses. 125
Filters for Chl a measurements were stored in liquid nitrogen and analyzed as described above. 126
For C, N determinations, filters were dried at 60°C and kept in a dessicator until analysis with a 127
Integra-CN PDZ EUROPA mass spectrometer. Single colonies were also selected for carbon 128
assimilation and nitrogen fixation experiments using 13C and 15N techniques (data not shown here, 129
but reported in Le Borgne et al., 2006). 130
Carbon, N and Chl a contents are expressed per colony (col-1) and per trichome (trich.-1). Since 131
analyses were made on colonies originating from plankton nets, the mean number of trichomes per 132
colony was obtained from microscopic observations of aliquots originating from the same catches 133
and processed as described before. 134
135
2.6. Microphytoplankton (>20µm) and Macrosetella abundance
136
Counts of the major phytoplankton taxa were conducted on samples from 2004-2005 survey. 137
Selected taxa were diatoms, dinoflagellates and Trichodesmium spp. The two specific 138
Trichodesmium spp. grazers, copepods Macro- and Microsetella spp. (Roman, 1978; O'Neil and
139
Roman, 1994) were all enumerated on all samples. They were grouped into the "Macrosetella" 140
taxon, since Macrosetella gracilis is the most abundant species in both our samples and lagoons of 141
the west coast of New Caledonia (Binet, 1984). 142
143
2.7. Trichodesmium biovolume net increase and carbon-specific growth rates
144
Using observed Trichodesmium biovolume increases, ∆Vi, exponential net increase rates, ki (in 145
d-1), can be calculated at depth, zi: 146
147
∆Vi = Vf,i - Vo,i with Vf,i =Vo,i e ki t⇒ ki = ln(Vf,i/Vo,i)/(tf - to) (1)
148 149
where Vf,i is the maximum biovolume of a peak period at time tf and Vo,i, at the initial time to.
150
Biovolume-based doubling time, d’A,i (in d), is equal to:
151 152
d’A,i = ln(2)/ki = ln(2) (tf - to)/(ln(Vf,i/Vo,i)) (2)
153 154
The carbon-specific growth rate for 0.5m depth, gC,0.5 , was obtained from 13C primary
155
productivity and elemental composition measurements, made on colonies in 2004-2005 (data 156
presented in Le Borgne et al., 2006). Calculations of gC,0.5 used the following equation:
157 158
gc,0.5 =ln((Co+ρC)/Co) (3)
159 160
where Co is the initial carbon concentration, ρC is the daily rate of carbon fixation, and time is
161
understood as one day. 162
163
2.8. Data processing
164
Non-parametric and Gaussian statistics were used, following Snedecor and Cochran (1967). 165
Bravais-Pearson and Spearman's rank correlation coefficients are r and rS, respectively, with level of
166
significance shown by * and ** for p<0.05 and p<0.01 significance, respectively; n is the number of 167
data per series, s, the standard deviation and p, the probability of rejection in the Wilcoxon and sign 168 tests. 169 170 3. Results 171 172
3.1. Trichodesmium population dynamics: abundance, vertical distribution and net increase rates
173
Trichodesmium spp. were always present, at least at one of the sampled depths and made almost
174
the totality of the pelagic filamentous cyanobacteria, Katagnymene spp. being quasi-absent. T. 175
erythraeum was the dominant species in 2003 (99.0% of the 5,513 counts) and 2004-2005 (83% of
176
the 10,650 counts) with T. thiebautii making the remainder. 177
Amidst a background of low trichome concentration, several periods of abrupt increase and 178
decline were observed during the two surveys (Fig. 3 and 4). When the abundance exceeded 5 179
trich.L-1 for at least two consecutive sampling times (i.e. 2-3 days), trichomes were considered as 180
thriving. Given the sharp variations, the term “bloom” will be used hereafter even though it is not 181
quite appropriate, in the sense that the Trichodesmium never dominated the microphytoplankton, 182
contributing a maximum of 27.7% of microphytoplankton counts. 183
Five blooms were observed with various features summarized in Table 1. Each bloom was 184
characterized by one peak abundance, except in 2003, when the 3 consecutive maxima were 185
interpreted as belonging to the same bloom (see Discussion). Peak amplitudes were variable from 186
one event to another and that of February 2005, although low, was considered as a bloom because 187
trichome densities were above 5 L-1 for 3 weeks. T. erythraeum was responsible for most of the 188
blooms, except in December 2004 and February 2005 when contribution of T. thiebautii was 189
significant. A striking point was the vertical distribution during the blooms, with a clear positive 190
gradient of trichome densities from deep to shallow depths (Fig. 3 and 4). 191
During the peak periods, the exponential net increase rate, ki, (equation 1), ranged from 0.19 to 192
1.51 d-1 at 6-7 and 10m and from 0.52 to 3.29 d-1 at 3-4 and 0.5m (Table 2). These ki values were 193
higher than carbon-specific growth rates, gC, 0.5 ,calculated from 13C uptake rates at 0.5m: 0.12-0.17
194
d-1 (Le Borgne et al., 2006). Exponential net increase rate calculations from biovolume variations 195
were not possible outside the peak periods, while carbon-specific growth rates, gC,0.5, provided by
196
the 13C uptake method were low, 0.022 d-1 on average (range: 0.017 – 0.050 d-1). 197
Finally, density variations were synchronized and of the same magnitude at stations SM and O 198
(Fig. 4) except from February 2005 on, when higher Trichodesmium densities were often found at 199
the latter site. Growth rates, estimated from the 13C experiments at both stations were similar (Le 200
Borgne et al., 2006). 201
202
3.2. Trichodesmium population features: trichome size, degree of aggregation and chemical
203
constituents
204
For both surveys, biovolume per trichome displayed quite a large range (Table 3), their length 205
variability was greater than the width one and T. thiebautii trichomes were significantly longer than 206
those of T. erythraeum (p< 0.001). There was no significant size difference between trichomes from 207
0.5 and 6 m, as well as from Sta. SM and O (not shown) and between 2003 and 2004-2005 for both 208
species. 209
During the two surveys, Trichodesmium population consisted mostly of free trichomes (65 ± 22 210
and 63 ± 15 % in 2003 and 2004-2005, respectively) and colonies in tuft morphology prevailed 211
(98% of the total number of colonies). Tufts were typically small, made of 2 to 34 trich. col-1 while 212
puffs of T. thiebautii were made up of 7 to 123 trich. col-1. As the number of free trichomes 213
increased during the peak periods, so did the number of trichomes in colonies, leading to a 214
significant correlation between the two forms (p<0.01; Fig. 5). Regression curves between densities 215
of trichomes in colonies and free trichomes were calculated for each of the two periods, using a 216
semi-log scale in order to take the anormal distribution of the free trichomes into account (Fig. 5). 217
Trichodesmium carbon, nitrogen and Chla content data, presented in Table 4, were quite variable,
218
likely due to different physiological or trophic states of filamentous cyanobacteria. Based on 219
trichome densities and Chl a content, Trichodesmium Chl a was estimated as accounting for no more 220
than 21% of total Chl a. Atomic C/N ratio averaged 6.2 (range: 4.6 - 7.4), a value close to the slope 221
(6.75) of the C versus N regression line (r2 = 0.96, n=10) and to the Redfield ratio. 222
To sum up, present surveys evidenced a shallower vertical distribution, higher growth rates and 223
more trichome aggregation in colonies during Trichodesmium blooms. These are the result of 224
environmental changes that are now considered. 225
226
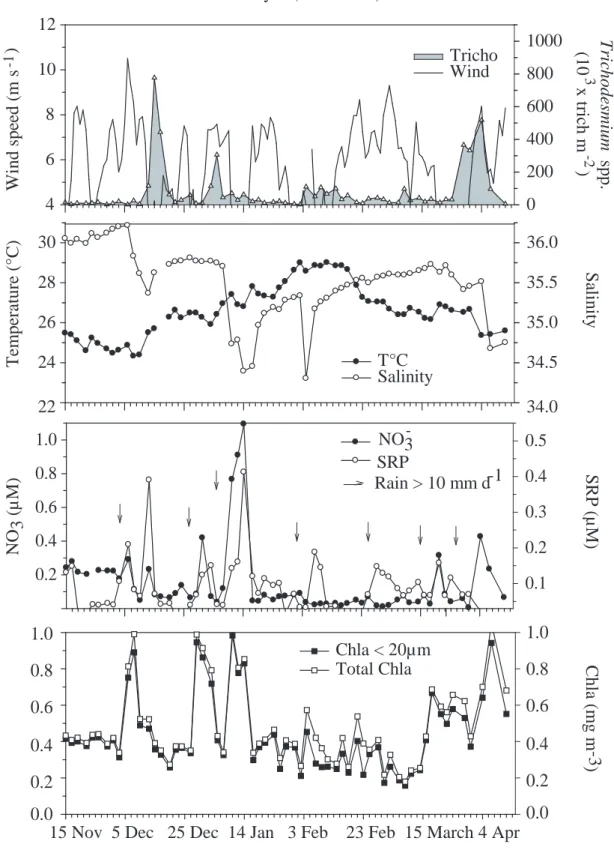
3.3. General environmental conditions and causes of bloom developments (Fig. 6 and 7)
227
Both surveys started in austral spring, a season characterized by settled SE trade winds (> 6 m.s-1) 228
and low rainfall. Sea temperature increased gradually until the beginning of February (Survey II), 229
reaching 29°C. Amidst this increasing trend, windy periods induced lower sea temperature and 230
higher salinity in spring. In summer and autumn, however, effect of wind on salinity was the 231
opposite, wind being associated to heavy rainfalls brought by tropical depressions, Kerry being one 232
of them in January 2005. Their major effect was high rainfall on the mainland and resulting lower 233
lagoon salinity (<35.00). 234
Nutrient concentration increases followed local rainfall, as recorded at Noumea Met station in 235
most instances. When they did not, they could be due, either to regional precipitation, not necessarily 236
recorded by coastal stations, or to wind events leading to resuspension of shallow sediments and 237
associated benthic nutrients (Muslim and Jones, 2003). The latter interpretation might indeed explain 238
the nitrate peaks of November 2003 (Fig. 6) and March 2005 (Fig. 7) and the peak of SRP of 239
January 2005, that took place during windy periods with no rainfall. 240
These increases in nutrient concentrations were not necessarily followed by total Chl a peaks for 241
reasons probably linked to vertical mixing or trace metal inhibitions, as discussed later for 242
Trichodesmium. Microphytoplankton contributed 15.9% (s = 8.0; n = 119) to total Chl a (>20 µm +
243
< 20 µm) in 2003 and 8.0% (s = 7.2; n = 130) in 2004-2005. Their main peak period occurred in 244
February 2005, following January nutrient inputs (Fig. 7). Diatoms dominated the 245
microphytoplankton, contributing 82% of the counts and dinoflagellates made most of the remainder 246
(11%). 247
Trichodesmium sp. started thriving at a water temperature, ranging from 24.2 to 28.6°C (Fig. 6
248
and 7). The vertical temperature gradient was variable from one bloom event to the other (0.05 to 249
0.84°C) and, therefore, did not seem to affect Trichodesmium development. The same conclusion 250
may be drawn for the vertical salinity gradient which ranged between 0.00 and 1.00. 251
A calm period (mean wind speed < 4 m s-1) preceded development of Trichodesmium blooms, 252
except in January 2005 (Fig. 7) when the bloom started and continued during a windy period (mean 253
wind speed before the bloom commenced: 7.3 m s-1). In this case, however, temperature was > 26°C. 254
In the other instances, windy periods did prevent Trichodesmium growth, as observed in November-255
December 2003, for example. Higher turbidity was not systematically associated with wind speed 256
and rather low turbidity was the rule most of the time. We conclude turbidity, as measured by the 257
CTD sensor, is not a good descriptor of blooming conditions. 258
Trichodesmium always (5/5 cases) throve after nutrient (NO3, SRP) and Chl a concentration
259
increases, that occurred within 3-7 days before the peak abundance (Fig. 6 and 7). Since it happened 260
in all 5 cases, its occurrence was significant (sign test at p< 0.10). In addition, amplitude of the peak 261
abundance at 0.5 m was significantly correlated (rS = 0.879*) with NO3 concentration at the start of
262
the bloom (Fig. 8), but not with SRP. 263
In order to test the nutrient and Chl a trigger hypothesis, we have considered whether all of their 264
increases were followed by blooms. During the two surveys, there were only two exceptions (5-7 265
November 2003 and 10-14 January 2005) when nutrient enrichments did not lead to any 266
development. In those two cases, the nutrient-Chl a increases were followed by windy periods (Fig. 267
6 and 7) which could, therefore, prevent bloom development. However, as seen previously, the wind 268
factor alone may not explain the second exception (January 2005) since temperature was >26°C. A 269
lower than usual salinity may be the direct or indirect reason for the lack of Trichodesmium bloom as 270
it was also for the lack of microphytoplankton biomass increase at the same period (Fig. 7). 271
In summary, according to the present observations, development of Trichodesmium blooms 272
would follow nutrient and Chl a concentration increases with a 3-7 day lag, provided temperature is 273
>26°C and no heavy and sustained rainfall occurs. The same conditions apply to > 24°C 274
temperatures, as long as wind speed is low (< 4 m s-1). 275
276
4. Discussion
277 278
4.1. Sampling strategy: are conclusions drawn from one station valid?
279
Study of Trichodesmium population dynamics employed high frequency sampling at Sta. SM, 280
assuming the same watermass and planktonic population were sampled for a long enough period. 281
This implies a rather long residence time, which is supported by the study of Jouon et al. (2006). 282
Thus, the "e-flushing time", a proxy of the water residence time, is 15-25 days at the entrance of the 283
bay, for a ~8 m s-1 (15.5 knots) SE wind velocity, and longer, of course, for lower wind speeds. 284
Besides, no significant tide effect was evidenced, especially in terms of salinity at 1m depth, because 285
water exchanges proceed from both the south and the east of Sta. SM (Fernandez et al., 2006). Note 286
also that Trichodesmium density and environmental parameter variations at Sta. SM displayed no 287
erratic trends, at least at a period of a week. It appears, therefore, that this station lent itself to a 288
satisfactory temporal description. 289
Moreover, present observations were representative of the surrounding lagoon waters, as seen for 290
the following parameters: (1) Trichodesmium spp. densities and microplankton abundance at 0.5 m 291
were in a fair agreement at the two stations even though Trichodesmium densities became higher out 292
of the bay from February 2005 on. (2) Proportions of the two Trichodesmium species or of other 293
microphytoplankton taxa were not significantly different at Sta. SM and O and (3) Trichodesmium 294
spp. growth rates, as provided by the 13C method, were similar at the two stations. All these 295
arguments support the view of a reasonable spatial homogeneity in the sampled area, which is the 296
prerequisite to temporal variation descriptions. 297
298
4.2. Trichodesmium population characteristics
299
Density as compared to other studies. Trichomes have been observed systematically during the
300
two surveys and appeared to be a component of the usual phytoplankton population, as happens in 301
the GBR where they would occur in 83% of the samples (Jones, 1992). However, they never made 302
the bulk of the phytoplankton at Sta. SM, with their Chl a accounting for no more than 21% of the 303
total. Similar contributions were reported by Letelier and Karl (1996) and Dupouy et al. (2000) for 304
the open ocean of the tropical Pacific although higher values (11- 62%) were found in the Atlantic 305
by Carpenter et al. (2004). 306
Maximum Trichodesmium abundances (240 and 244 trich. L-1 in 2003 and 2004, respectively) 307
reported in this study, are rather modest compared to those found in the literature (Table 5) and this 308
may be explained by differences in both methods and environmental conditions. Use of a 20µm 309
mesh, trichome transfer from the silk into the sedimentation cell, insufficient trichome sinking 310
(Lugomela et al., 2002) or use of a 5.74 L sampling bottle instead of a net (Chang, 2000) may be 311
reasons linked to the methodology. In addition, present results refer to samples at 0.5m while some 312
of the reported densities in the literature refer to the very near-surface (i.e. 0m), where much higher 313
concentrations could be associated with discoloured waters and accumulations along fronts or 314
Langmuir cells. It remains some of the high densities found in literature refer to subsurface maxima 315
(e.g. 12-24 m of Carpenter et al., 2004) and not to the very top surface, leading us to look for 316
environmental-related reasons. Thus, an element may limit growth of the filamentous cyanobacteria 317
and it is probably not dissolved iron, given its very significant concentrations in the SW lagoon, 318
ranging between 2 and 5 nM (unpublished data). These values are much above 1 nM, the 319
concentration given by Sanudo-Wilhelmy et al. (2003) for areas of non Fe-limited diazotrophy in the 320
Atlantic ocean. Phosphorus, however, could be the limiting element of primary production, 321
considering that its two possible sources are phosphorus depleted: runoffs from lateritic soils of this 322
part of New Caledonia (Tenorio et al., 2005) and exchanges with the surrounding oligotrophic ocean 323
(Van Den Broeck et al., 2004). This limitation could explain both the modest trichome density 324
maxima and the low Chl a (< 1 mg m-3) concentrations (Fig. 6 and 7). Lastly, the observed positive 325
and significant correlation found between trichome and diatom densities (rS = 0.395**; n = 41)
326
would suggest no negative effect of the main component of the microphytoplankton on 327
Trichodesmium. In conclusion, modest trichome density maxima of the present study might result
328
from a combination of different factors, the main one being possibly phosphorus limitation. 329
Specific composition. T. erythraeum was the dominant species with temporary occurrence of T.
330
thiebautii. The two species have distinct morphometric characteristics and they displayed much
331
higher length variations at Sta. SM (Table 3) than those reported by Post et al. (2002) in the Gulf of 332
Aqaba: 300 - 800 µm for T. erythraeum and 1000 - 2000 µm for T. thiebautii. 333
T. erythraeum dominance at Sta. SM, as in the GBR lagoon (Jones, 1992; Muslin and Jones,
334
2003) or the Tanzanian coast (Lugomela et al., 2002 ; Bryceson and Fay, 1981), the Mississipi 335
plume (Eleuterius et al., 1981) or the Bresilian coasts (Satô et al., 1963) might lead to the conclusion 336
it would be found more often in coastal areas than T. thiebautii. This seems to be corroborated by 337
observations made in the open ocean off the east coast of New Caledonia, where T. erythraeum 338
makes only 20-25% of the Trichodesmium filaments, while T. thiebautii and T. tenue would make 339
40-45% and 30% of the total, respectively (Tenorio, 2006).Actually, each of the two species is able 340
to prevail in the open ocean. It is T. erythraeum in the Coral Sea and T. thiebautii in the Caribbean 341
Sea (O’Neil et al., 1996 ), T. thiebautii in the Kuroshio area (Saino and Hattori, 1980) and the 342
Atlantic (Carpenter et al., 2004), but T. erythaeum in the north Indian Ocean (Capone et al., 1998). 343
Therefore, it seems unlikely that dominance of the two species would rely on the "hemisphere" as 344
suggested by Capone and Carpenter (1999), but rather on physiological and/or environmental 345
conditions, such as those prevailing in rather closed coastal areas, that seem to be more appropriate 346
to T. erythraeum. Such a feature may be explained by a lower diazotrophic capacity of this species 347
(Carpenter et al., 1993), which would imply its preference for less oligotrophic areas than T. 348
thiebautii, on the one hand, and by less resistance of its vacuoles to pressure, which means less
349
adaptation to deep environments, on the other hand (Carpenter et al., 1993). 350
Contribution of trichomes in colonies to total. Most (98%) of the colonies were of the tuft type
351
and made of < 20 trichomes, on average. Similar numbers were found for T. erythraeum by 352
Bryceson and Fay (1981) and Capone et al. (1998) with respectively, 5.5-10 and 10-30 trich. col-1. 353
But Carpenter et al. (2004), Letelier and Karl (1996) and Post et al. (2002) reported numbers > 100 354
for both T. erythraeum and T. thiebautii. 355
Also variable in the literature is the proportion of the number of aggregated trichomes to total 356
number of trichomes, or "bundleness" (Bryceson and Fay, 1981): ratios <20% were observed in the 357
North Pacific (Saino and Hattori, 1980 ; Letelier and Karl, 1996) and in the Atlantic (Orcutt et al., 358
2001 ; Tyrell et al., 2003) while bundleness ranged from 25 to 90% off the Tanzanian coast 359
(Bryceson and Fay, 1981) and in the tropical Atlantic (Carpenter et al., 2004). Such variability is 360
discussed by the latter authors and could originate from damages to the colonies during the sampling 361
and sorting processes, too small a sampled volume, and/or a "fundamental difference in the state of 362
trichomes" between the different regions. Further, Orcutt et al. (2001), Fu and Bell (2003b) and Bell 363
et al. (2005) suggest there would be more of free trichomes during the optimum growth phase, and 364
more aggregation during the non optimum phases. Effect of wind speed and related water turbulence 365
on bundleness is invoked by Bryceson and Fay (1981) and would be negative, although the present 366
work does not support such a view, with bundleness not lower than usual during the windy January 367
2005 peak. More simply, present observations (Fig. 5) suggest bundleness would follow encounter 368
probability law, i.e. the higher the trichome density, the higher the probability, thus agreeing with the 369
view of Carpenter et al. (2004) of density-related bundleness. But, whatever the factors involved in 370
colony formation, high bundleness seems to be typical of Trichodesmium blooms and responsible for 371
higher nitrogen fixation rates (Saino and Hattori 1980; Bryceson and Fay, 1981; Letelier and Karl, 372
1998; Capone, 2001). 373
374
4.3. Trichodesmium bloom features: respective roles of growth and ascent
375
A striking result in the present study and many other publications, is the intensity of 376
Trichodesmium density increases, which appear to be inversely related to depth (Table 2): the
377
shallower the level, the greater the increase. Moreover, doubling times d’A, calculated on biovolume
378
increases at 0.5, 3 - 4 and 6-7 m (Table 2), are much shorter than those reported in the literature for 379
growth (Table 6), while d’A,10 at 10 m are in good agreement. From these observations, we conclude
380
d’A,10 mainly result from growth and d’A,i of shallower depths, result from growth plus another
381
process. The latter is very likely the trichome ascent due to their positive buoyancy, a process which 382
delivers them more or less rapidly to the surface as they grow and which would explain the observed 383
vertical density gradient from the bottom to the surface (Fig. 3 and 4). Inversely, this gradient cannot 384
be ascribed to trichome sinking because microscopic observations showed healthy trichomes at all 385
depths and no or few trichomes were retrieved in sediment traps of the 2003 survey (Le Borgne et 386
al., 2004). 387
Trichodesmium positive buoyancy is well known and T. erythraeum has been reported more
388
buoyant than T. thiebautii (Carpenter et al., 1993; Lugomela et al., 2002), which would explain the 389
modest increases of February 2005 at 0.5 m when T. thiebautii contribution was significant. Such 390
positive buoyancy, linked to the presence of gas vesicles (Capone et al., 1997), is different from that 391
governing daily up and down vertical motion, with diel variations of the carbohydrate to protein ratio 392
(Villareal and Carpenter, 2003). 393
In order to test whether trichome biovolume increases (∆Vi) observed during the bloom periods, 394
resulted from both their net growth (Gi) and ascent (Ai) from deeper levels and in order to estimate 395
the respective contributions of the two processes, we used a simple model. Provided spatial 396
heterogeneity is negligible, as compared to temporal variability (see 4.1.), observed ∆Vi at depth zi, 397
between t0 and tf (see eqn (1)) may be ascribed to the sum of Gi and Ai:
398 399
∆Vi = Vf,i – Vo,i = Gi + Ai ↔ ∆Vi – (Gi + Ai) = 0 (4)
400 401 with Gi =
∑
= tf to tVo,i e gi t ∆t, gi, being the exponential net growth rate, ∆t, the time interval.
402
Corresponding doubling time, dA,i, is equal to: dA,i = ln(2)/gi. Now, assuming trichome ascent, Ai,
403
would proceed at the same pace as growth and gi be the same along the water column, Ai will be the 404
integral of Gi with depth: Ai =
∑
= zi z 12 Gi ∆z =
∑
= tf to t∑
= zi z 12Vo,i e gi t ∆t ∆z , where∆z is the difference
405
between two sampled depths and 12 m, the Sta. SM depth. 406
Calculations of Ai and Gi have been made for zi = 0.5 m, with the following ∆z: 12-10 m, 10-7 407
m, 7-4 m, 4-0.5 m in 2003 and 12-6 m and 6-0.5 m in 2004-2005. We solved equation (4), and 408
considered the realism of computed doubling times, dA, 0.5 (Table 7). Except for the December 2004
409
event, dA, 0.5 values (1.82 - 6.45 d) are within the range of the doubling times in the literature (Table
410
6) and include the December 2003 biovolume doubling time at 10m, d’A, 10 = 2.9 d (Table 2). The
411
December 2004 low dA, 0.5 value (0.53 d) may be ascribed to an underestimated initial biovolume,
Vo,0.5,which is used in equation 4. Estimates of A0.5 and G0.5 show that most (87 to 99%) of
413
biovolume increase observed at 0.5m (∆V0.5), would be due to A0.5. Ascent contribution variability
414
might be linked to the mixing intensity of the water column, as illustrated by the windy January 2005 415
bloom, which had the lowest ascent contribution (Table 7). 416
In this type of calculation applied to peak periods, the growth rates (gi) varied from one peak 417
abundance to another (g0.5 = 0.11 – 0.38 d-1). They varied also between non bloom and bloom
418
periods, as illustrated by the carbon-specific growth rates, provided by 13C uptake measurements. 419
Indeed, a ratio of 5.1 - 7.4 (see Results) between bloom and "normal" periods may be computed, 420
leading us to the next question: what is the origin of gi variations leading to bloom developments? 421
422
4.4. Causes of bloom developments: favorable conditions and triggers
423
These may be shared into necessary conditions which allow blooms to occur, and triggers that 424
effect gi. The latter have been identified as nutrient increases during the 3-7 preceding days for all 425
the blooms, which supports observations made by Carpenter and Price (1977), Bell et al. (1999), 426
Muslim and Jones (2003) regarding a phosphate effect and Lugomela et al. (2002) about nitrate-427
related blooms. Because diazotrophy is phosphorus-dependent (Sanudo-Wilhelmy et al., 2001; Fu 428
and Bell, 2003a; Mills et al., 2004), the role played by SRP in bloom developments seems to be 429
obvious. Less straightforward, however, may look the NO3increase effect on diazotrophic
430
cyanobacteria growth. In fact, di-nitrogen fixation is usually low or absent when other nitrogenous 431
compounds are available since it is high energy demanding and repressed by NH4 (Mulholland and
432
Capone, 2000; Karl et al., 2002). At Sta SM, very low 15N2 fixation rates were indeed measured on
433
Trichodesmium colonies during the March-April 2005 bloom (Le Borgne et al., 2006), suggesting
434
most of their nitrogen needs were fulfilled by other compounds. Ammonium and very small 435
dissolved organic nitrogen (DON) molecules, which are released or produced by the microbial loop, 436
seem to be the best candidates, although such a statement cannot be proved for a lack of 437
measurements. 438
Then we get to the following scenario which fits observations at Sta SM. Observed Chl a 439
increases are very quick responses to NO3 inputs. Part of the Chl a increases may be due to diatoms,
440
which have a higher NO3 uptake capacity than most phytoplankters (Sarthou et al., 2005), and likely
441
respond immediately to nutrient inputs and lead to higher concentrations of ammonium and small 442
DON molecules through bacterial remineralization and microzooplankton grazing. These are taken 443
up eventually by filamentous cyanobacteria with a 3-7 d time-lag between NO3 increases and
444
Trichodesmium bloom initiation. The direct relation between Trichodesmium and diatom densities
445
reported before may therefore be interpreted in this way. 446
The nutrient-related scenario suffers a troubling exception: the most important nutrient increase 447
of the two surveys, in January 2005, was followed nor by Trichodesmium nor by 448
microphytoplankton development, while the whole area was invaded by waters of lower than usual 449
salinity. The salinity may not be incriminated per se, considering maximum Trichodesmium growth 450
occurs in the 30 - 37 psu range (Fu and Bell, 2003b; Bell et al., 2005). It may rather indicate 451
important terrigenous inputs of suspended sediments and heavy metals and their possible inhibition 452
of microphytoplankton (including Trichodesmium) growth. Inhibition could proceed through light 453
limitation due to a heavy load of suspended particles. No significant increase in turbidity (data not 454
shown) was observed, however. Different could be the heavy metals inhibitory effect and Fernandez 455
et al. (2006) have shown Fe, Ni, Cr, Co, Mn, Cu and Sr are issued from laterite weathering, and 456
carried along from several estuaries, south of Noumea (e.g., La coulee, Fig. 1). There may be also an 457
impact of the amount and type of organic matter from terrigenous origin, on the microphytoplankton, 458
although this topic has not been documented, yet. 459
Bloom triggers work, provided necessary conditions are met, i.e. appropriate iron concentration, 460
temperature and wind velocity. As seen above, iron is probably non limiting in the present study, but 461
sunny and calm weather conditions may be necessary ones as invoked in the past by many authors 462
(Eleuterius et al., 1981; Jones et al., 1992; Sellner, 1997; Lugomela et al. (2002) ; Muslim and 463
Jones, 2003 ; Carpenter et al., 2004). However, calm weather is not sufficient a condition because 464
there may be blooms during long periods of wind, as illustrated by the January 2005 event. Based on 465
this example, when temperature was ~ 26°C, we conclude that blooms may occur during windy 466
periods, only if sea temperature is above this threshold value, thus confirming the Carpenter and 467
Capone (1992) analysis on bloom conditions. Inversely, below 26°C, a low wind velocity appears to 468
be necessary for bloom development. The minimum temperature for them to occur is 24°C in the 469
present study, which is less than the 25°C threshold of Chen et al. (2003). Combination of wind and 470
temperature effects can be interpreted as the result of two antagonist actions on growth rates, 471
positively correlated to temperature and negatively to wind induced-mixing. It follows that, when 472
temperature reaches a threshold value, its effect on growth will overcome the negative effect of 473 mixing. 474 475 4.5. Decline origin 476
One of the striking points in the two surveys, was the brevity of the bloom decline phase, as for 477
the growing one. Decline may be ascribed to mortality and to a recruitment diminution due to a 478
growth rate slowdown as for any population, even though they might have common origins. In the 479
present study, most blooms ended with very low nutrient concentrations ( <0.030 µM NO3 at the end
480
of the December 2003 and February 2005 events and <0.030 µM SRP for those of February and 481
April 2005), which suggests nutrient exhaustion represents one of the decline causes, as mentioned 482
already by Lenes et al. (2005) and Moutin et al. (2005). This process could reduce growth rates, in a 483
way opposite to the nutrient increase effect described above, or induce mortality through a 484
"Programmed Cell Death" (PCD) pathway (Berman-Frank et al., 2004, 2007). Viral lysis (Ohki, 485
1999) and PCD, caused by other factors than nutrient depletion, as listed by Berman-Franck et al. 486
(2004), are other possible processes. Inversely, intense grazing is likely excluded, considering the 487
low Macrosetella densities that were observed and their lack of relationship with trichome 488
concentrations. But the present observations on trichome ascent and surface accumulation during 489
bloom periods with no obvious sinking or downward migration do not exclude massive destruction 490
by solar radiation as infra-red or ultra-violet rays, independently of other processes. The solar effect 491
is likely linked to the sea surface agitation, with a more rapid destruction during calm sea and low 492
wind conditions. On the whole, apart from trichome viral lysis or PCD, abrupt decay could be the 493
result of ascent to the very top surface, solar destruction and lack of new trichome formation for 494
nutrient exhaustion. 495
496
4.6. Summary of Trichodesmium bloom dynamics as illustratedby the November - December 2003
497
event
498
A summary of present conclusions on the bloom triggering factors (nutrient concentration 499
increases), necessary conditions (combination of wind and temperature effects) and causes of bloom 500
decay can be illustrated by the Nov-Dec 2003 event. Although it was made of three peak 501
abundances, the following description shows it was only one event (Fig. 6). 502
An increase in nutrient concentrations was observed on 19 - 21 November for NO3 and 17
503
November for SRP. At that time, water temperature was around 24°C and development could not 504
start before the wind velocity diminished. This occurred on the 23rd and was likely responsible for 505
the observed trichome density and biovolume increase between 21 and 28 November. On 29 506
November, while temperature was now 25°C, but still < 26°C, the wind started blowing again, which 507
resulted in the first trichome density diminution between 28 November and 3December. The wind
508
slowed down between 4 and 5 December, allowing another Trichodesmium increase with a peak on 509
the 5th. Calm weather conditions lasted until the 11th, allowing trichome ascent and mortality at 0m 510
with the resulting biovolume decrease at all depths between 5 and 8 December and a small 511
development between 10 and 12 December, once temperature had reached 26°C. The bloom ended 512
when NO3 became exhausted (< 0.005 µM at 0.5m), i.e. from the 10th, on.
513 514
5. Conclusion
Photosynthetic filamentous cyanobacteria of the Trichodesmium genus, display the same 516
physiological processes as the other co-occuring phytoplankton and have the same requirements. In 517
particular, dissolved nutrients are primarily involved in their growth processes. But the present 518
surveys have shown major differences, with very steep density variations and changes in the 519
cyanobacterial vertical distribution during the blooms, both being the result of the trichome positive 520
buoyancy. This characteristic has two consequences: (1) most of the biomass accumulation will 521
happen at 0m and not in the water column; (2) once they have reached the very top surface, 522
trichomes will remain there, and eventually be destroyed. In addition, because of their toxicity, the 523
grazing control of the Trichodesmium population appears to be restricted to a few species, like 524
harpacticoid copepods (Hawser et al., 1992) and these were not abundant in the studied area. These 525
two features of the Trichodesmium population dynamics, i.e. effects of positive buoyancy and low 526
grazing losses, make it quite different from what happens to the rest of the phytoplankton 527
community. Such a statement, however, is based on observations of a T. erythraeum dominated 528
population, which is known to be more buoyant and less diazotrophic than T. thiebautii. Therefore, 529
bloom causes and characteristics of T. thiebautii populations might be different to some extent and 530
would deserve a similar study, related to the toxicity issue, this species being considered as more 531
toxic than T. erythraeum (Sellner, 1997; Landsberg, 2002). 532
Acknowledgements
This work was supported by IRD through its Research Units 103 and 167 and by the New Caledonian field site of Programme National Environnement Côtier (PNEC). Authors thank Meteo-France for providing Met data and are indebted to Florent Abrahami, Miguel Clarque, Philippe Gérard, Jennifer Goujon, Alain Lapetite, Isabelle Mazzeo, and Catherine Rouchon for technical assistance at sea and in the laboratory. They thank Nicole Garcia and Patrick Raimbault for carbon
and nitrogen analyses and data processing and Emma Rochelle-Newall and an anonymous referee for improvement suggestions of the manuscript.
References
Bell, P.R.F., Elmetri, I., Uwins, P., 1999. Nitrogen fixation by Trichodesmium spp. in the Central and Northern Great Barrier Reef lagoon: relative importance of the fixed-nitrogen load. Mar. Ecol. Prog. Ser. 186, 119-126.
Bell, P.R.F., Uwins, P.J.R., Elmetri, I., Phillips J.A., Fu, F.X., Yago, A.J.E., 2005. Laboratory culture studies of Trichodesmium isolated from the Great Barrier Reef Lagoon, Australia. Hydrobiologia 532, 9-21.
Berman-Frank, I., Bidle, K. D., Haramaty, L., Falkowski, P., 2004. The demise of the marine cyanobacterium, Trichodesmium spp., via an autocatalyzed cell death pathway. Limnol. Oceanogr. 49, 997-1005.
Berman-Frank, I., Rosenberg, G., Levitan, O., Haramaty, L., Mari, X., 2007. Coupling between autocatalytic cell death and transparent exopolymeric particle production in the marine cyanobacterium Trichodesmium. Environt. Microbiol. doi. : 10.1111/j.
1462-2920.2007.01257.x.
Binet, D., 1984. Copépodes planctoniques du lagon de Nouvelle-Calédonie: facteurs écologiques et associations d'espèces. Mar. Biol. 82, 143-156.
Bryceson, I., Fay, P., 1981. Nitrogen fixation in Oscillatoria (Trichodesmium) erythraea in relation to bundle formation and trichome differenciation. Mar. Biol. 61, 159-166.
Capone, D. G., Carpenter, E. J., 1999. Nitrogen fixation by marine cyanobacterium : historical and global perspectives. Bull. Inst. Océanogr. Monaco 19, 235-256.
Capone, D. G., Zehr, J. P., Paerl, H. W., Bergman, B., Carpenter, E. J., 1997. Trichodesmium, a globally significant marine cyanobacterium. Science 273, 1221-1229.
Capone, D. G., Subramaniam, A., Montoya., J. P., Voss, M., Humborg, C., Johansen, A. M., Siefert, R. L., Carpenter, E. J., 1998. An extensive bloom of N2-fixing cyanobacterium Trichodesmium
erythraeum in the central Arabian Sea. Mar. Ecol. Prog. Ser. 172, 281-292.
Carpenter, E. J., Price, C. C., 1977. Nitrogen fixation, distribution, and production of Oscillatoria (Trichodesmium) spp. in the western Sargasso and Caribbean Seas. Limnol. Oceanogr. 22, 60-72.
Carpenter, E.J., Romans, K., 1991. Major role of the cyanobacterium Trichodesmium in nutrient cycling in the North Atlantic ocean. Science 254, 1356-1358.
Carpenter, E. J., Capone, D. G., 1992. Nitrogen fixation in Trichodesmium blooms. In: Carpenter, E. J., Capone, D. G., Rueter, J. G. (Eds.), Marine Pelagic cyanobacteria: Trichodesmium and other Diazotrophs. Kluwer Academic Publishers, Dordrecht, pp. 211-217.
Carpenter, E. J., Carmichael, W. W., 1995. Taxonomy of Cyanobacteria,. In: Hallegraeff, G. M., Anderson, D. M., Cembella, A. D. (Eds), Manual on Harmful marine algae. UNESCO, Paris, pp. 373-380.
Carpenter, E. J., O’Neil, J. M., Dawson, R., Capone, D. G., Siddiqui, P. J. A., Roenneberg, T., Bergman, B., 1993. The tropical diazotrophic phytoplankter Trichodesmium : biological characteristics of two common species. Mar. Ecol. Prog. Ser. 95, 295-304.
Carpenter, E. J., Subramaniam, A., Capone, D. G., 2004. Biomass and primary productivity of the cyanobacterium Trichodesmium spp. in the tropical N Atlantic ocean. Deep-Sea Res. I 51, 173-203.
Chang, J., 2000. Precision of different methods used for estimating the abundance of the nitrogen-fixing marine cyanobacterium, Trichodesmium Ehrenberg. J. Exp. Mar. Biol. Ecol. 245, 215-224.
Chen, Y-B. L., Chen, H-Y., Lin, Y-H., 2003. Distribution and downward flux of Trichodesmium in the South China Sea as influenced by the transport from the Kuroshio Current. Mar. Ecol. Prog. Ser. 259, 47-57.
Dupouy, C., Neveux, J., Subramaniam, A., Mulholland, M. R., Montoya, J. P., Campbell, L., Carpenter, E. J., Capone, D. G., 2000. Satellite captures Trichodesmium blooms in the southwestern tropical Pacific. Eos 81, 15-16.
Eleuterius, L., Perry, H., Eleuterius, C., Warren, J., Caldwell, J., 1981. Causative analysis on a nearshore bloom of Oscillatoria erythraea (Trichodesmium) in the Northern Gulf of Mexico. Northeast Gulf Science 5, 1 -11.
Fernandez, J-M., Ouillon, S., Chevillon, C., Douillet, P., Fichez, R., Le Gendre, R., 2006. A combined modelling and geochemical study of the fate of terrigenous inputs from mixed natural and mining sources in a coral reff lagoon (New Caledonia). Mar. Pollut. Bull. 52, 320-331.
Fu, F.-X., Bell, P. R. F., 2003a. Factors affecting N2 fixation by the cyanobacterium Trichodesmium
sp. GBRTRLI101. FEMS Microbiol. Ecol. 45, 203-209.
Fu, F.-X., Bell, P. R. F., 2003b. Effect of salinity on growth, pigmentation, N2 fixation and alkaline
phosphatase activity of cultured Trichodesmium spp. Mar. Ecol. Prog. Ser. 257, 69-76. Hawser, S.P., O’Neil, J.M., Roman, M.R. Codd, G.A., 1992. Toxicity of blooms of the
cyanobacterium Trichodesmium to zooplankton. J. Applied Phycol. 4, 79-86.
Janson, S., Siddiqui, P. J. A., Walsby, A.E., Romans, K.M., Carpenter, E. J., Bergman, B., 1995. Cytomorphological characterization of the planktonic diazotrophic cyanobacteria
Trichodesmium spp. from the Indian Ocean and Caribbean and Sargasso Seas. J. Phycol. 31,
463-477.
Jones, G. B., 1992. Effect of Trichodesmium blooms on water quality in the Great Barrier Reef Lagoon,. In: Carpenter, E. J., Capone, D. G., Rueter, J. G. (Eds.), Marine Pelagic
Cyanobacteria: Trichodesmium and other Diazotrophs. Kluwer Academic Publishers, Dordrecht, pp. 273-287.
Jones, G.B., Burdon-Jones, C., Thomas, F.G., 1982. Influence of Trichodesmium red tides on trace metal cycling at a coastal station in the Great Barrier Reef Lagoon. Oceanol. Acta Special Publication, 319-326.
Jouon, A., Douillet, P., Ouillon, S., Fraunié, P., 2006. Calculations of hydrodynamic time parameters in a semi-opened coastal zone using a 3D hydrodynamic model. Cont. Shelf Res.26, 1395-1415.
Karl, D., Michaels,A., Bergman, B., Capone, D. G., Carpenter, E.J., Letelier, R., Lipschultz, F., Paerl, H., Sigman, D., Stal, L., 2002. Dinitrogen fixation in the world’s oceans.
Biogeochemistry 57/58, 47-98.
Landsberg, J.H., 2002. The effects of harmful algal blooms on aquatic organisms. Rev. Fish. Sci. 10, 113-390.
Le Borgne, R., Faure, V., Raimbault, P., Rodier, M., 2004. Suivi de l'abondance de Trichodesmium
spp. (cyanobactéries filamenteuses) et des paramètres du milieu lagonaire en Baie de
Sainte-Marie (Nouméa, Nouvelle-Calédonie):7 octobre - 19 décembre 2003. Arch. Sc. Mer IRD/Nouméa 6, 1-50.
Le Borgne, R., Mazzeo, I., Raimbault, P., Rodier, M., Rouchon, C., 2006. Suivi de Trichodesmium
spp. (cyanobactéries filamenteuses) et des paramètres du milieu lagonaire en baie de
Sainte-Marie, Nouméa, Nouvelle-Calédonie. 3 novembre 2004 - 12 avril 2005. Arch. Sc. Mer IRD/Nouméa 8, 1-55.
Le Bouteiller, A., Blanchot, J., Rodier, M., 1992. Size distribution patterns of phytoplankton in the western Pacific: towards a generalization for the tropical ocean. Deep-Sea Res 39, 803-823. Lenes, J.M., Walsh, J.J., Otis, D.B., Carder, K.L., 2005. Iron fertilization of Trichodesmium off the
west coast of Barbados: A one-dimensional numerical model. Deep-Sea Res. I 52, 1021-1041. Letelier, R. M., Karl, D. M., 1996. Role of Trichodesmium spp. in the productivity of the subtropical
Lugomela, C., Lyimo, T. J., Bryceson, I., Semesi, A. K., Bergman, B., 2002. Trichodesmium in coastal waters of Tanzania: diversity, seasonality, nitrogen and carbon fixation. Hydrobiologia 477, 1-13.
Mills, M. M., Ridame, C., Davey, M., La Roche, J., Geider, R. J., 2004. Iron and phosphorus co-limit nitrogen in the tropical North Atlantic. Nature 429, 292-294.
Moutin, T., Van Den Broeck, N., Beker, B., Dupouy, C., Rimmelin, P., Le Bouteiller, A., 2005. Phosphate availability controls Trichodesmium spp. biomass in the SW Pacific Ocean. Mar. Ecol. Prog. Ser. 297, 15-21.
Mulholland, M. R., Capone D. G., 2000. The nitrogen physiology of the marine N2-fixing
cyanobacterium Trichodesmium spp.. Trends Plant Sci. 5, 148-153.
Mulholland, M. R., Bernhardt, P. W., 2005. The effect of growth rate, phosphorus concentration, and temperature on N2 fixation, carbon fixation, and nitrogen release in continuous cultures of
Trichodesmium IMS 101. Limnol. Oceanogr. 50, 839-849.
Murphy, J., Riley, J.P., 1962. A modified single solution method for the determination of phosphate in natural waters. Anal. Chim. Acta 26, 31-36.
Muslim, I., Jones, G.B., 2003. The seasonal variation of dissolved nutrients, chlorophyll a and suspended sediments at Nelly Bay, Magnetic Island. Estuar. Coastal Shelf Sci. 57, 445-455. Negri, A.P., Bunter, O., Brian, J., Llewellyn, L., 2004. Effects of the bloom-forming alga
Trichodesmium erythraeum on the pearl oyster Pinctada maxima. Aquaculture 232, 91-102.
Ohki, K., 1999. A possible role of temperate phage in the regulation of Trichodesmium biomass. Bull. Inst. Océanogr. Monaco 19, 287-291.
O’Neil, J. M., Roman M. R., 1994. Ingestion of the cyanobacterium Trichodesmium spp. by pelagic harpacticoid copepods Macrosetella, Miracia and Oculosetella. Hydrobiologia 292/293, 235-240.
O'Neil, J.M., Metzler, P.M., Glibert, P.M., 1996. Ingestion of 15N2-labeled Trichodesmium spp. and
ammonium regeneration by the harpacticoid copepod Macrosetella gracilis. Mar. Biol. 125, 89-96.
Orcutt, K. M., Lipschultz, F., Gundersen, K., Arimoto, R., Michaels, A. F., Knap, A. H., Gallon, J. R., 2001. A seasonal study of the significance of N2 fixation by Trichodesmium spp. at
Bermuda Atlantic Time-series Study (BATS) site. Deep-Sea Res. II 48, 1583-1608. Post, A. F., Dedej, Z., Gottlieb, R., Li, H., Thomas, D. N., Absawi, M., Naggar, A.,
El-Gharabawi, M., Sommer, U., 2002. Spatial and temporal distribution of Trichodesmium spp. in the stratified Gulf of Aqaba, Red Sea., Mar. Ecol. Prog. Ser. 239, 241-250.
Prufert-Bebout, L., Paerl, H.W., Lassen, C., 1993. Growth, nitrogen fixation and spectral attenuation in cultivated Trichodesmium species. Appl. Environ. Microbiol. 59, 1367-1375.
Raimbault, P., Slawyk, G., Coste, B., Fry, J., 1990. Feasibility of using an automated colorimetric procedure for the determination of seawater nitrate in the 0 to 100 nM range: examples from field and culture, Mar. Biol. 104, 375-351.
Revelante, N., Gilmartin, M., 1982. Dynamics of phytoplankton in the Great Barrier Reef Lagoon. J. Plankton Res. 4, 47-76.
Riedel, G.F., J. G. Sanders, Breitburg, D. L., 2003. Seasonal Variability in Response of Estuarine Phytoplankton Communities to Stress: Linkages between Toxic Trace Elements and Nutrient Enrichment. Estuaries 26, 323-338.
Roman, M.R., 1978. Ingestion of the blue-green algae Trichodesmium by the harpacticoid copepod,
Macrosetella gracilis. Limnol. Oceanogr. 23, 1245-1255.
Saino, T., Hattori, A., 1980. Nitrogen fixation by Trichodesmium and its significance in nitrogen cycling in the Kuroshio area and adjacent waters. In: Takenouti, A.Y. (Ed), The Kuroshio. Saikon Publishing, Tokyo, pp. 697-709.
Sanudo-Wilhelmy, S. A., Kustka, A. B., Gobler, C. J., Hutchins, D. A., Yang, M., Lwiza, K., Burns, J., Capone, D. G., Raven, J. A., Carpenter, E. J., 2001. Phosphorus limitation of nitrogen fixation by Trichodesmium in the central Atlantic Ocean. Nature 411, 66-69.
Sarthou, G., Timmermans, K. R., Blain, S., Tréguer, P., 2005. Growth physiology and fate of diatoms in the ocean: a review. Journal of Sea Research 53, 25-42.
Satô, S., Paranagua, M.N., Eskinazi, E., 1963. On the mechanism of red tide of Trichodesmium in Recife, northeastern Brazil, with some considerations of the relation to the human disease “Tamandare fever”. Trab. Inst. Oceanogr. Univ. Recife 6/7, 7-49.
Sellner, K.G., 1997. Physiology, ecology and toxic properties of marinecyanobacteria blooms. Limnol. Oceanogr 42, 1089-1104.
Snedecor, G.W., Cochran, W.G., 1967. Statistical methods, 6th ed.. Iowa State Univ. Press.
Strickland, J., Parsons, T., 1972. A practical handbook of seawater analysis, Fish Res. Bd Can. Bul. 167.
Tenório, M. M. B., Le Borgne, R., Rodier, M., Neveux, J., 2005. The impact of terrigeneous inputs on the Bay of Ouinné (New Caledonia) phytoplankton communities : a spectrofuorometric and microscopic approach. Estuar. Coastal Shelf Sci. 64, 531-545.
Tenório, M. M. B., 2006. Les cyanobactéries pélagiques en milieu tropical oligotrophe: occurrence, distribution et dynamique. Univ. Paris VI Thesis, 1-359.
Trottet, A., 2003. Biodiversité des cyanobactéries filamenteuses du genre Trichodesmium dans l'océan Pacifique tropical sud-ouest. Mémoire DEA Univ. Paris VI, 1-26.
Tyrell, T., Maranon, E., Poulton, A. J., Bowie, A. R., Harbour, D. S., Woodward, E. M. S., 2003. Large-scale latitudinal distribution of Trichodesmium spp. in the Atlantic Ocean. J. Plankton Res., 25, 405-416.
Van Den Broeck, N., Moutin, T., Rodier, M., Le Bouteiller, A., 2004. Seasonal variations of phosphate availability in the SW Pacific Ocean near New Caledonia. Mar. Ecol. Prog. Ser. 268, 1-12.
Villareal, T. A., Carpenter, E. J., 2003. Buoyancy regulation and potential for vertical migration in the oceanic cyanobacterium Trichodesmium. Microb. Ecol., 45, 1-10.
Tables
Table 1
Main characteristics of the five Trichodesmium erythraeum blooms (* denotes presence of T.
thiebautii). Period Number of peaks Difference in time evolution at 6 and 0.5 m Total duration (d) Maximum at 0.5 m (trich. L-1) Maximum at 6-7 m (trich. L-1) 24 Nov - 14 Dec 2003 3 No 18 238.7 47.4 13 - 20 Dec 2004* 1 at 6m, 2 d before 7 244.6 20.7 3 - 14 Jan 2005 1 No 11 81.5 14.8 4 - 18 Feb 2005* No 14 10.1 19.4
Table 2
Exponential net increase rates (ki in d-1) and corresponding doubling times (d’A,i in d) in parentheses,
from changes in Trichodesmium population biovolume, at different depths (equations 1 and 2).
T. erythraeum T. erythraeum T. thiebautii
2003 10m 7m 4m 0.5m 2004-2005 6m 0.5m 6m 0.5m 24-30 Nov 0.36 (1.9) 0.43 (1.6) 0.36 (1.9) 13-12 Dec 0.39 (1.8) 3.29 (0.2) 1.51 (0.5) 2.20 (0.3) 3-9 Dec 0.24 (2.9) 0.68 (1.0) 0.61 (1.1) 0.72 (1.0) 3-14 Jan 0.98 (0.7) 1.13 (0.6) 11-14 Dec 0.15 (4.6) 0.40 (1.7) 4-18 Feb 0.19 (3.7) 0.52 (1.3) 0.23 (2.9) 0.94 (0.7) 29 Mar - 4 Apr 0.67 (1.0) 0.59 (1.2)
Table 3
Sizes of T. erythraeum and T. thiebautii during the 2003 and 2004-2005 surveys at Sta SM. Means ± standard deviations, and range (in parenthesis) of size parameters for n observations.
Width (µm) Length (µm) Volume (103 µm3) T. erythraeum 2003 0.5m - 10 m n= 2612 11.0 ± 0.6 (5.5 - 22.0) 477 ± 190 (56-1489) 45.3 ± 20.7 (5.3-426.1) 2004-2005 0.5m - 6 m n= 6362 10.5 ± 1.4 (5.5 - 22.0) 550 ± 344 (60 – 2675) 48.4± 34.8 (4.1 - 448.6) T. thiebautii 2003 0.5m – 10m n=8 11.3 ± 2.3 (8.2 - 16.5) 822 ± 499 (440 -2031) 67.1 ± 26.0 (25.6 - 96.9) 2004-2005 0.5m – 6m n = 1618 5.7 ± 1.0 (5.5 - 11.0) 847 ± 440 (57 – 3386) 22.0 ± 16.4 (1.3 - 186.4)
Table 4
Trichodesmium carbon, nitrogen and chlorophyll a content of the 2004-2005 survey: means,
standard deviations (sd) and ranges.
Per colony Per trichome Ratio
Chl a (ng) C (µg) N (µg) Chl a (ng) C (ng) N (ng) C/N (mol/mol) C/Chl a (g/g) Mean ± sd 7.84 ± 5.16 1.25 ± 0.29 0.20 ± 0.12 0.44 ± 0.26 103.1 ± 36.1 16.8 ± 5.7 6.2 ± 0.8 265.1 ± 161.5 Range 2.41 – 14.9 0.79 – 1.57 0.15 - 0.39 0.17 – 0.92 61.5 - 191.0 10.7 – 28.0 4.6 – 7.4 87.0 – 486.5
Table 5
Trichodesmium spp. densities (as trich. L-1) literature review (Note: references considering colony abundance are not presented. Specific difference between T. erythraeum (§) and T. thiebautii (*) are reported when available. m: mean value; max: maximum value.
Region Depth Density Author(s)
Sargasso and Caribbean seas
0 m (range) 15-200 m (range)
0-49* 0-294*
Carpenter and Price (1977)
Kuroshio (Japan) 0-100 m (max) 40 – 50000 Saino and Hattori (1980)
Great Barrier Reef lagoon bloom (max) 50,000 Revelante and Gilmartin (1982)
Cleveland Bay (Australia) inshore "blooms" (m) offshore "blooms" (m)
8515§ 3300§
Jones (1992)
HOT Station (Hawaii) 0-45 m (range) 11 – 84 Letelier and Karl (1996)
Southwest tropical Pacific 0 m - Fiji (max)
0 m New Caledonia ( max)
10,000 1000
Dupouy et al. (2000)
Tanzania coast 0 m "bloom" (range)
0 - 20 m (range)
38,000 - 120,000§ 0 - 63,000§
Lugomela et al. (2002)
Gulf of Aqaba 0-90 m (range) 0.05 - 2 Post et al. (2002)
South China Sea 0 m (m, range) 77 (0 - 962) Chen et al. (2003)
Magnetic island (Australia) surface (range)
15 m (m)
9 - 102,000 13,000
Muslim and Jones (2003)
North and South Atlantic 7 m (m)
(max) 300 2200 Tyrell et al. 2003 Dampier Archipelago (Australia) 0-20 m (m) 1800§ Negri et al. (2004)
North tropical Atlantic "surface" (m)
"surface", peak period (m)
222 – 292* 2250 (up to 10867)* Carpenter et al. (2004) Bay of Ouinné (New Caledonia) 0 - 45 m (m) 0.7 - 17§ ; 0.6 – 29* Tenório et al. (2005) Loyalty channel (New Caledonia) 0 - 60 m (range) 0 - 1011§ ; 4 – 2450* Tenorio (2006)
Bay of Sainte Marie (New Caledonia) 0.5 m (range) 6 m (range) 0 - 240§ ; 0 – 34* 0 - 47§ ; 0 – 18* Present study
Table 6
Literature review of Trichodesmium carbon-specific doubling times (d).
* inferred from their 0.23 division d-1 growth rate
Reference Conditions
Temperature (°C)
Doubling time (d)
Carpenter and Romans (1991) natural populations, tropical -subtropical Atlantic 26.5 - 28 1.8 - 18
Carpenter and Capone (1992) Review >27 3 - 6
Carpenter et al. (1993) natural populations T. erythraeum
T. thiebautii
26.5 - 28 3.8
3.0
Prufert-Bebout et al. (1993) Cultures 3.0*
Mulholland and Capone (2000) Cultures
natural populations
2.2 3.8 - 198
Orcutt et al. (2001) natural populations, Bermuda 2
Bell et al. (2005) Cultures 25 ± 3 2.3 – 3.5
Mulholland and Bernhardt (2005) continuous culture 28 3 - 10
Le Borgne et al. (2006) natural populations, bloom, Bay of Ste Marie,
idem, non-bloom conditions
27 - 29 27 - 29
4.1 - 5.8 13.9 - 40.8