HAL Id: hal-03043050
https://hal.archives-ouvertes.fr/hal-03043050
Submitted on 10 May 2021HAL is a multi-disciplinary open access
archive for the deposit and dissemination of sci-entific research documents, whether they are pub-lished or not. The documents may come from teaching and research institutions in France or abroad, or from public or private research centers.
L’archive ouverte pluridisciplinaire HAL, est destinée au dépôt et à la diffusion de documents scientifiques de niveau recherche, publiés ou non, émanant des établissements d’enseignement et de recherche français ou étrangers, des laboratoires publics ou privés.
Distributed under a Creative Commons Attribution| 4.0 International License
Response of phytoplankton to organic enrichment and
shrimp activity in tropical aquaculture ponds: a
mesocosm study
H. Lemonnier, S Hochard, K Nakagawa, C. Courties, Martine Rodier
To cite this version:
H. Lemonnier, S Hochard, K Nakagawa, C. Courties, Martine Rodier. Response of phytoplankton to organic enrichment and shrimp activity in tropical aquaculture ponds: a mesocosm study. Aquatic Microbial Ecology, Inter Research, 2017, 80 (2), pp.105-122. �10.3354/ame01841�. �hal-03043050�
1
Please note that this is an author-produced PDF of an article accepted for publication following peer review. The definitive publisher-authenticated version is available on the publisher Web site.
Aquatic Microbial Ecology
September 2017, Volume 80, Pages 105-122
http://dx.doi.org/10.3354/ame01841 http://archimer.ifremer.fr/doc/00392/50364/
© 2017 Inter-Research
Achimer
http://archimer.ifremer.frResponse of phytoplankton to organic enrichment and
shrimp activity in tropical aquaculture ponds: a mesocosm
study
Lemonnier Hugues 1, *, Hochard Sebastien 1, Nakagawa K 1, 2, Courties C 3, Rodier M 4
1
IFREMER LEAD, BP 2059, 98846, Nouméa Cedex, New Caledonia 2
LTMA, applied technology and technology transfer laboratory, Koné, New Caledonia 3
Sorbonne Universités, UPMC Univ. Paris 6, UMS 2348 Observatoire Océanologique, F- 66650, Banyuls/mer, France
4
IRD, Ecosystèmes Insulaires Océaniens (EIO) UMR 241 (Université de la Polynésie française - Institut de Recherche pour le Développement - Institut Malardé-Ifremer), Centre IRD de Tahiti, BP529, 98713 Papeete, French Polynesia
* Corresponding author : Hugues Lemonnier, email address : hugues.lemonnier@ifremer.fr
Abstract :
We conducted a mesocosm study to investigate the combined effect of organic enrichment and sediment resuspension by shrimp on phytoplankton communities in shrimp aquaculture ponds. Hence, the factorial design included two factors, i.e., (i) shrimp density with a concomitant increase of feed input resulting in organic enrichment and (ii) with/without access of shrimp to the sediments. Increasing feed input in the system raised the eutrophication state of the environment characterized by an increase in phytoplankton biomass. Bioturbation enhanced (i) mineralization of organic matter via the microbial loop, resulting in faster nutrient recycling, (ii) an increase of primary production, and (iii) buffering capacity against eutrophication consequences. The phytoplankton community showed both large temporal variations of its taxonomic composition and resilience to treatments. A shift in species dominance from Diatoms + Dinoflagellates to green algae was observed in all treatments and coincided with meteorological and N pool changes. Results suggested that algal production was primarily limited by phosphorus and light at low (i.e. low feeding) and high (i.e. high feeding) eutrophication states, respectively. Growth rate appeared as an important factor of dominance in this highly dynamic ecosystem. Consequences for water column management are discussed.
Keywords : Aquaculture, Litopenaeus stylirostris, Phytoplankton communities, eutrophication,
Introduction
Shallow marine environments are primarily defined to their high ratio of sediment surface area to water volume (McGlathery et al., 2007). These features add complexity on how the system responds to eutrophication particularly due to a strong benthic-pelagic coupling. In shallow eutrophic areas, organic matter loading can enhance sediment respiration and the release of nutrients into the overlying water column that sustain part of the primary producers growth and production (Cloern, 2001; Porter et al., 2010). Eutrophication may also promote the proliferation of certain species, some of whichmay often cause harm through the production of toxins (Heisler et al., 2008; O'Neil et al., 2012; Paerl and Otten, 2013), a phenomenon known as harmful algal blooms (HAB). Even if the different processes and effects of eutrophication are well known and documented (e.g. Cloern, 2001), the effects on phytoplankton community are not easily predictable (Schmoker et al., 2016), especially in shallow environment. In these areas, wind and storm events, tides, waves, wave-current and bioturbation are involved in the dispersal of sediment particles leading to an increase of the turbidity in the water column. Reduction of light availability may become a limiting factor for
primary production, with possible consequences on phytoplanktonic communities and productivity (Rochelle-Newall et al., 2011). There is also evidence that all these physical processes enhance nutrient flux from sediment into the water column (e.g. Haven, 1991)that may also affect phytoplankton biomass and composition (Havens, 1993; Porter et al., 2010).
Due to the complexity of the processes involved and to the uncontrollable variability end feedbacks, it is difficult to discriminate the factors influencing water eutrophication within natural shallow ecosystems from in situ measurements(Porter et al., 2010).
Outdoor shrimp aquaculture ponds are artificial marine systems that are shallow (< 2 m) and highly eutrophic associated with elevated nutrient inputs. These systems show low diversity, and simplified trophic chains, where phytoplankton plays a pivotal role in the flow of energy
and nutrients, due to their high abundance, efficient nutrient uptake and high productivity (Burford, 1997). Phytoplankton cell proliferation linked to increasing inputs of nutrients through feeding has been widely analysed (e.g. Casé et al., 2008). Temporal changes of dominant species due to dynamic variations of growth factors such as light, temperature, substrate supply (inorganic and organic nutrients), predation and virus infection have also been reported (e.g. Burford, 1997; Casé et al., 2008). According to the ecological theory of r/K selection, an unstable environment in pond containing high nutrient levels is particularly favorable to select for fast-growing organisms as opportunistic pathogens (De Schryver and Vadstein, 2014). This lack of stability linked to an imbalance in the N:P ratio may promote the development of toxic algal species stressful for shrimp, playing directly or indirectly a role in disease outbreaks in shrimp aquaculture ponds in New Caledonia (Lemonnier et al., 2006; Lemonnier et al., 2010; Lucas et al; 2010; Lemonnier et al., 2016).
However, while the role of phytoplankton in maintaining water quality in tropical shrimp ponds has been studied in the field by several authors (e.g. Burford, 1997), few studies have been conducted to distinguish the role of the different factors involved in the control of the phytoplankton community and dynamic. "Stocking density", defined as the number of animals per unit area, is one of the most important factors. Raising shrimp stocking density in ponds requires increased organic matter input for shrimp feeding. As a result, more waste – mainly faeces and unconsumed feed pellets – is produced, leading to an increase of the eutrophication level of the pond ecosystem (Martin et al., 1998; Bouwman et al., 2013). The nutrients, produced through organic matter degradation or excreted by shrimps, are rapidly assimilated by phytoplankton. This results in low concentrations of inorganic nutrients in the water column (Burford and Williams, 2001; Burford et al., 2003). Moreover, shrimp act as bioengineers in ponds and have large physical and biogeochemical impacts on sediment
through their bioturbation. Therefore, any modifications of shrimp stocking density will affect processes linked to the bioturbation (Ritvo et al., 1997; Ritvo et al., 2004; Joyni et al., 2011). Due to the complexity of physical and biological processes in the field, it is difficult to distinguish the effect of each forcing variable on phytoplankton community, function and dynamic. To overcome this difficulty, we set up highly controlled experiments in mesocosms. This paper reports the results of an experiment in which i) different densities of shrimp with their corresponding amounts of feed inputs and ii) access/no access to sediment were studied according a factorial approach to disentangle the effects organic matter input by feeding from the effects of shrimp activity on sediment by bioturbation. Because few studies address both changes to perturbation in composition and in functionality, making the generalization of patterns difficult (Nogales et al., 2011), phytoplankton communities were followed through flow cytometry (FCM) and spectrofluorometry, in close relationship with the biogeochemical functioning of the water column. The aim of this work is to improve our knowledge of phytoplankton ecology in outdoor pond aquaculture and, more generally, in eutrophicated ecosystems. By improving our knowledge in this field, this should facilitate the implementation of technical measures, to increase efficiency in recycling waste produced during rearing and limit the risk of growth of harmful species (Vibrio spp., harmful algae...).
2. Materials and methods
2.1. Experimental set-up
The mesocosm experiment was conducted over a 44-day period from 7 November to 21 December 2011 at the Saint-Vincent aquaculture research centre, located on the west coast of New Caledonia (South Western Pacific – 21°55’36 S, 166°05’04 E). Sixteen cylindrical polyethylene tanks, each with an effective volume of about 1600 l and a surface area of 1.72 m², were used in an outdoor area. The bottom of each mesocosm was filled with a 20 cm thick
layer of dry and natural sediment. The sediment was collected on salted and unvegetated intertidal zone between mangroves and agricultural land, which is where shrimp farms are generally located in New Caledonia. Sediment grain size was predominantly within the silty clay fraction and sediment organic content was below 2%. Each tank was filled with sea water (0.8 m depth) pumped from the nearby bay (called the "inaccessible" bay) and previously filtered through a 4 mmfilter.
We crossed different densities of shrimp (D) with access or no access to sediment (S+/S-) in a
2 x 2 factorial experiment run in triplicate. Enclosures preventing access to the sediment (S) were constructed with netting (mesh: 1.5 cm) and were positioned in tanks about 20 cm from the sediment. These enclosures prevented shrimp from accessing the sediment and thus from feeding on the benthic community and acting as bioturbators of the sediment. However, they did not alter sedimentation and water-sediment nutrient exchanges to occur. The tanks were stocked with Litopenaeus stylirostris juvenile shrimp, the species commonly reared in New Caledonia, at 4 shrimp m-2 (D4 for low density) or at 12 shrimp m-2 (D12 for high density).
The weight of each individual was 9.0 ± 1.5 g and the stocking density at the beginning of the experiment in D4 and D12 tanks was about 37 and 110 g m-2, respectively. D12 was designed
to mimic the density generally found in shrimp aquaculture ponds in New Caledonia. Throughout the experiment, shrimp were fed twice a day using feeding trays with commercial pellets with 35-40% protein content. The mean daily feed input was 1.3 g m-2 and 3.8 g m-2,
representing a total feed input over the 44-day experiment of 50 and 150 g m-2 for D4 and
D12, respectively.
Four combinations were thus tested in triplicate, allocated randomly to the 12 tanks: (1) high shrimp density + access to the sediment (D12S+), (2) high density – access (D12S-) (3) low
density + access (D4S+), (4) low density – access (D4S-). Four other tanks without shrimp
water was renewed daily in each tank by pumping water from the nearby bay (named the "inaccessible" bay), at 20% ± 3% of the total volume as generally applied in shrimp farms. The inner walls of the tanks were cleaned twice weekly to reduce the effect of periphyton biomass and production on the experimental system (Chen and Kemp, 2004). At the end of the experiment, all shrimp were harvested so as to calculate the survival rate, mean final weight, biomass produced in each tank.
2.2. Sampling and in situ measurements
Photosynthetically active radiation PAR (~ 400 - 700 nm) was measured 1 m above the mesocosms with a 1 s step and averaged each day using a COR quantum sensor and LI-COR Li1400 data logger. Daily rainfall data were measured at proximity of the experimental facilities (< 100 m) and obtained from the local weather forecast service (Météo-France, Nouméa). Water temperature was automatically and continuously monitored with a 1 h step randomly in five tanks using thermo buttons (Proges plus). In 8 tanks (two per treatment D12S+, D12S-, D4S+ and D4S-), an automatic system associated with an YSI 6600 probe
provided continuous and hourly measurement of different parameters in the water column (salinity, temperature, fluorescence and turbidity). Discrete measurements of salinity, dissolved oxygen (DO) and temperature were also made in each tank every morning (08:00) using a portable conductivity meter (WTW cond330i, Welheim, Germany) and an oxygen meter (WTW oxi330i, Welheim, Germany). Twice a week in the morning (08:00), tank water was sampled at 50 cm below the water surface using a 2-l HCl-rinsed black polyethylene bottle to monitor the phytoplankton communities and analyse various parameters including pH, fluorescence, turbidity, nutrients and organic matter. Due to the shallowness of the tanks, this single water sample was representative of the entire water body, as tested in a preliminary experiment (unpublished data).
2.3. Laboratory analyses
Immediately after water sampling, pH, fluorescence, and turbidity were measured in sub-samples using a pH meter WTW pH315i (Welheim, Germany) and an Aquafluor TM Handheld fluorometer (Turner Design, USA). Water samples were then filtered through the ~ 0.7 µm pore size GF/F Whatman filter and sub-sampled for the different analyses.
Chemical analyses. Ammonium (NH4+) and soluble reactive phosphorus (SRP) analyses were
carried out immediately on fresh water samples, while the other nutrients were measured on frozen samples. Ammonium was analysed following the Grasshoff and Johannsen, (1972)
method and SRP were measured in accordance with the molybdenum blue reaction described by Murphy and Riley (1962). Nitrate and nitrite [(NO2-+NO3-)-N] (NOx), were determined
using standard colorimetric techniques on a Bran + Luebbe AutoAnalyser III (Raimbault et al., 1990). Silicates were analysed only 5 times (d1, d11 d18, d25 and d39) during the experiment, as previously described by Mullin and Riley (1955). Dissolved organic nitrogen (DON) was analysed following oxidation procedure described by Raimbault et al. (1999). Pre-oxidation dissolved inorganic nitrogen (DIN) concentrations were subtracted from the post-oxidation total dissolved nitrogen (TDN) concentration to derive the DON concentrations.
Fluorometry. To analyse the Chlorophyll a (chl a) concentration in the water column, 25 to 50
ml water samples were filtered through Whatman GF/F filters and then stored frozen (-20°C) until they were analysed. Chlorophyll a and pheophytin a concentrations were determined in methanol extract before and after acidification using a fluorometer (Model TD700, Turner designs, Sunnyvale, CA, USA) using the method described by Herbland et al. (1985).
Flow cytometry. Water column subsamples (1.5 ml) were preserved with 1% Glutaraldehyde
(final concentration) and stored in liquid nitrogen pending flow cytometric analysis (Vaulot et al., 1989). Samples were defrosted at ambient temperature and subsequently analysed using a FACSCan flow cytometer (BD-Biosciences, San Jose, CA) equipped with an air-cooled argon laser (488 nm, 15 mW). Methodology and data analysis used in this study are fully described in Lemonnier et al. (2016). Based on cellular RALS and fluorescence properties, several populations were conventionally distinguished (e.g. Lucas et al., 2010): two distinct
Synechococcus populations and five eukaryotes groups. The two picocyanobacteria
populations (Syn) were pooled in a single group.
Spectrofluorimetry. Water samples (0.2 l) were filtered onto 47 mm GF/F filters and stored at
-80°C until analysis. Chlorophyll pigments were extracted in 95% acetone and analysed by spectrofluorometry with a Perkin Elmer LS55 spectrofluorometer following the method described in Neveux and Lantoine (1993), and using qualitative and quantitative improvements described in Ténorio et al. (2005) and Neveux et al. (2010). Determination of the different pigments was implemented from the 31×26 excitation-emission matrix (806 fluorescence data) by the PARAFAC method (Luciani et al., 2007) adapted for pigments by Chevalier (com. pers.). Concentrations (in µg l-1) for chl a, chl b, chl (c1+c2), chl c3,
divinyl-chla (dv-chl a) were estimated using external standards provided by DHI® Water and Environment (Denmark). Chlorophyll a was used as proxy for phytoplankton bulk, and the other chlorophylls provided information on the composition of phytoplankton communities (Roy et al., 2011).
2.4. Contribution of each taxa to Tchl a
The chl a associated with picocyanobacteria (chl apicoyano) was estimated using FCM counts
chromophytes and green algae (chl a(c+b)) was calculated by subtracting the chl apicocyano from
Tchl a. A strong correlation (r = 0.99, n = 132) was observed between chl a(c+b) and chl
(c1+c2) for samples containing less than 0.5 µg l-1 of chl b, leading to a mean chl (c1+c2)/chl
a(c+b) ratio of 0.183 (Fig. S1). Using this ratio and concentration of chl (c1+c2), the chl a
associated with chromophytes (chl a(c)) was estimated in all the samples. Chlorophyll a
associated with diatoms and dinoflagellates chl a(diat+dino) was calculated from chla(c) minus chl
a linked to cryptophytes and haptophytes. Since pelagophytes and chrysophytes have never or
rarely been described in environments such as shrimp ponds in New Caledonia (Lemonnier et al., 2016), these taxa were not taken into account in our calculations. The contribution of haptophytes (chl a(Hapto)) was calculated using a chl c3/chl a ratio of 0.161 recently found for
shrimp ponds (Lemonnier et al., 2016), while chl a associated with cryptophytes (chl a(Crypt))
was estimated using FCM counts and a chl a content of 1.35 pg cell-1 (Lafarga-De la Cruz et
al., 2006; da Silva et al., 2009). Finally, the chl a attributed to green algae chl a(chloro) was
equal to chl a(c+b) minus chl a(c), as calculated above.
2.5. Water column metabolism and Daily N budget
2.5.1. Metabolism
Oxygen fluxes in the water column were measured in light and dark incubation bottles. These bottles (300 ml) were made of borosilicate glass and had been soaked in dilute HCI (1% vol/vol) for several days before the measurements. The bottle were rinsed and filled with water taken from the tanks at 50 cm below the surface. Incubation was carried out in 8 tanks at mid-depth (two per treatment for D12S+, D12S-, D4S+ and D4S-). Oxygen sensor spot
method was used to follow oxygen as described in Warkentin et al. (2007). SP-PST3-PSUP-YOP-D5 oxygen sensor spots, also known as planar optodes (Presens GmbH, Regensburg, Germany), and a fibre-optic oxygen meter (Fibox 3: Presens GmbH) were used for this study.
Oxygen fluxes were assessed from the time course of oxygen between 9 a.m. and 1 p.m. with a 1 hour time step. Total Respiration (R) and Net Primary Production (NPP) rates were deduced from the DO variations in the dark and light bottles respectively (Bender et al., 1987). Gross primary production (GPP) represented the sum of the rate of R and NPP:
GPP (µmolO2 l-1 h-1) = R + NPP (Eq. 1)
2.5.2. Daily N budget
To calculate the total phytoplankton N demand, a stoichiometry of 6.6 between daily GPP and daily phytoplankton N demand was used following Stumm and Morgan (1996):
N demand (µmolN l-1 day-1) = (GPP × 12)/6.6 (Eq. 2)
We hypothesize that phytoplankton daily N demand was supported (1) by the N pool excreted by shrimp and (2) by the internal N pool produced through mineralization processes in the water column assuming that the nitrogen input by renewed water was negligible.
(1) Daily N input excreted by shrimp was derived from food, following Ebeling et al. (2006): Daily N input (µmol l-1 day-1) = ((daily feed input × PC × 0.144) /14)/V (Eq. 3)
where daily feed input is in µgN m-2 day-1, PC represents protein content in feed (45% in this
study) and V is the volume of the tank.
(2) Potential N mineralization (Nmin) was assessed using daily heterotrophic respiration (Rhet),
deduced from total respiration (R) and corrected from phytoplankton basal respiration. Phytoplankton basal respiration was fixed at 20% of daily GPP following Langdon (1993):
Rhet (µmol l-1 day-1) = R × 24 - 0.2 × (GPP × 12) (Eq. 4)
Heterotrophic respiration was used to obtain the potential N mineralization following a stoichiometry of 6.6 between O2 consumption and N mineralization (Chapelle et al., 2000):
Daily N budgets refer to the difference between the assimilation by phytoplankton and production by shrimp excretion and potential mineralization. A correction was applied to this budget to take into account of the daily water exchange (Eq 6).
Daily N budget (µmol l-1 day-1) = (Daily N input + Nmin – N demand) - 0.2 x [NH4+]
(Eq. 6).
2.6. Statistical analyses
Results are presented as means ± standard deviation (S.D.). Statistical comparisons of experimental data were carried out using XLStat software 2011 (Addinsoft, Paris, France), at each sampling date by a two-way analysis of variance (ANOVA), with shrimp density (D) (two or three fixed levels – function of the data set) and with or without access to the sediment (S) (2 fixed levels) as major sources of variance (Scherrer, 1984). Data were first checked for normal distribution and homogeneity of variance using the Shapiro-Wilk and Bartlett’s tests, respectively. If data were not normally distributed, they were transformed for normality using log-transformation, square root or arcsine transforms. If data did not meet the test criteria after appropriate transformations, comparisons were made using the non-parametric Kruskal-Wallis test. Differences were considered significant for p < 0.05. For analysis, data were grouped within 2 periods according to climatic conditions: day 8 to 18 (period A) and day 29 to 43 (period B); mean values for each response variable in each mesocosm were calculated over each period. Mean data were transformed for normality and submitted to a repeated-measures analysis of variance model where period was the two-level repeated-measures variable and the treatments density and access to sediment were the two main factors. This procedure was used to explore major trends in the phytoplankton compartment over the entire course of the experiment.
3. Results
3.1. Survival and growth of shrimp
Survival rates of shrimp at the end of the experiment ranged between 81 and 95% and were not significantly different between treatments (Table S1, two-way ANOVA test). Inversely, the final weight varied between treatments from 11.2 ± 0.2, 12.3 ± 1.1, 14.5 ± 0.4 and 16.1 ± 0.5 g in D12S-, D4S-, D12S+ and D4S+respectively. The growth was significantly higher in
thanks with low shrimp density (D4) and with access to sediment (S+).
3.2. Environmental conditions and physico-chemical parameters
The experiment was marked by two significant periods (Fig. 1). The first period (A) was a dry and cool period with mean water temperature around 27°C and mean daily incident PAR around 650 µmol m-2 s-1. The second period (B) was rainy and hot, with a decrease of
temperature at the end of the experiment. Rain fell almost continuously, with three peaks centred on days 29, 34 and 39. This period brought 161 mm of rain in two weeks, representing a mean dilution rate less than 2% of the water column per tank per day. Precipitation events were associated with mean daily PAR decreases down to 268 µmol m-2 s
-1
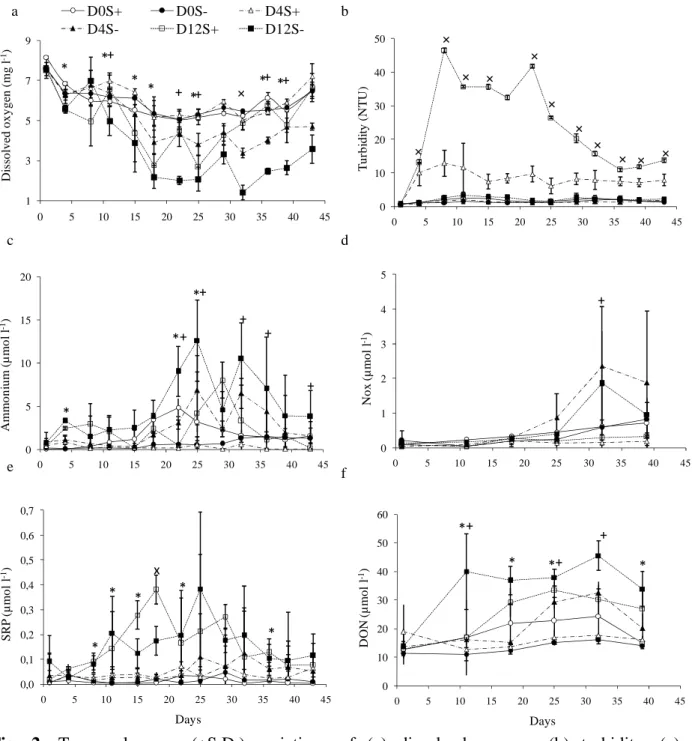
. The salinity in tanks increased from 34.5 to 36.5 during period A and decreased thereafter, with minimum level (33.0) reached at the end of the experiment. Mean data in DO are presented figure 2a. Minimum mean value was 1.4 mg l-1. The results from the daily two way
ANOVA show a significant effect of D (p < 0.05) from day 4 to the end of the experiment, with lower concentrations in treatments D12 (Fig. 2a). Significant changes in DO were also found in relation to S, but only from day 22 to the end of the experiment. S+ treatment showed
higher values of DO than S- treatment. pH (Fig. S2) varied from 7.8 to 8.5 with a decrease
from day 11 to day 22, followed by stabilization and then an increase during the last days. This trend was similar in all treatments, but the amplitude of variations changed with D and S,
especially from day 15 and from day 22 to the end of the experiment (not significant at days 36 and 39). At each sampling date (except at day 1), turbidity was significantly different (Kruskal-Wallis test; p < 0.05) between treatments. Mean values ranged from 6.2 to 12.9 NTU and from 10.9 to 46.5 for D4S+ and D12S+, respectively (Fig. 2b). Turbidity in the other
treatments did not exceed 3.4 NTU. Note that in the D12S+, turbidity increased quickly after
shrimp stocking, with a maximum (32 - 46 NTU) at day 8, and decreased during the rainy period (B) to a minimum (11 NTU) at day 36.
3.3. Nutrients (NH4+, NOx, SRP) and DON
Ammonium concentration in tanks ranged from 0.0 to 16.8 µmol l-1. The daily two-way
ANOVA show a significant effect of S on NH4+ from d22 to the end of the experiment
(except at d29 and d39), with lower concentrations in S+ than in S- treatments (Fig. 2c). The
effect of D was less evident and only occasionally significant, at days 4, 22 and 25. NOx concentrations remained very low (< 0.3 µmol l-1) except at the end of the experiment (days
32 and 39) in S- tanks (D4S- and D12S-), with concentrations up to 1 µmol l-1(Fig. 2d). Mean
SRP concentrations (Fig. 2e) were below 0.1 µmol l-1 except in treatments with high stocking
density (D12S+ and D12S-). These treatments showed values ranging from 0.02 to 0.38 µmol
l-1 with maxima observed in the second period.Results show a significant positive D effect on
SRP concentrations from day 8 to 22 and at day 36 (Fig. 2e). Conversely, access to the sediment (S) did not significantly change the SRP concentration in the water column. Silicate concentrations ranged from 0 to 35 µmol l-1. No significant effect of S and D on Si
concentrations was shown. The daily repeated-measure ANOVA show a significant effect of period for NH4+ and NOx but not for SRP (Table 1). The N/P ratio (mole/mole) increased
from around 20 to values higher than 50 in treatments without shrimp and without access to sediment (D0S+ , D0S-, D4S- and D12S-), especially during the second period B (Table 2). In
the other treatments, N/P values were generally < 50, averaging 24 ± 21 and 26 ± 15 in D4S+
and D12S+, respectively. The NH4+/NOx ratio ranged from 0.2 to 40 (Table 2). The daily
repeated-measure ANOVA show a significant effect of period for The NH4+/NOx ratio but
not for the N/P ratio (Table 1).
After shrimp introduction, DON concentrations increased whatever the treatment (Fig. 2d). Significant effect of D was shown on daily mean concentrations from day 11. Concentrations were lower in S+ than in S- treatments, but the difference was statistically significant only at
days 11, 25 and 32. Highest DON values were found in the treatment D12S- (> 35 µmol l-1).
3.4. Phytoplankton biomass
Total chl a exhibited the same patterns in all treatments containing shrimp, with an increase from day 4 to day 8 (Fig. 3). Moreover, it appeared that D and S both have a positive and significant impact on the Tchl a concentrations even though the impact of S was visible 14 days after that of D. Tchl a maxima were recorded in D12S+ treatment (> 15 µg l-1) and the
lowest values (~5 µ g l-1) in D4S-, when maximum values in D4S+ and D12S- were similar and
around 10 µg l-1. Comparatively, concentrations in control tanks (without shrimp) remained low (< 2 µg l-1) and close to the initial concentrations (0.63 ± 0.68 µmol l-1). Concentrations
were not significantly different between periods A and B whatever the treatment (Table 3). Phaeophytin a represented 20% to 57% of Tchl a. This ratio decreased during algae blooming at the beginning of the experiment (day 8 to day 15), and then increased toward the end. Increase of the ratio was higher in S- than in S+, but the effect of S was only significant at day
32 (not shown).
3.5. Phytoplankton abundance and diversity
Mean abundances ranged between 5.5 x 10² and 4.7 x 10⁶ cells ml-1 (Fig. 4a). S+ tanks
showed higher abundances than S- tanks from day 11. However, due to the high data
variability, differences were significant (p < 0.05) only at days 8, 39 and 43. Shrimp density effect on picocyanobacteria abundance was observable only for the last sampling date.
Among the eukaryotes, the smallest were assigned to picoeukaryotes (Peuk) and the largest to cryptophytes (Cry) (Courties et al., 2005; Lucas et al., 2010). To make the presentation of results easier, the three other eukaryote populations were pooled in a single group named nanophytoplankton (Nan). Mean abundances of Peuk ranged from 0 to 1.0 x 10⁶ cells ml-1.
They increased from day 11 in S+ tanks (Fig. 4b) as did picocyanobacteria, but due to the high
data variability, the effect of S was not statistically demonstrated. Likewise, no D effect was observed. Nanophytoplankton was amongst the less abundant groups, with abundances ranging between 0.3 x 10³ to 3.0 x 10⁵ cells ml-1 (Fig. 4c). Maximum abundance was recorded
in the treatment D12S+. S did not show any significant effect except at day 22 with a positive
effect. Abundances were significant with D at days 11, 22 and 39. Cryptophytes occurred in 85% of the samples, but their abundances (data not shown) were always lower than 70 x 103
cells ml-1. Factor D showed a significant positive effect at days 4, 15 and factor S a negative
and positive effect at days 18 and 39, respectively.
3.5.2. Pigment-based phytoplankton composition
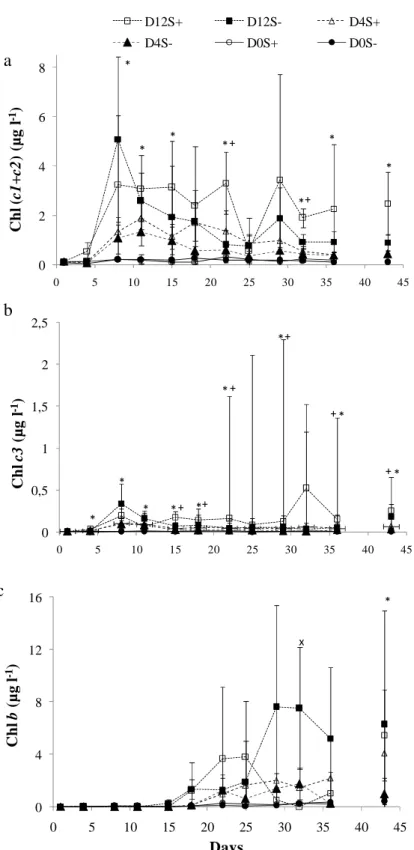
Chlorophyll (c1+c2) quickly appeared in the water column just after shrimp stocking, with
concentrations ranging from 0.07 to 5.08 µg l-1 (Fig. 5a). They were the main accessory
pigments in all the treatments during the first period of the experiment (period A). However, the steady decrease of the chl (c1+c2)/Tchl a ratio from 0.2 to 0.1 (data not shown) showed
that the amount of these red-brown algae fell throughout the experiment, to the benefit of green algae and picocyanobacteria, whatever the treatment. Density factor regularly showed a
significant positive effect on chl (c1+c2) concentrations. Values were generally higher in S+
than in S- cases (Fig. 5a), and a significant positive effect was observed at days 22 and 32.
Note that silicates disappeared in relation with the increase of chl (c1+c2) concentrations (Fig.
6), suggesting a high presence of diatoms in this group.
Chlorophyll c3, which is present in Prymnesiophytes, Chrysophytes and Pelagophytes in
addition to chl (c1+c2), ranged from 0.00 to 0.52 µg l-1 (Fig. 5b). The daily two-way ANOVA
regularly showed a positive and significant effect of D. Concentrations were generally and significantly higher in S+ than in S- tanks. The chl c3/Tchl a ratio was generally low whatever
the treatments (< 0.5). This ratio dropped throughout the experiment, indicating a progressive decrease of the proportion of these taxa within the phytoplankton community. No significant effect of S or D on this ratio (except at day 43) could be detected during the experiment. Chlorophyll b can be used as a biomarker of green eukaryotes (Prasinophytes, Chlorophytes, Euglenophytes). Its concentration increased from day 15 and reached 8 µg l-1 at day 29 in
D12S- (Fig 5c). It was significantly and positively affected by stocking density during the
second part of the experiment. There was no significant effect of S. The chl b/Tchl a ratio increased from 0.0 to around 0.4 during the course of the experiment (data not shown), suggesting an increase of the proportion of green algae in the phytoplanktonic community.
3.5.3. Contribution of each taxa to Tchl a
Based on these estimates, Figure 7 shows the temporal variability of each group in terms of chl a in the different tanks. The chl a linked to Cryptophytes was less than 1.2% of Tchl a, with 96% of the values < 0.5%. Its contribution increased significantly between periods A and B (Table 3). Haptophytes were also a minor component of the phytoplankton biomass, representing less than 15% of Tchl a, but they were always detected in the samples. The contribution of picocyanobacteria to Tchl a ranged from 0 to 31%. With treatments D4S- and
D12S-, values never exceeded 6%. The daily repeated-measure ANOVA show a significant
effect of period, D and S of the contribution of picocyanobacteria on Tchl a (Table 3). Proportions of chl a associated to the (diatoms + dinoflagellates) group (chl a(diat+dino))
decreased significantly between periods A and B whatever the treatment (Table 3), from 80% of Tchl a at the beginning to 18% and 52% at the end. Green algae became the predominant contributor to Tchl a in the second part of the experiment in all tanks (Table 3) and represented between 40 and 65% of Tchl a. The shift from diatoms + dinoflagellates to green algae coincided with the occurrence of the rainy period (Fig. 1a). When generating the chl b versus chl achloro scatter plot diagram, three distinct and strong correlations were observed
(Fig. S3), leading to a mean chl b/chl achloro ratio of 0.61 (assemblage 1), 0.86 (assemblage 2)
and 0.38 (assemblage 3). The three linear regressions were significantly different (ANCOVA; F = 261; ddl = 3; p < 0.0001). Table 4 shows the distribution of these assemblages according to the treatment. Assemblage 1 was observed in all the treatments, assemblage 2 in the treatments with shrimp and without S, and assemblage 3 mainly in the treatments with shrimp and with S, suggesting an effect of D and S on the composition of the green algae community.
3.6. Metabolism and N budget
Daily mean gross primary production (GPP) ranged from 5.1 ± 3.3 (D4S-) to 21.2 ± 9.6 µmol
l-1 h-1 (D12S+) (Table 5). The daily two-way ANOVA show a significant positive effect of D
on GPP at the end of the experiment and of S at days 22, 25 and 43 (data not shown). Daily mean respiration rates ranged from 1.5 ± 1.2 to 5.7 ± 1.9 µmol l-1 h-1 for D4S- and D12S+,
respectively. Significant positive effects of D and S were also regularly shown on respiration from day 15 to the end of the experiment (data not shown).
For the D4S- treatment, phytoplankton N demand was more or less equal to the nutrient input
phytoplankton increased from around 10 to 25 µ mol l-1 day-1. The N budget decreased from
0.6 ± 5.0 µmol l-1 day-1 in D4S- to -14.7 ± 7.2 µmol l-1 day-1 in D4S+, indicating a higher
capacity of the bioturbated system to recycle mineral N. Results showed also that increasing densities implied an increase of potential N remineralization.
4. Discussion
4.1. Effects of stocking densities and bioturbation on phytoplankton biomass
Both stocking densities and bioturbation increased the phytoplankton biomass and microbial metabolism in our experiment. This result reveals the importance of these two factors in sustaining phytoplankton primary production in shrimp farm ponds with a soft bottom of sediment. Nevertheless, the pathways involved for each were not similar. Stocking density determined the amount of nutrients entering into the system, directly enlarging the nutrient pool available for primary production as already reported by several authors (e.g. Martin et al., 1998). This resulted in an increase in autotrophic plankton biomass in the D12S
-treatment, reaching values 2.8-fold greater than in low shrimp density tanks (D4S-) and
9.1-fold higher than in the tank without shrimp (D0S-). Likewise, bioturbation by shrimp
increased phytoplankton biomass with values 2.3-fold greater in S+ than in S- tanks, as well as
productivity for the same amount of nutrient entering into the system. Thus, the maximum biomass was recorded in D12S+ treatments with Tchla concentrations averaging 30 µ g l-1, a
situation that is close to the biomass generally measured in earthen semi-intensive shrimp ponds in New Caledonia (Thomas et al., 2010; Pusceddu et al., 2011). The increase of water column respiration rates and the decrease of DON in S+ treatment compared to S- suggest an
increase of the organic matter mineralization rate in the water column as a consequence of sediment resuspension by bioturbation. This outcome could be explained by an intensification of bacterial production (BP) in the water column due to the increase of heterotrophic bacteria
attached to sediment particles (e.g. Arfi and Bouvy, 1995). In shrimp ponds in New Caledonia, BP associated with particles (> 3 µm) accounts for more than 80% of the total BP in the water column (unpublished data). The increase of mineralization rate theoretically implies more nutrients available for primary producers which may partly explain the significant and positive effect of bioturbation on primary production and phytoplankton biomasses. Resuspension of sediment was already reported to increase the mineralization rate by a factor between 2 and 5 in coastal sediments (Stahlberg et al., 2006). Thus, bioturbation appeared to be a key process for internal nutrient recycling in shrimp ponds. Another factor should be taken into account to explain the increase of Tchl a in the water column in treatments with S: the effect of bioturbation on the microphythobenthos (MPB) resuspension. During this experiment, concentrations of Tchl a in the first cm of the sediment ranged between 86 and 151 mg m-2 for D12S+ and did not show any significant change with time
(data not shown). These biomasses represented more than 80% of the primary producer biomass (phytoplankton and MPB) in the system. It is therefore assumed that MPB resuspension by shrimp could have a significant impact on Tchl a measurements, as also suggested for shallow systems (Brito et al., 2012; Garstecki et al., 2002). The increase of turbidity in D12S+ tanks between day 1 (before shrimp stocking) and day 4 (2 days after
stocking) due to the resuspension of sediment by shrimp coincided with a small increase of phytoplankton biomass from 0.4 to 0.9 µg l-1. This preliminary result suggests a relatively
limited effect of MPB on water column Tchl a enrichment. However, further studies in shrimp pond ecosystems are needed to clarify this point.
4.2. Limiting factors for phytoplankton growth
Several limiting factors should be taken into account to understand phytoplankton dynamics in the different treatments. In the case of high density (D12) with and without S, the high
turbidity due to bioturbation and/or high phytoplankton cell abundances led to a limited increase of GPP compared to biomass. This finding suggests that in this condition, photo-limitation including self shading by phytoplankton could limit upper levels of GPP
(Giovannini and Piedrahita, 1994). In a previous experiment conducted in the same tanks and similar zootechnical conditions, we showed a significant increase in photo-limitation of around 50% between surface and bottom. Because of this light limitation, it is likely that nutrient products from organic matter mineralization (SRP, NH4+, NOx) were accumulated in
the water column, as they are not efficiently utilized by phytoplankton. This situation mainly occurred in the second part of the experiment, when PAR values decreased due to cloudy/rainy conditions. In treatment D12S+, the negative effect of bioturbation on
productivity of the system due to light limitation is probably mitigated by an increase of turbulent mixing. This process might favour the vertical displacement of phytoplankton to the surface and therefore it nutrient uptake capacity (MacIntyre, 1993). This possibility could explain why NH4+ accumulation was significantly lower in D12S+ than in D12S-, except
during bad weather conditions (day 29) when the light was too weak for primary productivity. Another limiting factor identified during this experiment was phosphorus. In D4S- and D0
treatment cases, the N:P atomic ratio was far above the Redfield ratio of 16:1, which is required for optimal phytoplankton growth. Phosphorus depletion could limit GPP in the water column in these treatments assuming that nutrients were not in excess in the water column (Table 2). In D4S+, the N:P ratio was generally close to the Redfield ratio, suggesting
that phytoplankton growth may not be theoretically limited by either P or N.
To conclude, light which depends on weather, turbidity, cell abundance, depth and vertical mixing should be taking into account to understand phytoplankton dynamics in the shrimp pond ecosystem. A second factor is nutrient availability linked to feed input, which depends on the N/P ratio and the organic matter mineralization rate. With an increase of shrimp
biomass and/or density, P becomes less limiting, while light becomes more and more limiting, implying a trend towards nutrient (NH4+ and NOx) accumulation in the water column.
4.3. Phytoplankton community dynamic and structure
Shrimp stocking with the corresponding daily feed input triggered the onset of a phytoplankton bloom after 2 days. Growth dynamics of phytoplankton were typical, with an exponential increase, a short peak after 7 days followed by a decline of biomass (day 13) until the start of a new bloom. Apart from the change in the biomass, a shift in the phytoplankton assemblage was significant in all treatments. During period A, the increase of chl (c1+c2) in all tanks suggest that the group (diatoms + dinoflagellates) was dominant whatever the treatment. Note that the abundance of this group was positively correlated to the increase of shrimp stocking density, suggesting that diatoms and dinoflagellates were strongly favoured by eutrophication. The spectrofluorometry data failed to discriminate dinoflagellates from diatoms. In shrimp ponds, diatoms are often reported as a major component of phytoplankton biomass even though several studies, based on microscopic observations, suggest that dinoflagellates could become episodically dominant (Casé et al., 2008; Burford, 1997; Yusoff et al., 2002). In this environment characterized by high organic matter content, dinoflagellates are mostly heterotrophic (Garcés et al., 2006;Zapata et al., 2012). The organic matter content and the depletion of SRP in the water column in treatments characterized by high N/P ratio (Table 2) could be the factors promoting the dinoflagellates against diatoms during this first period (Yamamoto, 2003; Collos et al., 2009). Further confirmation with microscopic observations and/or molecular approaches are needed to understand the adaptive response of diatoms and dinoflagellates to eutrophication and to conclude on the dinoflagellates trophic regime in pond ecosystem.
During period B, the proportion of chl (c1+c2) decreased steadily and green algae (chlorophytes and prasinophytes) became dominant. Proliferation of tiny prasinophyceae belonging to the picoplankton and small nanophytoplankton was already observed in shrimp ponds in New Caledonia (Lemonnier et al., 2016) where they accounted for 10 to 53% of Tchl
a in the present study.Shift from diatoms to chlorophytes in coastal environment, which have been particularly subjected to eutrophication processes, are often described as the consequence of nitrogen pool change (e.g. Donald et al., 2011; Collos and Harrison, 2014; Glibert et al., 2016). The effects of change in the proportion of NH4+ and NOx on
assemblages were recently well illustrated and commented by Glibert et al. (2016). When NH4+ is the dominant form (reduced form), flagellates, cyanobacteria and chlorophytes may
proliferate while diatoms more likely dominate under NO3 enrichment conditions.
Chlorophytes are not only physiologically better adapted to use NH4+ but also more tolerant to
toxic values than diatoms. In the present study, a significant effect of period on the NH4+/NOx
ratio was shown in the different treatments suggesting that N pool change could lead to a the shift from diatoms to chlorophytes. Several authors reported that diatom populations generally decrease in ponds due to silica depletion in the environment (Yusoff et al., 2002; Casé et al., 2008). However, this depletion was not observed in treatments without shrimp (D0S+ and
D0S-), whereas the community shift did occur.
Beside the nutrient changes, T° and light changes between period A and period B due to adverse weather conditions could also be implied in the shift from diatoms to chlorophytes observed in tanks. With an increase of 4°C, temperature could enhance the effect of nutrients on phytoplankton community composition as reported in literature (e.g. Deng et al., 2014).
The temperature increase could also increase the regenerated production and therefore modify the N pool, the production of NH4+ favoring indirectly the observed shift. Beside the
case, the change in phytoplankton populations appeared during the rainy period characterized by low radiation as also reported by Leruste et al. (2016) in hypertrophic shallow lagoons. The availability and quality of light are known to drive fluctuation in phytoplankton species
(Huisman et al., 1999). Diatom abundance was increased by light fluctuations while cyanobacteria and green algae dominated at low and high constant conditions (Litchman, 1998). However, the community shift was similar in all treatments characterized by different turbidity levels.
Concerning the green algae community blooming mainly during period B, three assemblages were distinguished according to their chl b/chl achlorophytes ratios. Interestingly, the chl b/chl
achlorophytes ratios calculated for each assemblage (0.86; 0.61; 0.38) from spectrofluorometry
data were close to those measured in a shrimp pond from HPLC data using CHEMTAX software, i.e. 0.81, 0.65, and 0.35 (Lemonnier et al., 2016). According to the authors, the ratio 0.81 was associated with Prasinophytes type 3 (with prasinoxanthin) and the ratio 0.65 with Prasinophytes type 1-2 (without prasinoxanthin) (Latasa et al., 2004). The ratio 0.35 identified as Chlorophytes by HPLC was slightly lower than the value found in our study (0.38). Because Chlorophytes (assemblage 3) were more frequently observed in S+ tanks than
Prasinophytes (assemblages 1 and 2), we consider that this assemblage could be more efficient in an environment characterized by high nutrient recycling rate and high ammonium concentrations.
From d11 to the end of the experiment, the phytoplankton assemblage underwent another modification, with a major growth of picocyanobacteria in S+ treatments. These treatments
were characterized by an increase in nutrient recycling by the microbial loop, enriched with NH4+ and urea from shrimp excretion and protein-rich feed given to cultured species (Burford
and Williams, 2001). This finding was reported in various environments and by large scale manipulation experiments (e.g. Donald et al., 2011). In their review on this topic, Glibert et al
(2016) reported that picocyanobacteria as well as chlorophytes (see above) may be physiologically better adapted to use reduced form of N, mainly NH4+, than diatoms even if
diatoms have a high nitrogen affinity, especially small-size species (Litchman et al., 2009). Indeed, these fast-growing prokaryotic algae as other small cells are known to be more efficient than larger cells in nutrient uptake (Agawin et al., 2004; Furnas et al., 2005). Because of their high surface to volume ratios, picocyanobacteria are able to use resources more efficiently than larger cells (Raven, 1998). The rising temperature from period A to period B could enhance the effect of ammonium on cyanobacterial biomass and dominance in the second period (O'Neil et al., 2012). As suggested by results from the S+ treatments (Table
2), a low N:P molar ratio may also be a major factor favoring cyanobacteria dominance in aquaculture ponds (Paerl and Tucker, 1995). Several authors reported that abiotic factors, as salinity or turbidity, explained part of the variability in the diversity of marine Synechococcus populations in coastal waters (Jing et al., 2009; Liu et al., 2014). The next step should aim at investigating picocyanobacterial and more generally other taxonomic groups diversity in shrimp ponds, in order to better understand how shrimp pond environmental (nutrients, temperature and/or light) conditions might affect species-specific differences of this group. To conclude on the phytoplankton community dynamic and structure, the differences between treatments remained limited whatever the period. This finding suggests high resilience of the phytoplankton community to feed input and bioturbation, and consequently to nutrient enrichment, N:P ratio and turbidity in the shrimp pond ecosystem. Even if N pool was probably the main factor, data do not allow us to definitely conclude whether the shift from diatoms to chlorophytes observed in all treatments resulted either from the modification of N pool or from an external common factor (T°, light). Further specific experiments are needed to define precisely the effect of each factor.
4.4. Importance of phytoplankton in maintaining the pond water quality
DON is a major (30 - 40%) component of the N waste produced during rearing and most of it is leached from the feed given to the reared shrimp (Burford and Williams 2001). In this experiment, the accumulation of DON in the water column with the highest feed inputs (D12S-) comparatively to lowest feed inputs (D4S-) suggested that DON production is higher
than the recycling capacity of the system. Consequently, the dissolved vs particulate ratio increased in the water column with the increase of feed input. This organic matter enrichment directly impacted the stability of the system, in terms of daily pH and DO fluctuations. Indeed, the pH decrease observed in the water column in relation to feed input was likely linked to the increase in CO2 production through bacterial metabolism. This result suggests a
substantial reduction in the acid–base buffering capacity of the system with increasing shrimp density and feed inputs. Conversely, supplied organic matter in the water column also stimulated respiration, which in turn caused depleted O2 in the morning. Based on the N daily
budget calculations in the different tanks, it may also be shown that increasing stocking densities entailed an increase of phytoplankton N demand coupled with an increase of both of potential N mineralization and shrimp N excretion (Table 4). As a result, the turnover of N increased. As seen above, bioturbation by shrimps may favour organic matter mineralization by heterotrophic bacteria and then rapid nutrient uptake by phytoplankton, which limits the increase in the dissolved/particulate ratio. Because it improved the recycling of organic matter in the system by the microbial loop, bioturbation mitigated the accumulation of products (ammonia and nitrites) and the drop of DO and pH which are stressful parameters for shrimp (e.g. Lemonnier et al., 2004; Mugnier et al., 2008). The buffering capacity of the system to recycle N waste is however constrained by a threshold for the turnover of N. Indeed, as presented in Fig. 8, NH4+ accumulated in the water column when the N turnover rate
below this value. By limiting the primary production and consequently the uptake of NH4+,
light is assumed to be the main factor limiting this recycling rate (see § 4.2). To conclude on the importance of phytoplankton in maintaining the pond water quality, this compartment counterbalances "negative" effects of organic matter mineralization. However, this mitigation effect is governed by light availability in the system.
4.5. Consequences for water column management
The better understanding of the relative importance of food input and shrimp bioturbation in the phytoplankton dynamic could be useful for shrimp pond management. At low biomass, in our experiment, the system had strong resilience thanks to efficient nutrient recycling and to the robustness of primary production to the climatic condition changes linked to moderate turbidity. At higher density, the system became more unstable due to the greater sensitivity of primary production to light availability. By using fertilizers in shrimp ponds, we can reasonably hypothesize that increasing phytoplankton biomass would thus be inefficient in stabilizing the system and even might lead to a more unstable conditions. In that case, stability of the water column might be more efficient through carbon input, in order to stabilize the nutrient pool through heterotrophic assimilation and thus buffer system oscillations (Hari et al., 2004). This result partly explain the success of the Biofloc system sometimes used to stabilize the water column at high stocking density (Crab et al., 2012; Martínez-Córdova et al. (2015).
5. Acknowledgements
This work was supported by a research grant between the Loyalty Islands, Northern Province, Southern Province Government of New Caledonia and Institut Français de Recherche et d'Exploitation de la Mer (IFREMER) (12/1219969/C). The authors thank the anonymous
reviewers for their useful comments and suggestions to improve the manuscript. We would like to thank Aline Personne who kindly helped in the analysis.
6. References
Agawin, N.S.R, Duarte, C.M., Agustí, S., Vaqué, D., 2004. Effect of N:P ratios on response of Mediterranean picophytoplankton to experimental nutrient inputs. Aquatic Microbial Ecology 34 57-67.
Arfi, R., Bouvy, M., 1995. Size, composition and distribution of particles related to wind induced resuspension in a shallow tropical lagoon. Journal of Plankton Research 17, 557-574.
Bender, M., Grande, K., Johnson, K., Marra, J., Williams, P.J.L., Sieburth, J., Pilson, M., Langdon, C., Hitchcock, G., Orchardo, J., Carleton, H., Donaghay, P., Heinemann, K., 1987. A Comparison of Four Methods for Determining Planktonic Community Production. Limnology and Oceanography 32, 1085-1098.
Bouwman, A.F., Beusen, A.H.W., Overbeek, C.C., Bureau, D.P., Pawlowski, M., Glibert, P.M., 2013. Hindcasts and Future Projections of Global Inland and Coastal Nitrogen and Phosphorus Loads Due to Finfish Aquaculture. Reviews in Fisheries Science 21, 112-156. Brito, A.C., Fernandes, T.F., Newton, A., Facca, C., Tett, P., 2012. Does microphytobenthos
resuspension influence phytoplankton in shallow systems? A comparison through a Fourier series analysis. Estuarine, Coastal and Shelf Science 110, 77-84.
Burford, M., 1997. Phytoplankton dynamics in shrimp ponds. Aquaculture Research 28, 351-360.
Burford, M.A., Williams, K.C., 2001. The fate of nitrogenous waste from shrimp feeding. Aquaculture 198, 79-93.
Burford, M.A., Costanzo, S.D., Dennison, W.C., Jackson, C.J., Jones, A.B., McKinnon, A.D., Preston, N.P., Trott, L.A., 2003. A synthesis of dominant ecological processes in intensive shrimp ponds and adjacent coastal environments in NE Australia. Marine Pollution Bulletin 46, 1456–1469.
Casé, M., Leca, E.E., Leita, S.N., Sant'Anna, E.E., Schwamborn, R., Travassos de Moraes Junior, A., 2008. Plankton community as an indicator of water quality in tropical shrimp culture ponds. Marine Pollution Bulletin 56, 1343-1352.
Chapelle, A., Ménesguen, A., Deslous-Paoli, J-M., Souchu, P., Mazouni, N., Vaquer, A., Millet, B., 2000. Modeling nitrogen, primary production and oxygen in a Mediterranean lagoon. Impact of oysters farming and inputs from the watershed. Ecological Modelling, 127, 161-181.
Chen, C-C., Kemp, W.M., 2004. Periphyton communities in experimental marine ecosystems: scaling the effects of removal from container walls. Marine Ecology Progress Series 271, 27-41.
Cloern, J.E., 2001. Our evolving conceptual model of the coastal eutrophication problem. Marine Ecology Progress Series 210, 223-253.
Collos, Y., Bec, B., Jauzein, C., Abadie, E., Laugier, T., Lautier, J., Pastoureaud, A., Souchu, P., Vaquer, A., 2009. Oligotrophication and emergence of picocyanobacteria and a toxic dinoflagellate in Thau lagoon, southern France. Journal of sea research, 61, 68-75.
Collos, Y., Harrison, P.J., 2014. Acclimation and toxicity of high ammonium concentrations to unicellular algae. Marine Pollution Bulletin, 80, 8-23.
Courties, C., Lemonnier, H., Herbland, A., 2005. Structure et évolution des peuplements picoplanctoniques de bassins aquacoles mesurés en cytométrie en flux lors des deux syndromes en Nouvelle Calédonie. In: Book of Abstract of "Ecosystèmes et crevetticulture en Nouvelle-Calédonie" (22 - 24 juin 2005) (ed IFREMER), Nouméa.
Crab, R., Defoirdt, T., Bossier, P., Verstraete, W., 2012. Biofloc technology in aquaculture: Beneficial effects and future challenges. Aquaculture, 356-357, 351-356.
da Silva, A.F., Lourenço, S.O., Chaloub, R.M., 2009. Effects of nitrogen starvation on the photosynthetic physiology of a tropical marine microalga Rhodomonas sp. (Cryptophyceae). Aquatic Botany, 91, 291-297.
De Schryver, P., Vadstein, O. 2014. Ecological theory as a foundation to control pathogenic invasion in aquaculture. International Society for Microbial Ecology Journal, 8, 2360-2368.
Deng, J., Qin, B., Paerl, H.W., Zhang, Y., Wu, P., Ma, J., Chen, Y., 2014. Effects of Nutrients, Temperature and Their Interactions on Spring Phytoplankton Community Succession in Lake Taihu, China. PLoS One, 9(12), e113960.
Donald, D.B., Bogard, M.J., Finlay, K., Leavitt, P.R., 2011. Comparative effects of urea, ammonium, and nitrate on phytoplankton abundance, community composition, and toxicity in hypereutrophic freshwaters. Limnology and Oceanography, 56, 2161-2175.
Ebeling, J.M., Timmons, M.B., Bisogni, J.J., 2006. Engineering analysis of the stoichiometry of photoautotrophic, autotrophic, and heterotrophic removal of ammonia-nitrogen in aquaculture systems. Aquaculture, 257, 346-358.
Furnas, M., Mitchell, A., Skuza, M., Brodie, J., 2005. In the other 90%: phytoplankton responses to enhanced nutrient availability in the Great Barrier Reef Lagoon. Marine Pollution Bulletin 51, 253-265.
Garcés, E., Fernandez, M., Penna, A., Van Lenning, K., Gutierrez, A., Camp, J., Zapata, M., 2006. Characterization of NW Mediterranean Karlodinium spp. (Dinophyceae) strains using morphological, molecular, chemical, and physiological methodologies. Journal of Phycology 42, 1096-1112.
Garstecki, T., Wickham, S.A., Arndt, H., 2002. Effects of Experimental Sediment Resuspension on a Coastal Planktonic Microbial Food Web. Estuarine, Coastal and Shelf Science 55, 751-762.
Giovannini, P., Piedrahita, R.H., 1994. Modeling photosynthetic production optimization for aquaculture ponds. Aquacultural Engineering, 13, 83-100.
Glibert, P.M., Wilkerson, F.P., Dugdale, R.C., Raven, J.A., Dupont, C.L., Leavitt, P.R., Parker, A.E., Burkholder, J.M., Kana, T.M., 2016. Pluses and minuses of ammonium and nitrate uptake and assimilation by phytoplankton and implications for productivity and community composition, with emphasis on nitrogen-enriched conditions. Limnology and Oceanography, 61, 165-197.
Grasshoff, K., Johannsen, H., 1972. A New Sensitive and Direct Method for the Automatic Determination of Ammonia in Sea Water. ICES Journal of Marine Science 34, 516-521. Hari, B., Madhusoodana Kurup, B., Varghese, J.T., Schrama, J.W., Verdegem, M.C.J., 2004.
Effects of carbohydrate addition on production in extensive shrimp culture systems. Aquaculture, 241, 179-194.
Havens, K.E., 1991. Fish-induced sediment resuspension: effects on phytoplankton biomass and community structure in a shallow hypereutrophic lake. Journal of Plankton Research, 13 1163-1176.
Havens, K.E., 1993. Responses to experimental fish manipulations in a shallow, hypereutrophic lake: the relative importance of benthic nutrient recycling and trophic cascade. Hydrobiologia 254, 73-80.
Heisler, J., Glibert, P.M., Burkholder, J.M., Anderson, D.M., Cochlan, W., Dennison, W.C., Dortch, Q., Gobler, C.J., Heil, C.A., Humphries, E., Lewitus, A., Magnien, R., Marshallm. H.G., Sellner, K., Stockwell, D.A., Stoecker, D.K., Suddleson, M., 2008. Eutrophication and harmful algal blooms: A scientific consensus. Harmful Algae 8, 3-13.
Herbland, A., Le Bouteiller, A., Raimbault, P., 1985. Size structure of phytoplankton biomass in the equatorial Atlantic Ocean. Deep Sea Research Part A. Oceanographic Research Papers 32, 819-836.
Huisman, J., Jonker, R.R., Zonneveld, C., Weissing, F.J., 1999. Competition for light between phytoplankton species: experimental tests of mechanistic theory. Ecology 80, 211-222. Jing, H., Zhang, R., Pointing, S.B.P.B., Liu, H., Qian, P., 2009. Genetic diversity and
temporal variation of the marine Synechococcus community in the subtropical coastal waters of Hong Kong. Canadian Journal of Microbiology 55, 311-318.
Joyni, M.J., Kurup, B.M., Avnimelech, Y., 2011. Bioturbation as a possible means for increasing production and improving pond soil characteristics in shrimp-fish brackish water ponds. Aquaculture 318, 464-470.
Lafarga-De la Cruz, F., Valenzuela-Espinoza, E., Millán-Núñez, R., Trees, C.C., Eduardo Santamaría-del-Ángela, E., Núñez-Cebrero, F., 2006. Nutrient uptake, chlorophyll a and carbon fixation by Rhodomonas sp. (Cryptophyceae) cultured at different irradiance and nutrient concentrations. Aquacultural Engineering, 35, 51-60.
Langdon, C., 1993. The significance of respiration in production measurements based on oxygen. ICES Mar. Sci. Symp., 197, pp. 69-78.
Latasa, M., Scharek, R., Gall, F.L., Guillou, L., 2004. Pigment suites and taxonomic groups in Prasinophyceae. Journal of Phycology, 40, 1149-1155.
Lemonnier, H., Bernard, E., Boglio, E., Goarant, C., Cochard, J-C., 2004. Influence of sediment characteristics on shrimp physiology: pH as principal effect. Aquaculture, 240, 297-312.
Lemonnier, H., Herbland, A., Salery, L., Soulard, B., 2006. “Summer syndrome” in
Litopenaeus stylirostris grow out ponds in New Caledonia: Zootechnical and
environmental factors. Aquaculture, 261, 1039-1047.
Lemonnier, H., Courties, C., Mugnier, C., Torréton, J-P., Herbland, A., 2010. Nutrient and microbial dynamics in eutrophying shrimp ponds affected or unaffected by vibriosis. Marine Pollution Bulletin 60, 402-411.
Lemonnier, H., Lantoine, F., Courties, C., Guillebault, D., Nézan, E., Chomérat, N., Escoubeyrou,, K., Galinié,, C., Blockmans, B., Thierry Laugier, T., 2016. Dynamics of phytoplankton communities in eutrophying tropical shrimp ponds affected by vibriosis. Marine Pollution Bulletin, 110, 449-459.
Leruste, A., Malet, N., Munaron, D., Derolez, V., Hatey, E., Collos, Y., De Wit, R., Bec, B., 2016. First steps of ecological restoration in Mediterranean lagoons: Shifts in phytoplankton communities. Estuarine, Coastal and Shelf Science, 180, 190-203.
Litchman, E., 1998. Population and community responses of phytoplankton to fluctuating light. Oecologia, 117, 247-257.
Litchman, E., Klausmeier, C.A., Yoshiyama, K., 2009. Contrasting size evolution in marine and freshwater diatoms. Proceedings of the National Academy of Sciences, 106, 2665-2670.
Liu, H., Jing, H., Wong, T.H.C., Chen, B., 2014 Co-occurrence of phycocyanin- and phycoerythrin-rich Synechococcus in subtropical estuarine and coastal waters of Hong Kong. Environmental Microbiology Reports 6, 90-99.
Lucas, R., Courties, C., Herbland, A., Goulletquer, P., Marteau, A.L., Lemonnier, H., 2010. Eutrophication in a tropical pond: Understanding the bacterioplankton and phytoplankton