Phylogenetics of Flowering Plants Based on Combined Analysis
of Plastid atpB and rbcL Gene Sequences
VINCENT SAVOLAINEN,1-2-8 MARK W. CHASE,1 SARA B. H O O T ,3 CYNTHIA M. MORTON,1-4-9 DOUGLAS E. SOLTIS,5 CLEMENS BAYER,6 MICHAEL F. FAY,1 ANETTE Y. DE BRUIJN,1
STUART SULLIVAN,1 AND YIN-LONG QIU7-1 0
1Molecular Systematics Section, Jodrell Laboratory, Royal Botanic Gardens, Kew, Richmond, Surrey TW9 3DS, UK; E-mail: [email protected] (V.S.),
[email protected] (M.W.C.), [email protected] (M.F.F.) Conservatoire et Jardin Botaniques, Geneva 1293, and Institute of Ecology,
University of Lausanne, Lausanne 1015, Switzerland
^Department of Biological Sciences, University of Wisconsin-Milwaukee, Wisconsin 53201, USA; E-mail: [email protected]
department of Botany, University of Reading, Reading RG6 2AS, UK
department of Botany, Washington State University, Pullman, Washington 99164-4238, USA; E-mail: [email protected]
6
Institut fur Allgemeine Botanik, Ohnhorststrasse 18, Hamburg 22609, Germany; E-mail: [email protected]
7
Department of Biology, Indiana University, Bloomington, Indiana 47405, USA
Abstract.—Following (1) the large-scale molecular phylogeny of seed plants based on plastid rbcL gene sequences (published in 1993 by Chase et al., Ann. Missouri Bot. Gard. 80:528-580) and (2) the 18S nuclear phylogeny of flowering plants (published in 1997 by Soltis et al., Ann. Missouri Bot. Gard. 84:1-49), we present a phylogenetic analysis of flowering plants based on a second plastid gene, atpB, analyzed separately and in combination with rbcL sequences for 357 taxa. Despite some discrepancies, the atpB-based phylogenetic trees were highly congruent with those derived from the analysis of rbcL and 18S rDNA, and the combination of atpB and rbcL DNA sequences (compris-ing ~3000 base pairs) produced increased bootstrap support for many major sets of taxa. The an-giosperms are divided into two major groups: noneudicots with inaperturate or uniaperturate pollen (monocots plus Laurales, Magnoliales, Piperales, Ceratophyllales, and Amborellaceae-Nymphaeaceae-Illiciaceae) and the eudicots with triaperturate pollen (particularly asterids and rosids). Based on rbcL alone and atpB/rbcL combined, the noneudicots (excluding Ceratophyllum) are monophyletic, whereas in the atpB trees they form a grade. Ceratophyllum is sister to the rest of an-giosperms with rbcL alone and in the combined atpB/rbcL analysis, whereas with atpB alone, Am-borellaceae, Nymphaeaceae, and Illiciaceae/Schisandraceae form a grade at the base of the an-giosperms. The phylogenetic information at each codon position and the different types of substitutions (observed transitions and transversions in the trees vs. pairwise comparisons) were examined; taking into account their respective consistency and retention indices, we demonstrate that third-codon positions and transitions are the most useful characters in these phylogenetic re-constructions. This study further demonstrates that phylogenetic analysis of large matrices is feasi-ble. [Angiosperm; atpB; complex phylogenies; large molecular data sets; rbcL.]
As we near the end of the 20th century, new phylogenetic hypothesis was being systematics had gained a new perspective published every day, most of these being because of the extensive and intensive use based on DNA data. Like other groups of of molecular data in evolutionary studies, organisms (and perhaps even more so at In 1994 Donoghue showed that at least one suprafamilial levels), flowering plants have been the subject of many phylogenetic studies. Despite this emphasis, many as-8Address correspondence to this author, at Jodrell pects of higher-level angiosperm phy-Laboratory. logeny remain uncertain, including the
ini-'Present address: Department of Botany and Micro- t i a l branching patterns, relationships of the biology, Auburn University, Auburn, Alabama 36849- , , r? j - . J - j .•/•• L- c c/inv TTCA c -i » r> -i u A m o n o c o t s to t h e d i c o t s , a n d identification of 5407, USA; E-mail: [email protected] . '
^Present address: Department of Biology, University t h e m aJo r gr o uPs o f eudlCOtS a n d their in-of Massachusetts, Amherst, M A 01003-5810, USA; Email: t e r r e l a t i o n s h i p s (see C h a s e et al., 1993; [email protected] Soltis et al., 1997b; N a n d i et al., 1998).
In 1993, 42 plant systematists published an analysis of nucleotide sequences of the plastid gene rbcL, including 499 taxa repre-senting what was hoped would be all major lineages of seed plants (Chase et al., 1993). These authors discussed many problems concerning the classification and evolution of angiosperms as well as some aspects of conducting phylogenetic analyses of large data sets. Some workers accepted most of the relationships observed in these clado-grams, whereas others argued that the ac-curacy of these trees was unproven and that many of the relationships were too prepos-terous to be seriously entertained (e.g., Takhtajan, 1997). Others maintained that the analysis itself was flawed; the trees il-lustrated were only a few of the thousands that existed at that tree length, and still shorter trees were likely (Rice et al., 1998). Reanalyzing the 499 taxa matrix using sev-eral years of computer time, Rice et al. (1998) found shorter trees, although the major clades depicted in the 1993 paper re-mained unchanged.
Concomitantly, researchers using 18S rDNA expanded the coverage of angio-sperms from that of earlier studies (Hamby and Zimmer, 1992; Nickrent and Soltis, 1995). This research resulted in the analysis of Soltis et al. (1997b), which included 223 taxa covering all major lineages of flowering plants. The 18S rDNA and rbcL topologies are highly concordant; virtually all of the same major clades and subclades are re-trieved by both genes, although the branch-ing order of major clades sometimes differs. Neither the 18S rDNA nor the rbcL analysis provided internal support (as estimated by the bootstrap/jackknife) for the spine of the tree. Indeed, the 1993 rbcL paper con-tained no estimates of internal support for the large analysis; it did, however, con-tain a smaller analysis of the eudicots, for which "decay" values (e.g., Bremer support; Bremer, 1988) were produced, and from these it was clear that little support existed for major clades within the eudicots (see Chase and Albert, 1998, for a bootstrap analysis). Chase et al. (1995) demonstrated a similar pattern of low support for major clades and higher-level relationships within the monocots.
Taxonomically equivalent data sets of 18S rDNA and rbcL (Soltis et al., 1997a, 1999) as well as for 18S rDNA, rbcL, and atpB (Chase and Cox, 1998; Soltis et al., 1998; Hoot et al., 1995, 1997, 1999; Hoot & Douglas, 1998) have been constructed and compared across the angiosperms and for certain large subgroups of flowering plants. Signif-icantly, combining these data sets has re-sulted in a higher number of strongly sup-ported clades and greater resolution than have analyses of the individual data sets.
Chase and Cox (1998) examined starting-tree lengths relative to the shortest starting-trees ulti-mately found in parsimony searches for seven matrices each of 141 taxa for rbcL, atpB, and 18S rDNA (each used alone, in pairs, and all three combined). They found that the differences between the length of starting trees and the shortest trees ulti-mately obtained was greatly decreased in all combined-gene compared with single-gene matrices. This was also one of the factors re-sponsible for the decreased analysis time for the combined data sets compared with that for the individual data sets. Parsimony searches involving combined matrices actu-ally ran to completion, whereas none of the searches using individual matrices or the pairwise combinations was ever completed (Chase and Cox, 1998; Soltis et al., 1998).
Several studies indicated that a second plastid gene, atpB, would be a good candi-date for comparison and combination with rbcL (Ritland and Clegg, 1987; Hoot et al., 1995). The rate of atpB evolution appeared to be similar to that of rbcL, and atpB was described as being easy to amplify and se-quence with universal PCR primers (Hoot et al., 1995). Moreover, the atpB gene has been used successfully in phylogenetic studies at family and higher levels (Hoot et al., 1997, 1999; Hoot and Douglas, 1998; Bayer et al., 1999; Chase et al., 1999).
The genes coding for atpB and rbcL are both located in the large single-copy region of the plastid genome; their coding se-quences are on opposite strands separated by an intergenic spacer of —600-800 base pairs (bp; Savolainen et al., 1997). Different evolutionary constraints are likely to be in-volved because the two genes code for dis-tinct enzymatic functions: rbcL codes for the
large subunit of the ribulose-l,5-bisphos-phate-carboxylase/oxygenase, a free en-zyme in the stroma, whereas atpB codes for the beta subunit of the ATP synthase, which is bound to the thylakoid-membrane (Zu-rawski et al., 1982). Consequently, atpB and rbcL data represent independent data sets for which comparative analyses should be suitable. Because both are part of the same nonrecombining piece of DNA, they should have the same history.
We present here the results of phyloge-netic analyses using matrices for these two plastid genes, atpB and rbcL (~3,000 bp total), analyzed separately and in combination, for 357 taxa (—250 families) representing all major lineages of angiosperms indicated by the large rbcL and 18S rDNA studies (Chase et al., 1993; Soltis et al., 1997b). We also ex-plore more thoroughly the substitution pat-terns and quality of the phylogenetic signal present in both rbcL and atpB.
MATERIALS AND METHODS Sampling
The taxa used, as well as voucher infor-mation, references, and DNA databank ac-cession numbers, are provided in the Ap-pendix. We tried to sequence atpB from the same DNA sample used previously to se-quence rbcL. This was not always feasible, however, and in several instances we had to reextract DNAs. Whenever possible, we used the same species or another species from the same genus, but in some cases we used another genus from the same family (Appendix 1; see Kellogg and Linder, 1995, for some discussion on pitfalls of combin-ing taxa). Our final samplcombin-ing set comprises 357 species (714 gene sequences) represent-ing 261 families (sensu Watson and Dall-witz, 1991; version 1997 is available on the web at http://www.keil.ukans.edu/delta) or 250 families according to a recent reclas-sification of the angiosperms that is based largely on the results obtained from molec-ular phylogenetic studies (Angiosperm Phylogeny Group [APG], 1998). We fol-lowed the APG treatment for familial and ordinal circumpscriptions and names.
DNA Sequencing
A standard procedure used to extract DNA and sequence rbcL and atpB for many
species is described below; not all se-quences were prepared in this manner (e.g., some of the rbcL sequences had been gener-ated before widespread use of polymerase chain reaction [PCR]). Total DNAs were ex-tracted from 0.2-1.0 g leaf tissue (fresh, sil-ica gel-dried, or herbarium specimens) by using the 2 X CTAB method of Doyle and Doyle (1987) and then purified on 1.55 g ml-1 cesium chloride gradients. The rbcL gene was amplified (Gene-Amp PCR sys-tem, Perkin-Elmer 9600: 35 cycles, 1 min of denaturation at 95°C, 30 sec of annealing at 50°C, 1 min of extension at 72°C, and 7 min for final extension) by using primers IF (5'-ATGTCACCACAAACAGAAAC-3') and 1460R (5'-TCCTTTTAGTAAAAGATTGGG CCGAG-3'; Olmstead et al., 1992). The atpB gene was amplified by the same protocol as above but using primers 2F (5'-TATGAGA ATCAATCCTACTACTTCT-3') and 1494R (5'-TCAGTACACAAAGATTTAAGGTCAT -3'; Hoot et al., 1995). Bovine serum albu-min (0.40% w/v) was added to the PCR mix because it is useful for recalcitrant DNA samples, particularly those obtained from herbarium specimens (Savolainen et al., 1995). Amplification products were purified by using Magic minicolumns (Promega, Inc.) according to the manufacturer's proto-cols. Dideoxy cycle sequencing (26 cycles: 10 sec of denaturation at 96°C, 5 sec of an-nealing at 50°C, 4 min of extension at 60°C) with dye terminators was performed in 5-|xl volumes directly on the cleaned PCR prod-ucts. These reactions were then purified by simple precipitation. The resuspended sam-ple was run on an Applied Biosystems Inc. 373A or 377 automated sequencer accord-ing to the manufacturer's protocols. Both strands were sequenced by using the ampli-fication primers and the following addi-tional internal primers: 636F (5'-GCGTTG GAGAGATCGTTTCT-3') and 724R (5'-TCGCATGTACCTGCAGTAGC-3' for all dicots and 5'-TCGCATGTACCYGCAGT TGC-3' for monocots) for rbcL, and 611F (5'-AACGTACTCGTGAAGGAAATGATCT-3') and 766R (5'-TAACATCTCGGAAATATTC CGCCAT-3') for atpB (Hoot et al., 1995). These sequencing primers provided two 80-90% overlapping and complementary pairs of sequences. Additional atpB primers 40F (5'-TCCTCTTGTTCTTG GGGTTTCC-3'), 73F (5'-CAAATCATTGGYCCRGTACTGG
ATG-3'), 385R (5'-GCGCAGATCTATGAA TAGGAGACGT-3', Hoot et al., 1995) and 1186R (5'-TGTCCTGAAGTTCTTTGTAAC GTTG-3', Hoot et al., 1995) were used to se-quence atpB from gymnosperms, which were used as the outgroups.
Phylogenetic Analysis
Sequence data were analyzed by using various versions of the PAUP* package (PAUP 4.0 d50-d63, by special arrangement with David Swofford). Most-parsimonious trees were obtained through use of the fol-lowing strategies: (1) For each gene sepa-rately, 100 replicates of RANDOM taxon additions were performed, using equal weights and tree bisection-reconnection (TBR) branch swapping, with only five trees held at each step (NCHUCK = 5). The trees collectively found in these 100 repli-cates were then used as starting trees for new searches utilizing nearest-neighbor-interchange (NNI) swapping until 3,000 trees at this length were found (MAX-TREES = 3,000). (2) When both genes were analyzed together, the procedure described above was applied, but with 350 replicates of RANDOM taxon additions and holding 10 trees at each step (NCHUCK = 10); the trees collected in these replicates were then swapped on again by using TBR with only 10 trees held at each step (NCHUCK = 10) until 200 best trees were found (MAX-TREES = 200). These latter trees were then finally used as starting trees in a round of NNI swapping until completion. Each of these searches typically required ~ 1,000 hrs of CPU time for an Ultrasparc Enterprise 3000 Sun Microsystems (5 X 250 MHz, 1 GB of RAM). Taking substantially more time, similar results were obtained with a Power Macintosh with 32 MB of RAM; searches on this machine lasted more than a month, even for the combined matrix of both genes. This basic search strategy has been commonly used with large data sets and has been shown to be reasonably effi-cient (see Chase et al., 1993; Soltis et al, 1997b; Chase and Cox, 1998).
Internal support was evaluated by using bootstrap resampling (Felsenstein, 1985). For each matrix (singly or in combination), 1,000 bootstrap replicates were performed, using the NNI swapping algorithm with
simple addition of taxa and only 10 trees held at each step (random deletion with replacement as implemented in bootstrap-ping eliminates the need to perform ran-domization of taxon entry order; the dele-tion/substitution of characters alters the distance calculations, thus randomly alter-ing the taxon-addition patterns). Each boot-strap set (1,000 replicates) typically required 6 days using a Power Macintosh (7300/166, 32 MB of RAM).
MacClade 3.04 (Maddison and Maddi-son, 1992) was used to evaluate codon fre-quencies and to calculate various statistics (i.e., consistency index [CI] and retention index [RI] for each codon position, exclud-ing autapomorphies for the former), and to map the morphological and chemical char-acters of Nandi et al. (1998) onto the com-bined trees. MEGA 1.0.1 (Kumar et al., 1993) was used to compare the molecular evolution of atpB and rbcL. MEGA provides widely used calculations (e.g., transitions, transversions, and so forth) that we wished to compare with tree-based values. For this purpose, 40 taxa were randomly chosen (the 40 first taxa in alphabetical order) and analyzed by pairwise comparisons without correction for multiple substitutions. LI93 also was used to calculate unbiased rates of synonymous, nonsynonymous, and overall substitutions, based on the same pairwise comparisons as above (Li, 1993). For com-parison with distance-based calculations, we also calculated the number of inferred transitions and transversions (as well as their CIs and RIs), using a step matrix in PAUP* in which transversions were weighted " 1 " and transitions "0." From the number of transversions and their collec-tive CI and RI, we calculated the number of transitions and their CI and RI.
We calculated the CI and RI for transver-sions, transitions, and each codon position to evaluate the hypothesis that frequency is a valid basis on which to implement rela-tive weighting (i.e., that rarer events would be more reliable in phylogeny reconstruc-tion than more frequent ones). We used RI as the criterion to discuss relative informa-tion content of different character types (Farris, 1989). CI measures overall homo-plasy, whereas RI takes into account the maximum number of changes that could have occurred on an unresolved bush and
thus measures amount of structure (or phy-logenetic signal) retained on optimal trees (Farris, 1989).
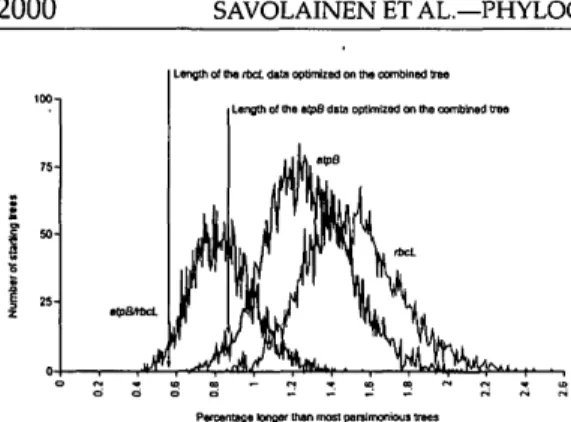
To compare the distribution of starting tree lengths with the length of optimal trees, we followed the same procedure as Chase and Cox (1998): The lengths of 5,000 starting trees (stepwise addition with ran-dom taxa order, no swapping, as imple-mented in PAUP*) were recorded for each data set (atpB and rbcL alone and in combi-nation) and plotted as the percentage by which they were longer than most-parsi-monious trees (i.e., those we found in each of the full heuristic searches after extensive swapping).
RESULTS
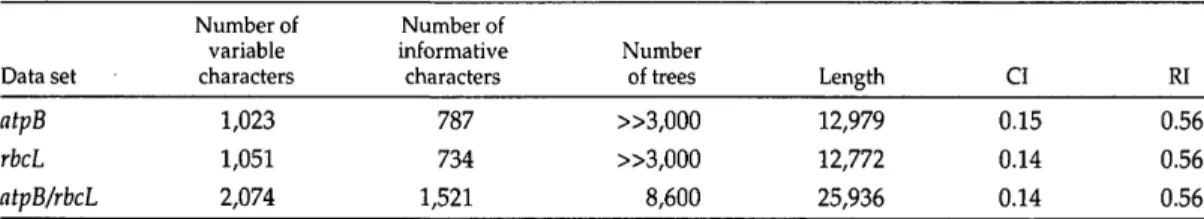
Molecular Evolution and Patterns of Change Sequences of both genes were aligned easily by eye; the combined matrix con-tained 1,408 characters for rbcL (1,428 bp minus the length of the IF primer) and 1,447 for atpB (1,497 bp minus the length of the 2F and 1494R primers). There were no insertions or deletions (except for some rare exceptions in atpB; these insertions were simply omitted from the matrix because they occurred only in single taxa at the 3' end of the gene). The number of variable and potentially parsimony-informative char-acters found in each data set, the number and length of the most-parsimonious trees obtained, and the CIs and RIs for each of the analyses performed are presented in Table 1. Data sets are available at the Sys-tematic Biology Web site (www.utexas. edu /ftp/ depts / systbiol /).
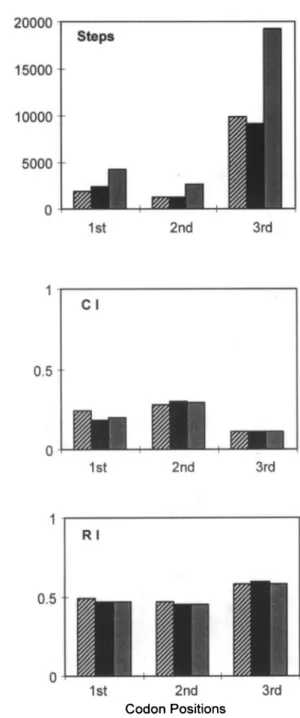
Branch lengths, CIs, and RIs are shown for each partition (genes alone or in combi-nation) by codon position (Fig. 1); most of the variation (75% and 71% for atpB and rbcL, respectively) is at third positions as
previously reported (Chase et al., 1995; Hoot et al., 1995). Second positions experi-enced the fewest steps (10% in both genes), and first positions were intermediate (15% and 19% for atpB and rbcL, respectively). Whereas CIs were greater at the second po-sitions (0.28 and 0.29, respectively) and less at third positions (0.11 for both), RIs were similar for the first (0.48 and 0.46) and sec-ond (0.46 and 0.44) positions, with the high-est values at the third positions (0.75 and 0.59, respectively). In contrast, Naylor and Brown (1997,1998) found RI was lowest for third-position sites in animal mitochondrial genes. Using computer-generated data sets, Hauser and Boyajian (1997) demonstrated that RI was primarily influenced by the per-centage of characters that change per node but was only weakly correlated with the number of taxa. Here, in the atpB/rbcL tree, the average rate of change (number of steps /number of variable sites) was 7.74 for first, 5.35 for second, and 20.09 for third-codon positions. We can thus infer that the only factor responsible for the higher RI of the third-codon positions is their distribu-tion within the tree.
Table 2 compares the rates of synony-mous, nonsynonysynony-mous, and overall substi-tution for atpB and rbcL. As previously re-ported by Hoot et al. (1995), the overall rate of substitution is slightly higher for rbcL than atpB. This contrasts with the tree length, which is shorter for rbcL than for atpB (12,772 vs. 12,979, Table 1; for contra-dictory results, see Hoot et al., 1995, 1999). Tree-based estimates of sequence change are therefore at odds with those calculated a priori, in the absence of a topology, by us-ing pairwise comparisons. Synonymous versus nonsynonymous sites do not differ significantly between rbcL and atpB.
Transition/transversion ratios (ts/tv) for atpB and rbcL also differ. We calculated the TABLE 1. Comparison of indices for the various trees illustrated in Figures 5 and 6 (tree length includes unin-formative characters; consistency index [CI] excludes uninunin-formative characters).
Data set atpB rbcL atpB/rbcL Number of variable characters 1,023 1,051 2,074 Number of informative characters 787 734 1,521 Number of trees »3,000 »3,000 8,600 Length 12,979 12,772 25,936 CI 0.15 0.14 0.14 RI 0.56 0.56 0.56
2nd 3rd 0.5-C l 1st 2nd 0.5-2nd Codon Positions 3rd
FIGURE 1. Number of steps, consistency index (CI), and retention index (RI) for each codon position for the trees inferred from the analysis of atpB alone (hatched), rbcL alone (solid), and atpB/rbcL combined (shaded). Note that the RI for third-codon positions is higher than that for first and second positions.
ts/tv ratio on one of the trees obtained from the analysis of the combined rbcL and atpB data set: for atpB ts/tv is 2.09, whereas for rbcL it is 1.65 (Table 3); similar ts/tv ratios were found by Hoot et al. (1995). Using in-stead the shortest trees from each of the
TABLE 2. Comparison of the rates of synonymous (Ks), nonsynonymous (KA), and overall rates of substi-tutions (Ko) between atpB and rbcL (see Materials and Methods). atpB rbcL 0.261 ± 0.088 0.019 ± 0.007 0.092 ± 0.029 0.270 ± 0.080 0.025 ± 0.007 0.098 ± 0.027
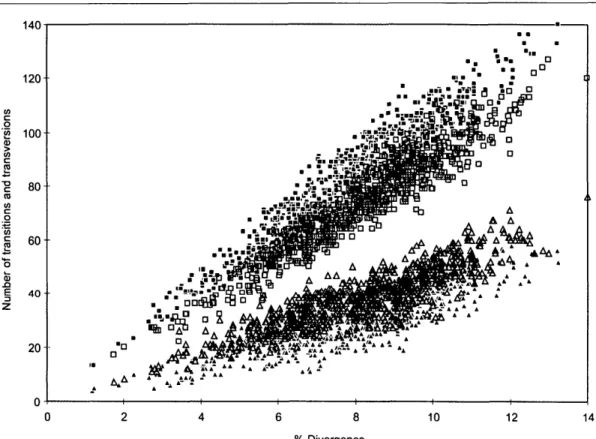
separate analyses affects only the second decimal place. Figure 2 shows the percent-age of divergence versus the number of transitions and transversions in pairwise comparisons (independently from the re-covered trees). The atpB gene exhibits the greater number of transitions, which agrees with the ts/tv ratio we calculated based on the trees (see Table 3).
CIs and RIs for transitions and transver-sions (Table 3) exhibit a pattern similar to that for codon-based change. Transitions had slightly lower CIs than transversions (ts atpB = 0.12 and ts rbcL = 0.13 vs. tv atpB = 0.17 and tv rbcL = 0.15), but the RIs for tran-sitions were higher than those for transver-sions (ts atpB = 0.64 and ts rbcL = 0.62 vs. tv atpB = 0.47 and tv rbcL = 0.49). Thus, the much more numerous transitions per-formed better (had higher RIs) than the rarer transversions.
Phylogenetic Patterns and Support Neither of the two genes individually has any striking differences in the number of groups receiving bootstrap support (Figs. 3-6), but the combined matrix clearly
pro-TABLE 3. Number of steps (length), consistency index (CI), and retention index (RI) for inferred trans-versions (tv) and transitions (ts) in one of the trees ob-tained from the analysis of the combined rbcL and atpB data set (see Results).
atpB: Length CI RI rbcL: Length CI RI tv/ts 13,089 0.15 0.56 12,847 0.14 0.56 tv 4230 0.17 0.48 4852 0.15 0.49 ts 8859 0.12 0.64 7995 0.13 0.62 tv/ts 2.09 1.65
140 120 "g 100 80 60-40 20- •o A ^ ' . " - • f t ? D & a 10 12 14 % Divergence
FIGURE 2. Percent divergence plotted against the number of transitions (squares) and transversions (triangles) for pairwise comparisons of atpB (solid) and rbcL (open) sequences. Note that although both genes are similar for both kinds of substitutions and no saturation is observed, atpB is slightly biased towards transitions, whereas rbcL is biased toward transversions.
vides more resolution and robust relation-ships than the individual matrices. Figures 3 and 4 present topologies found when both genes were analyzed separately and in combination, respectively (for composition of the named clades, see Figs. 5 and 6; the names of families and ordinal groups fol-low those recommended by the APG, 1998). Figures 5a-p present one of the 3,000 short-est trees found for atpB and rbcL analyzed separately (see Table 1; because of memory limitations, only 3,000 trees were kept; however, more trees at this length exist). Figures 6a-h present one of the 8,600 short-est trees found in the analysis of combined data (see Table 1 for tree statistics). In all figures, arrows indicate the branches that are not found in the strict consensus of the shortest trees.
Figure 7 shows the distribution of start-ing tree lengths in comparison with the length of the optimal trees for atpB and rbcL alone and in combination. The shape of the curves is not smooth but rather jagged: This
could indicate that suboptima occur locally (e.g., starting atpB trees at length 13,143 or 13,146 are more likely to be built than at 13,144 steps; the former found 77 and 76 trees at each, respectively, vs. only 62 for 13,144; see Fig. 7). The combined data set produced the greatest number of starting trees nearest to the shortest tree length (the atpB/rbcL curve is left-skewed compared with atpB or rbcL alone), which explains why combined matrices ran to completion and required less swapping time to reach optima than did the analyses involving sin-gle genes (Chase and Cox, 1998; Soltis et al, 1998). Because we set a tree limit in each case (combined vs. single-genes), the faster analysis time exhibited for the combined matrix is strictly a factor of the tree lengths (starting vs. final), rather than the number of starting trees.
Apart from the above considerations of molecular evolution, atpB and rbcL also dif-fer slightly in the phylogenetic patterns in-ferred. We consider the trees produced by
(a) (b) asterids eurosids Santalales Aextoxlcon/Berberidopsis Caryophyllales Saxifragales LeeaA/itis Gunnera Buxaceae/Trochodendracea Proteales Ranunculales monocots Acorus Ceratophyllum Magnolialss Laurales Piperales Nymphaeaceae s.l. outgroup asterids Aextoxlcon/Berberidopsis eurosids LeeaATitis Saxifragales Santalales Caryophyllales Gunnera Buxaceae/Trochodendraceae Proteales Ranunculales monocots Acorus Laurales Piperales Magnoliales Nymphaeaceae s.l. Ceratophyllum outgroup
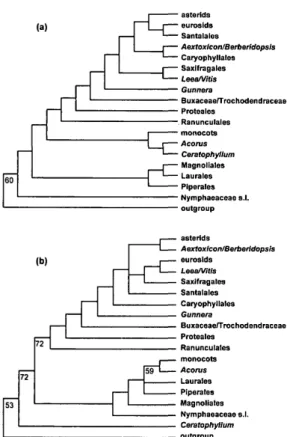
FIGURE 3. Summary of the phylogenetic trees repre-senting only the major groupings inferred from the separate analysis of the atpB (a) and rbcL (b) coding se-quences (see Fig. 5a-p for detailed topology). Boot-strap values >50% are indicated.
the combined analysis to be more accurate than trees obtained from either gene indi-vidually, given the higher levels of boot-strap support (see earlier examples pre-sented in Hoot and Crane, 1995; Chase and Cox, 1998; Soltis et al., 1998; Hoot et al, 1999). We are not suggesting that bootstrap support is infallible—spurious groupings with high bootstrap values are well docu-mented (see Lecointre et al., 1993)—but for Lecointre et al. this occurred concomitantly with long branch attraction and sparse taxon sampling. We will not discuss in de-tail the differences between the three trees (atpB and rbcL alone plus atpB/rbcL com-bined); we stress, however, that no strongly supported and incongruent patterns were obtained. The atpB tree compares well with the rbcL trees of Chase et al. (1993); only the topologies with weak bootstrap support (<50%) vary (Qiu et al., 1993; Chase and Cox, 1998; Nandi et al., 1998).
For descriptive purposes, we have di-vided the flowering plants into two major groups: (1) noneudicots with inaperturate or uniaperturate pollen (monocotyledons plus Laurales, Magnoliales, Piperales, Cer-atophyllales, and the Amborellaceae-Nymphaeaceae-Illiciaceae group; see Figs. 5a-d, 6a,b) and (2) eudicots with triapertu-rate pollen (as defined by Chase et al., 1993; see Figs. 5e-p, 6c-h). The most obvious ex-ceptions to the monosulcate pollen charac-teristic of the former group are Illiciaceae and Schisandraceae, which have tricolpate pollen, but the pollen of these families is known to have been derived in a nonho-mologous manner (Huynh, 1976).
NONEUDICOTS
The noneudicots comprise woody (e.g., Magnoliales and Laurales), herbaceous (e.g., most Chloranthaceae and Piperales), and aquatic (e.g., Ceratophyllaceae and Nymphaeaceae) taxa. Although many stud-ies (Soltis et al., 1997b; Nandi et al., 1998), as well as the atpB tree presented here, have shown the noneudicots to be paraphyletic, this informal name is useful for describing a largely monophyletic group (if Ceratophyl-lum is excluded) recognized here in the rbcL and combined trees. The monocots are em-bedded within the noneudicots in all trees (Figs. 5a,b, 6a). In this study, the monocots have not been sampled extensively but are represented by a taxonomically diverse spectrum (Figs. 5c,d, 6b). We refer readers to Duvall et al. (1993), Soreng and Davis (1998), and Chase et al. (1995, 2000) for broader analyses of the monocots. How-ever, both atpB and rbcL provide highly similar topologies, with Acorus being sister to the remaining monocots (Figs. 5c,d, 6b).
A major difference between atpB and rbcL concerns the monophyly of the noneudicots (excluding Ceratophyllum). In the rbcL tree (Fig. 5b; Chase et al., 1993; Qiu et al., 1993), the noneudicots are monophyletic, as they are in the combined tree (Fig. 6b). However, with atpB (Fig. 5a), 18S rDNA (Soltis et al., 1997b), and 18S rDNA/rbd (Soltis et al., 1997a), the noneudicots form a grade, with the root attached between Amborella and all other angiosperms. Because the bootstrap does not provide support >50% for either view, we argue that neither of these results
100 89 67
d
91 92 51 62 61 Solanales Lamiales Gentianales GarryalesE
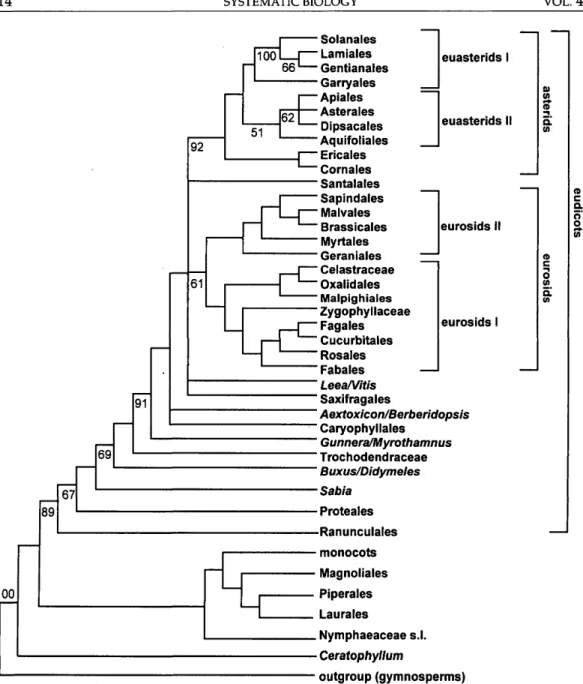
Apiales Asterales Dipsacales — Aquifoliales r ~ Ericales euasterids I euasterids II eurosids I Cornales Santalales Sapindales Malvales Brassicales eurosids II Myrtales Geraniales Celastraceae Oxalidales Malpighiales Zygophyllaceae Fagales Cucurbitales Rosales " Fabales ' Leea/Vitis ' Saxifragales ' Aextoxicon/Berberidopsis ' Caryophyllales ' Gunnera/Myrothamnus ' Trochodendraceae ' Buxus/Didymeles • Sabia - Proteales -Ranunculales monocots Magnoliales Piperales Laurales . Nymphaeaceae s.l. • Ceratophyllum outgroup (gymnosperms)FIGURE 4. Summary of the phylogenetic trees representing only the major groupings inferred from the com-bined analysis of the atpB/rbcL coding sequences (see Fig. 6a-h for detailed topology). Bootstrap values >50% are indicated.
nor any of the previously published studies is reliable, and we await further data for a robust resolution of the problem.
Relationships within the noneudicots are consistent in all three trees, but patterns of bootstrap support are variable. Two incon-sistent patterns are those for Aristolochi-aceae and Acorus. AristolochiAristolochi-aceae are pa-raphyletic to the rest of Piperales with atpB and are monophyletic arid sister to the rest of Piperales with rbcL (Figs. 5a,b). Acorus
(Figs. 5c,d) is sister to Ceratophyllum with atpB and is alone as the sister to the mono-cots with rbcL. In both cases, the combined tree favors the rbcL pattern, although there is <50% bootstrap support for the mono-phyly of Aristolochiaceae (Fig. 6a); support is greater for the position of Acorus alone as sister to the rest of the monocots: 86% for the monophyly of the monocots excluding Ceratophyllum, and 83% for the monophyly of the monocots minus Acorus (Fig. 6b).
(a) atpB 11 1 2 eudicots e 2 4 2 6 68 2 6 94 6 59 3 1 J J 18 18 100 3 71 3 17 100 4 12 14 101 1 1
4
4 14 fOO 8 99 41GZ
23 9rr;—
14 7 14 Lu 4 2 3 13 34 39 4 65 41 100 18 100 5 100 ) 10 98 14 43 10GZ
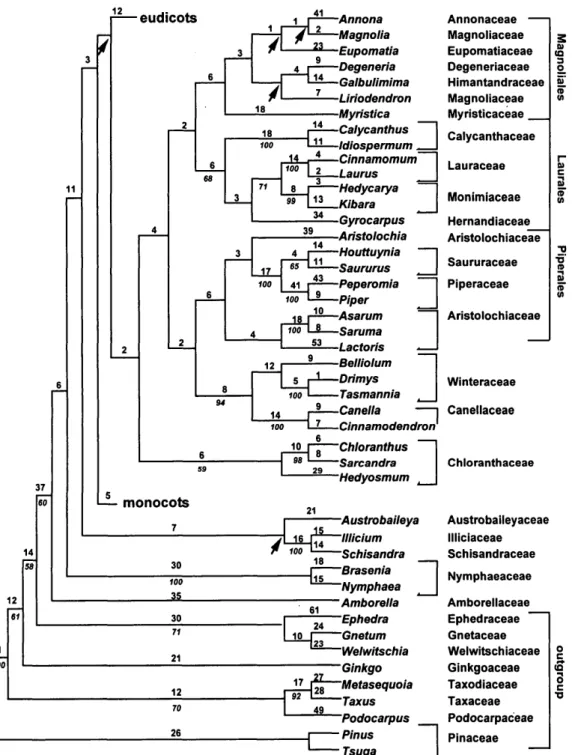
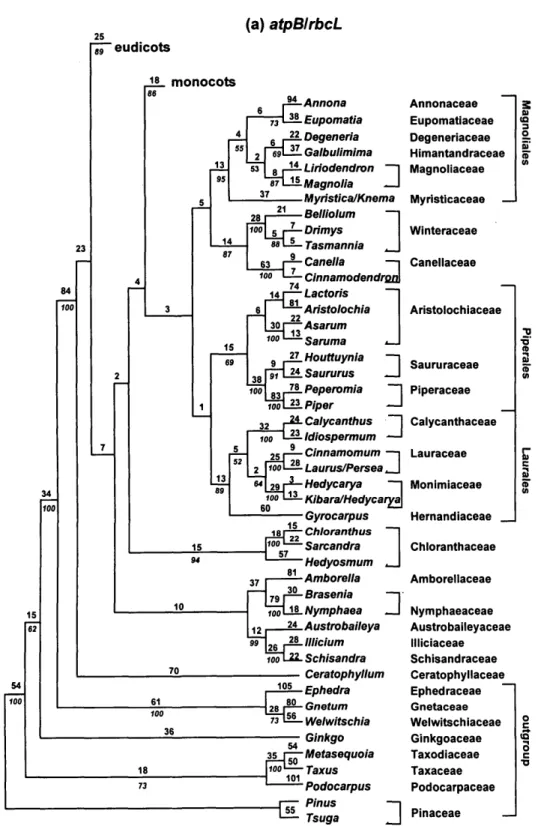
53 9 r1 -9 r— U 6 29 Annona Magnolia Eupomatia Degeneria Galbulimima Liriodendron Myristica Calycanthus Idiospermum ^__ Cinnamomum Laurus Hedycarya Kibara Gyrocarpus Aristolochia Houttuynia Saururus Peperomia Piper Asarum Saruma Lactoris Belliolum Drimys Tasmannia Canella Cinnamodendron Chloranthus Sarcandra Hedyosmum — monocots 21 16 30 100 35 30 10 21 12 70 26 Austrobaileya Illicium 1 8 Schisandra j Brasenia Nymphaea ~ Amborella ~ Ephedra _T^—Gnetum Welwitschia Ginkgo 1 7 ff—Metasequoia Taxus 'Podocarpus Pinus Tsuga 49 Annonaceae — Magnoliaceae Eupomatiaceae Degeneriaceae Himantandraceae Magnoliaceae Myristicaceae Calycanthaceae Lauraceae Monimiaceae Hernandiaceae Aristolochiaceae Saururaceae Piperaceae Aristolochiaceae Winteraceae Canellaceae Chloranthaceae Austrobaileyaceae Illiciaceae Schisandraceae Nymphaeaceae Amborellaceae Ephedraceae Gnetaceae Welwitschiaceae Ginkgoaceae Taxodiaceae Taxaceae Podocarpaceae PinaceaeFIGURE 5. One of 3,000 best trees resulting from the exploratory phylogenetic analysis of atpB alone and rbcL alone for 357 taxa. For rbcL, tree length is 12,772 steps, CI = 0.14, and RI = 0.56; for atpB, tree length is 12,979 steps, CI = 0.15, and RI = 0.56. Arrows indicate branches collapsing in the strict consensus tree of all shortest trees. The numbers of steps are indicated above the branches, and bootstrap values >50% are indicated below the branches.
(b) rbcL 18 . . . —eudicots JL monocots 59 39 35 59 27 30 -Aristolochia -Lactoris ~Asarum ~Saruma ~Houttuynia 'Saururus 'Peperomia -Piper Aristolochiaceae Saururaceae Piperaceae talycanthus ~1 calycanthaceae Idiospermum ~-J ' — Idiospermum 5 ^-Cinnamomum 33 : Hedycarya - Gyrocarpus - Eupomatia - Knema Degenerfa Galbulimima Liriodendron 9 0 ^ - M a g n o l i a Lauraceae Monimiaceae Hernandiaceae — Annonaceae Eupomatiaceae Myristicaceae Degeneriaceae Himantandraceae Magnoliaceae 15 Belliolum Drimys Tasmannia Canella Cinnamodendron_ Chloranthus Sarcandra Hedyosmum Amborella Winteraceae Canellaceae Chloranthaceae Amborellaceae Nymphaea Austrobaileya Nymphaeaceae JL Schisandra — Ceratophyllum A *-Ephedra — Gnetum
3
-|22 75~li5 Welwitschia 2 8 Metasequoia — Taxus Podocarpus Ginkgo Tsuga Pinus Austrobaileyaceae Illiciaceae Ceratophyllaceae Ephedraceae Gnetaceae Welwitschiaceae Taxodiaceae Taxaceae Podocarpaceae Ginkgoaceae PinaceaeFIGURE 5. (Continued) Because of their size, the trees have been broken into eight parts each. Each atpB and rbcL tree is presented on opposite pages to facilitate comparisons: (a, b) noneudicots, (c, d) monocots, (e, f) eudi-cots, (g, h) caryophyllids, (i, j) eurosids I, (k, 1) eurosids II, (m, n) asterids, (o, p) euasterids. Suprageneric nomen-clature follows that published by the Angiosperm Phylogeny Group (1998).
(c) atpB: monocots Androcymbium Bomarea Veratrum Xerophyllum Lapageria Uoydia Nomocharis Tulipa Tricyrtis '— Anthericum Bulbine Asparagus Ipheion Xeronema Ixiolirion Blandfordia Rhodohypoxis Conanthera Tecophilaea Odontostomum Apostasia — Cypripedium Oncidium A Dioscorea Tacca Oryza Zea — Juncus Barbacenia Stemona Sphaeradenia Spathiphyllum Pleea Tofieldia _ _ Acorus Ceratophyllum Colchicaceae Alstroemeriaceae Melanthiaceae Philesiaceae Liliaceae Anthericaceae Asphodelaceae Asparagaceae Alliaceae Xeronemataceae Ixioliriaceae Blandfordiaceae Hypoxidaceae Tecophilaeaceae Orchidaceae — Dioscoreaceae Taccaceae Poaceae Juncaceae Velloziaceae Stemonaceae Cyclanthaceae Araceae Tofieldiaceae Acoraceae Ceratophyllaceae Lili ; CD (A > (A "O D) 3 (Q fl) (D (/) o 5' o o 01 5" TJ o al e « smata l FIGURE 5. (Continued)
Support for some clades is greater with atpB than for rbcL (e.g., bootstrap support for Canellaceae/Winteraceae is 94% with atpB and <50% with rbcL; support for the monophyly of Laurales is 68% with atpB vs. 51% with rbcL). In other groups, in contrast, support is greater for rbcL than for atpB (e.g., support for the monophyly of Magno-liales is 64% with rbcL vs. <50% with atpB; support for the monophyly of
Chloran-thaceae is 90% with rbcL vs. 59% with atpB); in all cases, groups supported by one gene are not contradicted by different groups with strong support from the other gene.
Eudicots
The eudicots consist of (1) a basal (asym-metric) grade, comprising putatively "an-cient" lineages with relatively few species
(d) rbcL: monocots
17 10 69 67 68 100 12 96 09 99 r-^_ Androcymbium H 34 1 Bomarea 1 4 Lapageria u Lloydia ~~ Nomocharis 56 10 31 ^- Tricyrtis Veratrum r 22 Xerophyllum — Anthericum 27 j Asparagus ' Bulbine 22 ipheion 13 Xeronema 41 Ixiolirion Conanthera ~~ 10 98 13 16 Odontostomum 19 Tecophilaea L_ 3L- Apostasia ~~ 95 T7 26 Oncidium § Cypripedium l 72 45 i i _ Blandfordia Rhodohypoxis Barbacenia Sphaeradenia Stemona Dioscorea Tacca Juncus t — Oryza ^ i * - Z e a 8 Pleea Tofieldia i S - Spathiphyllum Acorus1
1
Colchicaceae Alstroemeriaceae Philesiaceae Liliaceae Melanthiaceae Anthericaceae Asparagaceae Asphodelaceae Alliaceae Xeronemataceae Ixioliriaceae Tecophilaeaceae Orchidaceae Blandfordiaceae Hypoxidaceae Velloziaceae Cyclanthaceae Stemonaceae Dioscoreaceae Taccaceae Juncaceae Poaceae Tofieldiaceae Araceae Acoraceae 3 a 0)h
-4
o <o 0) V) FIGURE 5. (Continued)each, i.e., Ranunculales, Proteales, Buxac-eae/Didymelaceae, Trochodendraceae, Sa-biaceae; and (2) a large symmetric core clade consisting of
Gunneraceae/Myroth-amnaceae, Dilleniaceae, Vitaceae, Santalales, Caryophyllales, Saxifragales, and Berberi-dopsidaceae/Aextoxicaceae plus two major subclades, eurosids and asterids (Figs. 5i-p,
(e) atpB: eudicots 10 2 asterids rosids caryophyllids 1 1 6 3 6 83 6 2 7 2 52 30 100 5 82 1 I 18 4
nr~
13 I 1-35 6 r - — 84 \1 37 34 47 11 98 1 0 i i inn I 12 11 99 11 18 rz— Ul 26 12 30 45 29 33 19 r * — Altingia ' Daphniphyllum Liquidambar Paeonia Astilbe Boykinia Heuchera Chrysosplenium Peltoboykinia Saxifraga i Ribes Crassula Dudleya Sedum Kalanchoe Haloragis I Myriophyllum^ J Penthorum Itea Pterostemon Cercidiphyllum^ Corylopsis Hamamelis Disanthus Leea ~ Vitis _ Dillenia Schumacheria Tetracera ^_ Myrothamnus Gunnera Buxus Pachysandra | Didymeles Tetracentron Trochodendron \ Sabia Lambertia ~ Roupala Placospermum Platanus < ~ Nelumbo _ Altingiaceae Daphniphyllaceae Altingiaceae Paeoniaceae Saxifragaceae Grossulariaceae Crassulaceae 12 15 J Caulophyllum18 29 44 23 28 14 Nandina ^_ Xanthorhiza ~ Glaucidium Hydrastis ^_ Menispermum Decaisnea Dicentra Euptelea Haloragaceae Penthoraceae Iteaceae Pterostemonaceae Cercidiphyllaceae Hamamelidaceae Vitaceae Dilleniaceae Myrothamnaceae Gunneraceae Buxaceae Didymelaceae Trochodendraceae Sabiaceae Proteaceae Platanaceae Nelumbonaceae _ Berberidaceae Ranunculaceae Menispermaceae Lardizabalaceae Papaveraceae Eupteleaceae FIGURE 5. (Continued)—asterids 8 3T rosids (f) rbcL: eudicots 19 jJLfiLeea -Vitis — Altingia Liquidambar „_ Corylopsis ~~ Hamamelis Disanthus •-Astilbe I ~ Q j L Boykinia si 4 25_ Chrysosplenium " 1 ! I — u i Peltoboykinla 1
—B—I ! ,-U- Heuchera
Saxifraga L. Pterostemon Crassula Dudleya Kalanchoe Haloragis 11 Myriophyllum ^_ Penthorum Geranium Pelargonium Paeonia Ribes Cercidiphyllum Daphniphyllum Viscum Thesium Santalum Vitaceae Altingiaceae Hamamelidaceae Saxifragaceae Iteaceae Pterostemonaceae Crassulaceae Haloragaceae Penthoraceae Geraniaceae Paeoniaceae Grossulariaceae Cercidiphyllaceae Daphniphyllaceae. Olacaceae Opiliaceae 1 Santalum J caryophyllids i-2L Gunnera — L I L Myrothamnus 57 1 4 R —I g rgT-Lli- Pachysandra J Santalaceae ouxus • Pachysandra . Didymeles . Tetracentron Trochodendron Lambertia I Gunneraceae Myrothamnaceae Buxaceae Didymelaceae Trochodendraceae I Proteaceae Sabiaceae Nelumbonaceae Platanaceae Berberidaceae 5f nanaina ' Glaucldium i
3o" Xanthorhiza Ranunculaceae
Hydrastis J —- Menispermum —— Decaisneauecaisne, •—- Euptelea Dicentra Menispermaceae Lardizabalaceae Eupteleaceae Papaveraceae FIGURE 5. (Continued)
95 16 21 74 97 20 62 63 56 29_ 24_ 89_ 10 29 19 98 25 100
(g) atpB: caryophyllids
3 -556 63 9 88 1 28 9 8 6 |~~~ 99 I—2 26 52 Aextoxicon Berberidopsis Amaranthus~\ Spinacia ^ Bougainvillea Delosperma ~"|Ercilla J
Phytolacca Rhipsalis Limeum Silene Aextoxicaceae Berberidopsidaceae Amaranthaceae Nyctaginaceae Aizoaceae Phytolaccaceae Cactaceae Molluginaceae Caryophyllaceae "Rhabdodendron Rhabdodendraceae Simmondsia Drosera Nepenthes Frankenia Plumbago • Polygonum •Rheum Simmondsiaceae Droseraceae Nepenthaceae Frankeniaceae Plumbaginaceae Polygonaceaeo
fi> o (D FIGURE 5. (Continued)6e-h). The same basal grade was found in previous analyses of the "lower" eudicots based on three genes—these two plastid genes plus 18S rDNA (Soltis et al., 1998; Hoot et al., 1999).
In the separate atpB and rbcL trees, the spine of the lower eudicot portion of the tree receives no support >50%, whereas in the combined analysis three large clades are supported (Fig. 6c): (1) the dichotomy that separates Ranunculales (including Eupte-lea) from all other eudicots (67% for eudi-cots excluding Ranunculales, 94% for the monophyly of Ranunculales); (2) the eudi-cots excluding Ranunculales, Proteales, and Sabiaceae (69%); and (3) the core eudicots (91%, just above Trochodendraceae). Ra-nunculales and core eudicots are more highly supported (97% and 100%, respec-tively) in a study of basal eudicots with more extensive sampling for Ranunculales (Hoot et al., 1999). Other notable relation-ships that receive increased bootstrap
sup-port in our combined atpB/rbcL analysis are the monophyly of Nelumbonaceae/[Pro-teaceae/Platanaceae] (<50% in both atpB and rbcL alone, 60% in the combined trees), Gunneraceae/Myrothamnaceae (<50% in atpB, 57% in rbcL, 80% in the combined), and Buxaceae/Didymelaceae (71% in atpB, 84% in rbcL, and 100% in the combined).
Two groupings actually lose support in the combined tree over that in one of the in-dividual trees: the clade consisting of Pla-tanaceae/Proteaceae (95% in atpB, <50% in rbcL, 84% in the combined), and the mono-phyly of Ranunculaceae (90% in rbcL, <50% in atpB, 78% in the combined). Alternative patterns found in the individual analyses are not supported by the bootstrap, but ap-parently these destabilize the combined analysis, resulting in slightly decreased bootstrap percentages. Even in this situa-tion it would be difficult to argue that this decrease in support is attributable to "hard" incongruence (Seelanan et al., 1997);
(h) rbcL: caryophyllids
Amaranthus Spinacia Bougainvillea Delosperma Ercilla 12 Phytolacca Trianthema Schlumbergera Silene Frankenia Drosera Nepenthes Plumbago Polygonum Rheum Nyctaginaceae Aizoaceae Phytolaccaceae Molluginaceae Cactaceae Caryophyllaceae Frankeniaceae Droseraceae Nepenthaceae Plumbaginaceae |Polygonaceae Simmondsia Simmondsiaceae Rhabdodendron Rhabdodendraceae_ Dillenia —i Schumacheria pilleniaceae Tetracera J FIGURE 5. (Continued)o
o
•orather, we suggest that it is due to the simple addition of an unclear pattern in one gene to a clear one in the other, resulting in less sup-port in the combined analysis. With three genes combined (atpB/rbcL/18S rDNA), these two clades, Platanaceae/Proteaceae and Ranunculaceae, are each strongly sup-ported (Soltis et al, 1998; Hoot et al, 1999).
All three data sets provide evidence for a monophyletic Saxifragales (Figs. 5e,f, 6c), but in the rbcL tree, Geraniaceae are embed-ded within this order near Paeoniaceae. This is most likely a result of the sampling used here; in the Chase et al. (1993) rbcL tree with greater sampling, Geraniaceae appeared with the group here named Geraniales (Fig. 6f). The position of Paeoniaceae within Sax-ifragales is highly unstable and has little support for any particular placement (but see Soltis et al., 1997b, 1999; Soltis and Soltis, 1998, for relationships in Saxifragales). The relationship of Saxifragales to the other ma-jor clades is also unstable, mostly because of the short branches along the spine of the tree (Fig. 6c). As in Hoot et al. (1999), Soltis and
Soltis (1998), and Soltis et al. (1999), the vari-ous members of the Hamamelidaceae repre-sented here (Corylopsis, Hamamelis,
Disan-thus) are found in a clade consisting of Saxifragales and other assorted rosids.
Similarly, all three data sets support an expanded Caryophyllales (74% in atpB, 84% in rbcL, and 97% in the combined; Figs. 5g,h, 6d), but their placement relative to the rosids (including Saxifragales and Vitaceae) and asterids has bootstrap values <50% in all three analyses. The expanded Caryo-phyllales includes a core clade consisting of Amaranthaceae, Aizoaceae, Cactaceae, Car-yophyllaceae, Molluginaceae, Nyctagina-ceae, and Phytolaccaceae. A clade of Dro-seraceae, Plumbaginaceae, Polygonaceae, and Nepenthaceae is also found in all three trees but exhibits only low support in the combined analysis (67%; Fig. 6d). Many of the relationships within both core Caryo-phyllales and this second clade are also well supported, but additional taxa not in-cluded here are also found to be related to Caryophyllales s.l. (e.g., Physenaceae and
(i) atpB: rosids (mostly eurosid I) eurosids II 1 44 10 36 100 74 74 82 16 39 40 90 13 Afrostyrax Brexia — Celastrus -— Hippocratea 21— Plagiopteron I3— Salacia Euonymus Stackhousia Pamassia •I3— Averrhoa 6 Rourea Huaceae Celastraceae 2 , 11— Eucryphia •"* . Platytheca Sioanea i ! _ Carallia 36 Erythroxylum 24 S—Dicella 7oo-Ljl_ Malpighia 7 4 6 Dichapetalum 1 41 Euphorbia 15- Humlria "H— Medusagyne "j7 • — Ochna 4 I Hydnocarpus ' .. Goupia 4 i ^ Hydnocarpus *—£- Goupia 18 i Hymenanthera ~~| 15 ' Rinorea Ait '—' R/norea - g - /rv/ng/a Pifl 38 „ .« 20 i ei. Pass/flora _._ I * " w _ _ 33 99 i "** Turnera 34 98 16 98 10 95 23 10 97 71 88 —— Linum Reinwardtia — Betula i i - Casuarina -11- Myrica Jfi- Pterocarya Trigonobalanus 22— Coriaria Corynocarpus Datisca 18 < 21 Kedrostis ~j^ u Xerosicyos HLDryas 54 Gaum 23 Spiraea > El 73 1 a spiraea 4 3 1P>i4 Elaeagnus 1 Rhamnus 11 89 10 i 1C Humulus Trema 98 5 i 4 C Mori/s 18 I Pisum i n 30 Sophora Stackhousiaceae Pamassiaceae Oxalidaceae ~ Connaraceae Cunoniaceae Tremandraceae Elaeocarpaceae_ Rhizophoraceae Erythroxylaceae Malpighiaceae Dichapetalaceae Euphorbiaceae Humiriaceae Medusagynaceae Ochnaceae Flacourtiaceae Goupiaceae Violaceae Irvingiaceae Passifloraceae Turneraceae Salicaceae Linaceae Betulaceae Casuarinaceae Myricaceae Juglandaceae Fagaceae Coriariaceae Corynocarpaceae Datiscaceae Cucurbitaceae Rosaceae Elaeagnaceae Rhamnaceae Cannabaceae Ulmaceae Moraceae Urticaceae Fabaceae -I , W \ 17 -2s— Xanthophyllu -22 Heisteria J ~| mJ 51 Santalum 4^ 87~L-43— Thesium Polygalaceae Olacaceae Opiliaceae Santa laceae FIGURE 5. (Continued)
(j) rbcL: rosids (mostly eurosid I) 3 eurosids II Afrostyrax Brexia Hippocratea Plagiopteron Salacia Celastrus Euonymus Stackhousia Parnassia Brugiera 24~ Erythroxylum 18~ Hymenanthera"! 25" Rinorea —' Passiflora Turnera Linum —i Reinwardtia I Irvingia _ _ r | | - Hydnocarpus l-=— Goupia 21 r 4 - Dicella Malpighia Euphorbia Dichapetalum Medusagyne Ochna Huaceae Celastraceae Stackhousiaceae Pamassiaceae _ Rhizophoraceae" Erythroxylaceae Violaceae Passifloraceae Turneraceae Linaceae Irvingiaceae Salicaceae Flacourtiaceae Goupiaceae Malpighiaceae Euphorbiaceae Dichapetalaceae Medusagynaceae Ochnaceae Humiriaceae _ Oxalidaceae Connaraceae Cunoniaceae Tremandraceae Elaeocarpaceae Zygophyllaceae Krameriaceae Betulaceae Casuarinaceae Fagaceae Myricaceae Juglandaceae Coriariaceae Cucurbitaceae Corynocarpaceae Datiscaceae Rosaceae Elaeagnaceae Rhamnaceae Cannabaceae Ulmaceae Moraceae Urticaceae USophora J F a b a c e a e 52_ Polygala ~~| XanthophyllunU Polygalaceae Alvaradoa — 14 Datisca 11 r ~ 1 r Dryas - ] lfp-lS- Spiraea J 4 * r r j - Elaeagnus Rhamnus Humulus Trema 82 l__rtf- Mows Boehmeria Picramnia
I
Picramniaceae FIGURE 5. (Continued)(k) atpB: eurosids II Acer Cupaniopsis Koelreuteria Aesculus Ailanthus Simarouba Swietenia Trichilia Citrus Poncirus Zanthoxylum Bursera Pistacia Rhus Schinus Adansonia Bombax Gossypium Ochroma Chorisia Sterculia Tilia Dombeya
]
1
Theobroma Bixa Diegodendron Cochlospermum. Anisoptera Cistus ~~| Helianthemum _ J Sarcolaena 11 Aquilari? « _ Phaleria .20 Thymelaea 3 6 Muntingia Brassica Stanleya Megacarpea Capparis Reseda Floerkea Carica Tropaeolum Stachyurus Staphylea Clidemia Metrosideros Vochysia 2 1 - Fuchsia Punica Quisqualis Alvaradoa Picramnia Balanites Viscainoa i l _ Guaiacum 27 Krameria 4 8 Geranium —i Pelargonium _ J Bersama Melianthus Francoa1
Sapindaceae Simaroubaceae Meliaceae Rutaceae Burseraceae Anacardiaceae Malvaceae Bixaceae Dipterocarpaceae Cistaceae Sarcolaenaceae Thymelaeaceae Muntingiaceae Brassicaceae Resedaceae Limnanthaceae Caricaceae Tropaeolaceae Stachyuraceae Staphyleaceae Melastomataceae Myrtaceae Vochysiaceae Onagraceae Lythraceae Combretaceae Picramniaceae Zygophyllaceae Krameriaceae Geraniaceae ~ Melianthaceae Francoaceae FIGURE 5. (Continued)(I) rbcL: eurosids II - I2— Aesculus Cupaniopsis Koelreuteria ! i _ Ailanthus i i - Simarouba 29J Cftros Poncirus - I8— Rufa -H— Zanthoxylum •I5— Ptaeroxylon 1ft Svwefenia Trichilia Bursera g— Pistacia Schinus Rhus 21 Megacarpea 1 1 Stanleya Capparis Reseda Floerkea Carica Tropaeolum Ochroma ~* Adansonia Bombax 4 p ^ ^ Dombeya -12— Gossypium Chorisia Sterculia Grewia Theobroma 23 Berrya 21 Aquilaria Phaleria Thymelaea ._±±- Anisoptera -I 1 5 Sarcolaena 12_ C/SfOS Sapindaceae Simaroubaceae Rutaceae Meliaceae Burseraceae Anacardiaceae Brassicaceae Resedaceae Limnanthaceae Caricaceae Tropaeotaceae Malvaceae Thymelaeaceae Dipterocarpaceae Sarcolaenaceae 22_ C/SfOS —1 ^ H 11 Helianthemum \ i 2 _ Muntingia 8 _ s/xa " I 4 Diegodendron Bixaceae Coc/j/ospem?u/nJ Clidemia Qualea Metrosideros 7 i Fuchsia 44— Punica —r~ Quisqualis ~^~ Bersama Melianthus 9 Francoa Cistaceae Muntingiaceae Melastomataceae Vochysiaceae Myrtaceae Onagraceae Lythraceae Combretaceae ~~i —I - — Stachyurus 12 Staphylea Melianthaceae Francoaceae Stachyuraceae Staphyleaceae FIGURE 5. (Continued)
(m) atpB: asterids • euasterids 72 69 96 20 95 81 Euclea Planchonella Ptri Pouteria -^—Manilkara ,_ ——Barringtonia ~l —— Napoleonaea Actinidiaceae Styracaceae Ebenaceae Sapotaceae Lecythidaceae Symplocos Symplocaceae I—5—Adinandra —• " ^ I 5 Puiya 12 Ternstroemia Cobaea •Wrfa 39 11 IUIIB 34 Impatiens 16 Ternstroemiaceae Polemoniaceae Fouquieriaceae 4 | Impatiens Balsaminaceae Tetramerista Tetrameristaceae •Marcgravia Marcgraviaceae Sarracenia Sarraceniaceae Schima """ -—Stuartia ——Clethra Cyril I a Theaceae Clethraceae Cyrillaceae Ericaceae 5 i ~* -^—Erica 8 37 Anagallis - | -2—rr: a Pnmulaceae se i_22—Androsace J 22 Clavija Theophrastaceae Myrsinaceae 74 14 Maesa 12 Alangium 20 Cornaceae 69 1 5 L^5 Corm/S J ww...auCaC 14 5 | Carpenteria ~~| J ^—Hydrangea J "Vdrangeaceae A/yssa Nyssaceae 7Y 14 m FIGURE 5. (Continued)
Asteropeiaceae in Morton et al., 1997; Tamaricaceae, Ancistrocladaceae, and Di-oncophyllaceae in Fay et al., 1997, and Lledo et al., 1998) and require evaluation in using this combined-gene matrix.
Rosids
Within the rosids (61% atpB/rbcl boot-strap support), two major clades are
identi-fied in all shortest trees (neither of which, however, receives support >50%): eurosid I, composed of Celastraceae (including Hip-pocrateaceae plus Huaceae, Parnassiaceae, and Stackhousiaceae), Cucurbitales, Fa-bales, Fagales, Malpighiales, Oxalidales, and Rosales (Figs. 5i,j, 6e); and eurosid II, including Brassicales, Malvales, Myrtales, and Sapindales (Figs. 5k,l, 6f). There are also several clades that cannot be clearly
as-(n) rbcL: asterids
J— euasterids 14 93 95 10 99 12—Actinidia 4 r*—Erica -Sarracema 21—Cyrill a 14 —LJ2—Stuartia r-2B—Adinandra .Eurya 5 6 i_ix cuiya —12 Ternstroemia Symplocos 31 18 23 Styrax yijAnagallis wo L^—Androsace 11 31 Maesa Clavija ——Cobaea 8 r—Diospyros Euclea 93 Planchonella Manilkara i. i iriaimnaii "wi Pouteria _ 25 Barringtonia ~1 14 ~ " POUIIIUWIIIO 3f 11 2 Napoleonaea Jdria 18 99 Idria HL-lmpatiens 52 17 Tetramerista 22—Alangium \^-Cornus 12—Nyssa 10 r^—Carpenteria ~~| 95 ul— Hydrangea I p— Aextoxicon 113 1 — Berberidopsis FIGURE 5. (Continued) Actinidiaceae — Ericaceae Sarraceniaceae Cyrillaceae Theaceae Ternstroem iaceae Symplocaceae Clethraceae Styracaceae Prim u Iaceae Myrsinaceae Theophrastaceae Polemoniaceae Ebenaceae Sapotaceae Lecythidaceae Fouquieriaceae Marcgraviaceae Tetrameristaceae Cornaceae Nyssaceae Hydrangeaceae Aextoxicaceae Berberidopsidaceaesigned to either of these major rosid group-ings: Geraniales (based on the 1993 rbcL tree and unpublished results: Francoaceae, Ge-raniaceae, Melianthaceae, Staphyleaceae, and Stachyuraceae and perhaps Crossoso-mataceae, GeissoloCrossoso-mataceae, Greyiaceae, and Vivianiaceae), Zygophyllaceae/Kra-meriaceae (monophyly supported by boot-strap of 86% in the combined trees), and
Picramniaceae. The placement of Zygo-phyllaceae/Krameriaceae and Picramnia-ceae as members of eurosid I receives <50% bootstrap support in the combined analy-sis. Each of the other orders of the eurosid I clade is supported in the combined analy-sis : Celastraceae / Huaceae / Parnassiaceae / Stackhousiaceae (<50%, <50%, 60% for atpB, rbcL, and combined, respectively),
Cu-(o) atpB: euasterids Borago ~ Hydrophyllum,_ Bouvardia ~t Solanaceae Convolvulaceae Boraginaceae Rubiaceae w w jr «*i«f f w^j 26 _ . . . . . Dischidia Plumeria 28 j — - — Antirrhinum "L-22— Utricularia 12 _ . . . . 2 |—• Buddleja Catalpa Verbena 4 |—-— Lavandula — — Prostanthera •^— Thunbergia Saintpaulia i 5 — Globularia Jasminum Oncotheca -!° Garrya —— Eucommia Pyrenacantha 35 . . Apium Hedera Pittosporum Escallonia Valeriana Sambucus Viburnum Berzelia Campanula 99 I 55 Lobelia — Roussea 39 _ . . . 7 | Cichonum Menyanthes —— Corokia Phelline Gonocaryum Helwingia 11 r^—"ex - , aTlJl—NemopanthusJ Aquifoliaceae _ J Loganiaceae Apocynaceae Scrophulariaceae Lentibulariaceae Buddlejaceae Bignoniaceae Verbenaceae Lamiaceae Acanthaceae Gesneriaceae Scrophulariaceae Oleaceae Oncothecaceae Aucubaceae Garryaceae Eucommiaceae Icacinaceae Apiaceae Araliaceae Pittosporaceae Escalloniaceae Valerianaceae Adoxaceae Bruniaceae Campanulaceae Rousseaceae Asteraceae Menyanthaceae Argophyllaceae Phellinaceae Icacinaceae Helwingiaceae FIGURE 5. (Continued)
(p) rbcL: euasterids teri d 1 2 M n 15 • 64 •a uaste r 3 4 S 52 13 5 98 6 8 94 2 2 7 2 2 2 7 7 95 3 3 8 19 3 2 29 36 6 77 4 2 / 6 55 14 91 10 83 7 75 5 5 5fi 18 23 100