Growth, body composition and hormonal status of growing pigs exhibiting
a normal or small weight at birth and exposed to a neonatal diet enriched
in proteins
Anne Morise
1,2, Bernard Se`ve
1,2, Katherine Mace´
3, Corinne Magliola
3, Isabelle Le Hue¨rou-Luron
1,2and Isabelle Louveau
1,2*
1INRA, UMR1079 Syste`mes d’Elevage Nutrition Animale et Humaine, F-35590 Saint-Gilles, France
2Agrocampus Ouest, UMR1079 Syste`mes d’Elevage Nutrition Animale et Humaine, F-35000 Rennes, France 3Nestle´ Research Center, CH-1000 Lausanne 26, Switzerland
(Received 19 May 2010 – Revised 25 November 2010 – Accepted 26 November 2010 – First published online 28 January 2011)
Abstract
Small birth weight and excess of early protein intake are suspected to enhance later obesity risk. The present study was undertaken to determine the impact of neonatal diets differing in protein content on growth, body composition and hormonal status of 70-d-old pigs born with normal weight (NW) or small weight (SW). At 7 d of age, male and female suckled piglets were assigned to the NW (approxi-mately 1·4 kg at birth) or SW (approxi(approxi-mately 0·99 kg at birth) groups. They were fed milk replacers formulated to provide an adequate protein (AP) or a high protein (HP) supply for 3 weeks. From weaning to 70 d of age, all animals received ad libitum the same standard diet. Growth rates were higher (P, 0·05) in HP piglets than in AP piglets during formula feeding and remained higher (P, 0·05) only in HP male pigs thereafter. No difference in feed consumption was detected between groups during the periods examined. Carcass lipid content and the relative weight of perirenal adipose tissue did not differ between the AP and HP pigs. Whereas plasma leptin concentration was higher (P, 0·05) in HP pigs than in AP pigs with a marked difference in SW pigs, plasma insulin-like growth factor (IGF)-I concentration and expression of IGF system genes were not affected by the diets. In summary, a HP intake during the suckling period induced an increase in growth rate that persisted only in male pigs during the post-weaning period. This response was not associated with any differ-ence in adiposity parameters in this period.
Key words:Insulin-like growth factor system: Leptin: Adipose tissue: Skeletal muscle: Pigs
According to the concept of ‘metabolic programming’, altera-tion of nutrialtera-tion at a critical period of development in early life affects the subsequent pattern of growth and development of tissues and organs and may predispose individuals to meta-bolic disorders in later life(1 – 5). In humans, it is recognised that neonates born with small birth weights exhibit an increased risk of developing these disorders(2,6 – 8). Moreover, these babies are often fed formula enriched in protein to promote catch-up growth and brain development. Based on some observational and epidemiological studies, it has been hypothesised that a high protein (HP) intake during early life may further increase the risk of subsequent obesity(9,10). Some studies have tended to show a positive correlation between dietary protein:energy ratio in early life and BMI and subscapular skinfold in childhood(9,11)and adulthood(12).
But other studies have failed to show such a relationship(13,14), indicating that available data are not entirely clear-cut.
These discrepancies may result from heterogeneity in formula composition (energy-enriched or not, amount of extra protein, etc.), duration of formula feeding and/or inclusion criteria.
The use of animal models reared in well-controlled environments should clarify this issue that is of great interest for nutritionists(15). To date, the impact of an increase in pro-tein intake during the suckling period on subsequent growth and development is poorly documented compared with the impact of protein restriction. Moreover, most of the few avail-able data dealing with early protein intake have been obtained in rodents and are based on the modulation of protein intake of the dam and not of the offspring(16 – 18). The pig is recog-nised as an appropriate model for nutritional research(19,20). This model provides a natural form of intra-uterine growth retardation(21) and allows artificial rearing that is required to
modulate and control food intake during the nursing period. Recently, we have shown that a rise in early protein intake
* Corresponding author: I. Louveau, fax þ 33 2 23 48 50 80, email [email protected]
Abbreviations: AP, adequate protein; HP, high protein; IGF, insulin-like growth factor; NW, normal birth weight; SW, small birth weight.
qThe Authors 2011
British
Journal
of
between 7 and 28 d of age reduced adiposity in piglets(22). According to the hypothesis raised in humans(9,10), protein
intake may induce modifications in regulatory axes and especially in the insulin-like growth factor (IGF) system during infancy and childhood, and these changes may alter subsequent development. Nevertheless, available data on mid- and long-term outcomes are rather limited in the literature. The present study was undertaken to evaluate the adaptation of animals fed such a diet and fed a standard diet thereafter. The phenotype of these animals was examined at 70 d of age through the evaluation of growth, body composition and hormonal status. Finally, we assessed whether the impact of early protein intake may differ between female and male pigs and/or between pigs born with normal or small weight.
Materials and methods
Animals, diets and experimental design
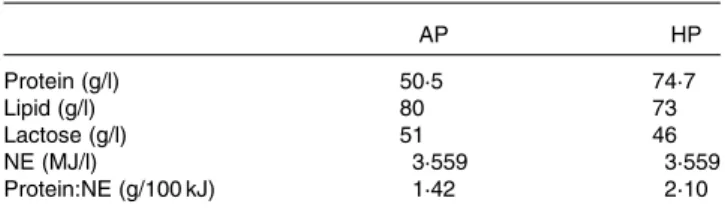
The care and use of animals were performed in compliance with the guidelines of the French Ministry of Agriculture and Fisheries (certificate of authorisation no. 7676 to experiment on living animals). All people involved in the experiment have an agreement for conducting experimental procedures on animals, delivered by the veterinary services. A total of fifty-six cross-bred (Pietrain £ (Large White £ Landrace)) pigs from sixteen litters were obtained from the experimental herd of INRA (St-Gilles, France). All piglets were weighed at birth. Piglets with a weight close to the average birth weight of the herd (1·40 kg) were identified as normal-birth-weight (NW) piglets, and those with a 30 % lower weight were defined as small-birth-weight (SW) piglets. The range of birth weights in the NW group was 1·28 – 1·58 kg, and that in the SW group was 0·76 – 1·12 kg. Piglets were allowed to suckle the dam naturally up to 7 d of age. At this stage, pairs of piglets with similar birth weight and sex were selected within a litter. In theory, we should have selected eight piglets from each litter to equilibrate sex, NW and SW within a litter. However, from a practical point of view, it was impossible. There were from one to three pairs per litter. Within a pair, piglets were randomly assigned to one of the two dietary groups. They were separated from their dam and were placed individually in stainless-steel metabolism cages in a temperature-controlled room (30 ^ 0·58C) up to 28 d of age. They were fed milk replacers formulated to provide an adequate protein (AP) or a HP supply with an automatic for-mula feeder as described previously(22) (Table 1). In brief, the ratio of protein:net energy was 46·5 % higher in the HP powder than in the AP powder. After weaning at 28 d of age, animals from both dietary groups had then free access to standard commercial diets up to slaughter 6 weeks later (Table 2). Body weights were recorded weekly and feed intake was measured daily.
Sample collection
At 70 d of age, pigs were killed 3 h after the last meal in the experimental slaughterhouse by electrical stunning and
exsanguination. Blood samples were collected, and EDTA – plasma samples were stored at 2 208C for later analyses. Half of the carcass (without head and tail) was devoted to chemical composition determination. This part was weighed and stored at 2 208C. In the other half of the carcass, tissue samples were collected within 15 min. The entire semitendino-sus muscle and perirenal adipose tissue were collected and weighed. Samples of dorsal subcutaneous adipose tissue and of longissimus muscle were also collected. These samples were cut into small pieces, frozen in liquid N2 and then
stored at 2 758C.
Chemical analysis
The frozen half-carcass was minced, sampled and freeze-dried for further chemical analyses. All analyses were then per-formed in duplicate on freeze-dried carcass samples according to the Association of Official Analytical Chemists methods(23). The residual water content after freeze-drying was determined on an aliquot sample by drying at þ 1058C to constant weight. All analytical results were expressed on a DM basis. Ash was determined by incineration at þ 5508C. Nitrogen was deter-mined using the rapid nitrogen cube analyser (Elementar, Haunau, Germany). The total content of crude protein was calculated as total carcass nitrogen £ 6·25. Lipid content was determined using the total lipid extraction procedure described by Folch et al.(24).
Hormone assays
All samples were analysed within a single assay. Plasma IGF-I concentrations were determined using a validated RIA(25)that used recombinant IGF-I (GroPep, Adelaı¨de, Australia). The intra-assay CV for a plasma sample with a mean IGF-I concen-tration of 28 ng/ml was 12 %. Plasma leptin concenconcen-trations
Table 2. Composition of standard diets Starter diet (28 – 42 d of age) Piglet diet (42 – 70 d of age) Protein (% DM) 19·5 18·5 Lipids (% DM) 6·6 2·5 Starch (% DM) 25·4 42·9 Minerals (% DM) 7·1 5·5 Crude fibre (% DM) 3·0 3·7 Metabolisable energy (MJ/kg) 14·6 13·5 Net energy (MJ/kg) 10·6 9·6
Table 1. Composition of adequate-protein (AP) or high-protein (HP) formulae AP HP Protein (g/l) 50·5 74·7 Lipid (g/l) 80 73 Lactose (g/l) 51 46 NE (MJ/l) 3·559 3·559 Protein:NE (g/100 kJ) 1·42 2·10
NE, net energy.
British
Journal
of
were measured using the multi-species RIA kit (Linco Research, St Charles, MO, USA) previously validated for use in porcine plasma(26). The intra-assay CV for a porcine plasma sample with a mean leptin concentration of 1·82 ng/ml was 5 %.
Real-time RT-PCR
Total RNA was extracted from adipose tissues and skeletal muscle using TRIzol reagent (Invitrogen, Cergy-Pontoise, France). RNA integrity was then checked on an ethidium bro-mide-stained agarose gel. Treated-DNase total RNA (2 mg) was reverse-transcribed using random hexamer primers. Primers for selected genes (Table 3) were designed using Primer Express software (version 2.0; Applied Biosystems, Courta-boeuf, France). Real-time quantitative PCR analyses were performed in a final volume of 12·5 ml, starting with 5 ng of reverse-transcribed RNA using SYBRw
Green I PCR core reagents in an ABI PRISM 7000 Sequence Detection System instrument (Applied Biosystems). Amplification was performed with forty cycles, with each cycle consisting of denaturation at 958C for 15 s, followed by annealing and extension at 598C for 1 min. Cycle threshold (CT) values are means of triplicate
measurements. Negative controls were included on each ninety-six-well plate. Endogenous 18S ribosomal RNA amplifications were used for each sample to normalise the expression of the selected genes. A complementary DNA
sample obtained from a pool of total RNA isolated from adipose tissues or skeletal muscle was used as an inter-plate calibrator for each gene. Since PCR efficiencies for target genes and 18S gene were close to 1, the relative expression of a target gene was calculated as follows(27):
Ratio ¼ ð22DCTtarget ðsample2calibratorÞÞ=ð22DCT18S ðsample2calibratorÞÞ:
Statistical analysis
Data were analysed using the General Linear Model procedure of SAS (SAS Institute, Cary, NC, USA). The eight groups of pigs were compared. Dietary group (AP and HP), class of birth weight (small and normal), sex (female and male) and the interactions (dietary treatment £ birth weight and dietary treatment £ sex) were tested. Pair within birth weight and sex was also included in the model. All data are presented as means with their standard errors. Differences were con-sidered significant at P# 0·05.
Results
Growth and feed intake
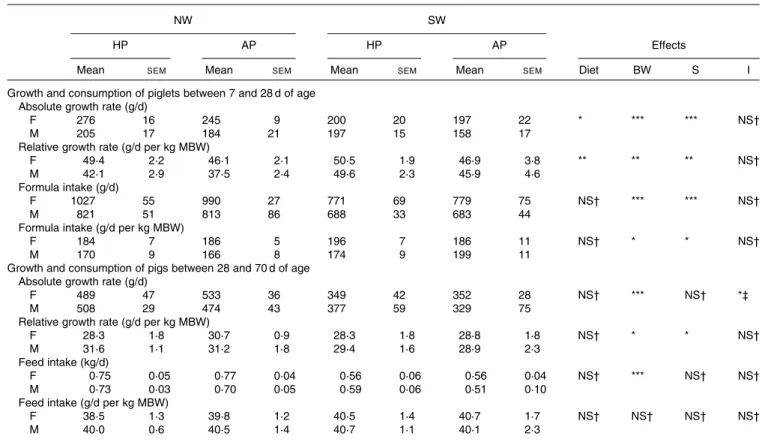
During the formula-feeding period, absolute (weight gain/d) and relative (weight gain/kg mean body weight) growth rates were higher (P, 0·05) in HP piglets than in AP piglets and in female piglets than in male piglets (Tables 4 and 5).
Table 3. Primers used for the analysis of gene expression by real-time RT-PCR
Gene Accession number Forward primer (50! 30) Reverse primer (50! 30)
IGF-I M31175 GCTGGACCTGAGACCCTCTGT TACCCTGTGGGCTTGTTGAAAT
IGF-II X56094 AGGGCATCCAAACCACAAAC GGGTTCAATTTTTGGTATGTAACTTG
IGF-I R U58370 CAACCTCCGGCCTTTTACTTT CAGGAATGTCATCTGCTCCTTCT
Adiponectin AY589691 GCTGTACTACTTCTCCTTCCACATCA CTGGTACTGGTCGTAGGTGAAGAGT
Leptin AF102856 GTTGAAGCCGTGCCCATCT CTGATCCTGGTGACAATCGTCTT
IGF-I and IGF-II, insulin-like growth factor-I and -II; R, receptor.
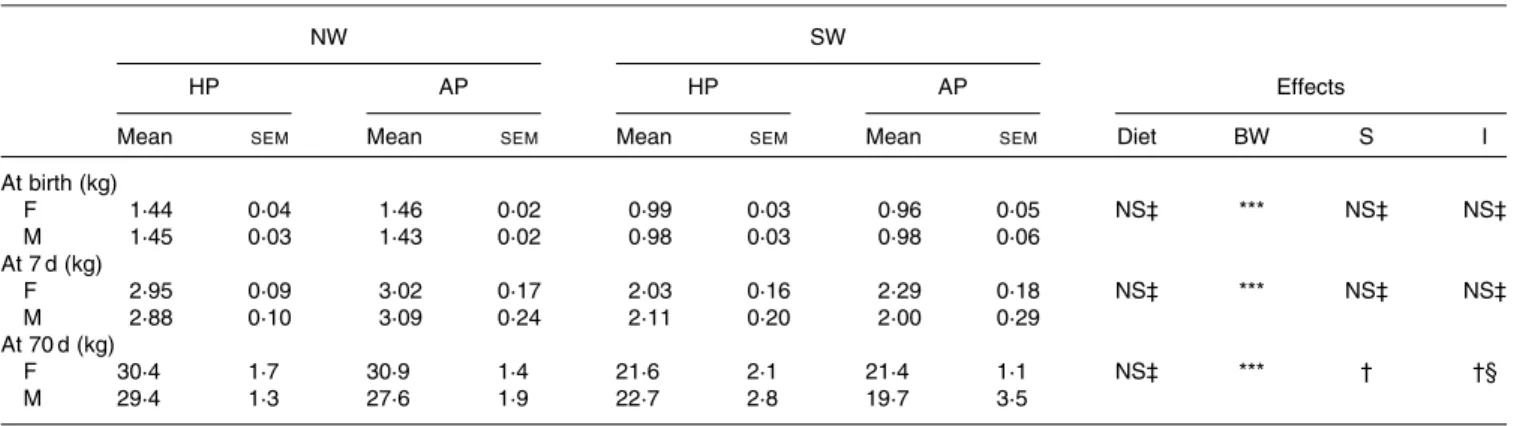
Table 4. Body weights of female (F) and male (M) pigs fed adequate-protein (AP) or high-protein (HP) formulae between 7 and 28 d of age and fed a standard diet thereafter
(Mean values with their standard errors, n 7)
NW SW
HP AP HP AP Effects
Mean SEM Mean SEM Mean SEM Mean SEM Diet BW S I
At birth (kg) F 1·44 0·04 1·46 0·02 0·99 0·03 0·96 0·05 NS‡ *** NS‡ NS‡ M 1·45 0·03 1·43 0·02 0·98 0·03 0·98 0·06 At 7 d (kg) F 2·95 0·09 3·02 0·17 2·03 0·16 2·29 0·18 NS‡ *** NS‡ NS‡ M 2·88 0·10 3·09 0·24 2·11 0·20 2·00 0·29 At 70 d (kg) F 30·4 1·7 30·9 1·4 21·6 2·1 21·4 1·1 NS‡ *** † †§ M 29·4 1·3 27·6 1·9 22·7 2·8 19·7 3·5
NW, normal birth weight; SW, small birth weight; BW, birth weight; S, sex; I, interactions (diet £ S and/or diet £ BW). Mean values were significantly different: **P, 0·1, ***P, 0·001.
† Mean values tended to be significantly different (P, 0·1). ‡ Mean values were not significantly different (P. 0·1). § Diet £ S interaction.
British
Journal
of
With respect to birth weight, the absolute growth rate was higher (P, 0·001) in NW piglets than in SW piglets, while the opposite (P, 0·01) was observed for the relative growth rate. The average formula intake did not differ between the two dietary groups of piglets. The average absolute intake was higher (P, 0·001) in females than in males and in NW pig-lets than in SW pigpig-lets. When expressed per kg mean body weight, formula intake was still higher (P, 0·05) in females than in males but lower (P, 0·05) in NW piglets than in SW piglets.
During the post-weaning period, there was an interaction (P, 0·05) between diet and sex for absolute growth rate (Table 5). This parameter was similar in AP and HP female pigs but was higher (P, 0·05) in male pigs receiving the HP diet than those receiving the AP diet. Moreover, absolute and relative growth rates were higher (P, 0·05) in NW pigs than in SW pigs.
Even though pigs were fed ad libitum, feed intake did not differ between AP and HP pigs. Feed intake was higher (P, 0·001) in NW pigs than in SW pigs, but when expressed per kg mean body weight, there was no significant difference between the birth-weight groups. Moreover, no difference was detected between the sexes.
Body composition and tissue features
The lipid and the protein contents of the carcass were not affected by diet or birth weight but differed (P, 0·05) between female and male pigs (Table 6). Whereas the lipid content was higher in females (P, 0·05) than in males, the protein content was lower (P, 0·01) in females than in males. Mineral content was not influenced by diet or sex but was higher (P, 0·001) in NW pigs than in SW pigs. The relative weight of perirenal adi-pose tissue did not differ between AP- and HP-fed pigs, but it was higher (P, 0·05) in NW pigs than in SW pigs and in female pigs than in male pigs. Similarly, the relative weight of the semitendinosus muscle was not affected by the diet but was higher (P, 0·001) in NW pigs than in SW pigs and in female pigs than in male pigs.
Plasma hormones
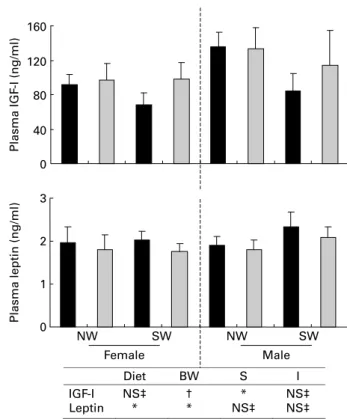
Plasma IGF-I concentrations did not differ between the dietary and birth-weight groups but were lower (P, 0·05) in female pigs than in male pigs (Fig. 1). Plasma leptin concentrations were affected by diet and birth weight (Fig. 1). They were higher (P, 0·05) in HP pigs than in AP pigs. These concen-trations were lower (P, 0·05) in NW pigs than in SW pigs.
Table 5. Growth and consumption of female (F) and male (M) pigs fed adequate-protein (AP) or high-protein (HP) formulae between 7 and 28 d of age and fed a standard diet thereafter
(Mean values with their standard errors, n 7)
NW SW
HP AP HP AP Effects
Mean SEM Mean SEM Mean SEM Mean SEM Diet BW S I
Growth and consumption of piglets between 7 and 28 d of age Absolute growth rate (g/d)
F 276 16 245 9 200 20 197 22 * *** *** NS†
M 205 17 184 21 197 15 158 17
Relative growth rate (g/d per kg MBW)
F 49·4 2·2 46·1 2·1 50·5 1·9 46·9 3·8 ** ** ** NS†
M 42·1 2·9 37·5 2·4 49·6 2·3 45·9 4·6
Formula intake (g/d)
F 1027 55 990 27 771 69 779 75 NS† *** *** NS†
M 821 51 813 86 688 33 683 44
Formula intake (g/d per kg MBW)
F 184 7 186 5 196 7 186 11 NS† * * NS†
M 170 9 166 8 174 9 199 11
Growth and consumption of pigs between 28 and 70 d of age Absolute growth rate (g/d)
F 489 47 533 36 349 42 352 28 NS† *** NS† *‡
M 508 29 474 43 377 59 329 75
Relative growth rate (g/d per kg MBW)
F 28·3 1·8 30·7 0·9 28·3 1·8 28·8 1·8 NS† * * NS†
M 31·6 1·1 31·2 1·8 29·4 1·6 28·9 2·3
Feed intake (kg/d)
F 0·75 0·05 0·77 0·04 0·56 0·06 0·56 0·04 NS† *** NS† NS†
M 0·73 0·03 0·70 0·05 0·59 0·06 0·51 0·10
Feed intake (g/d per kg MBW)
F 38·5 1·3 39·8 1·2 40·5 1·4 40·7 1·7 NS† NS† NS† NS†
M 40·0 0·6 40·5 1·4 40·7 1·1 40·1 2·3
NW, normal birth weight; SW, small birth weight; BW, birth weight; S, sex; I, interactions (diet £ S and/or diet £ BW); MBW, mean birth weight during the experimental period. Mean values were significantly different: *P, 0·05, **P, 0·01, ***P, 0·001.
† Mean values were not significantly different (P. 0·1). ‡ Diet £ S interaction.
British
Journal
of
Expression of genes in adipose tissues and skeletal muscle
In subcutaneous adipose tissue, the relative levels of IGF-I and IGF-II mRNA were not influenced by diet or sex but were lower (P, 0·01) in NW pigs than in SW pigs (Fig. 2). For the relative levels of IGF-I receptor mRNA, there was an inter-action (P, 0·05) between diet and sex. These levels were lower (P, 0·01) in NW pigs than in SW male pigs. In perirenal adipose tissue, the expressions of IGF-I, IGF-II and IGF-I receptor genes were not significantly influenced by diet, sex or birth weight (data not shown). As shown in Fig. 3, there was an interaction (P, 0·05) between diet and sex with respect to the relative levels of leptin mRNA in subcutaneous adipose tissue. Whereas these levels tended (P, 0·1) to be higher in HP pigs than in AP female pigs, they did differ in male pigs. Similar observations were made in perirenal adi-pose tissue (data not shown). The relative levels of adiponec-tin mRNA in subcutaneous and perirenal (data not shown) adipose tissues were not affected by diet or sex, but the levels were lower (P, 0·001) in NW pigs than in SW pigs.
In longissimus muscle (Fig. 2), the expressions of the genes under study were not influenced by diet or sex. With respect to birth weight, slight differences (P, 0·05) were observed for IGF mRNA, with lower levels of IGF-I mRNA in NW pigs than in SW pigs and with higher levels of IGF-II mRNA in NW pigs than in SW pigs.
Discussion
The present study is one of the rare ones documenting the impact of a HP intake exclusively during the suckling period
on subsequent growth, body composition and hormonal status of growing pigs reared in well-controlled conditions. The present findings demonstrate that an increase in early pro-tein intake increased the growth rate during the intervention period in both female and male pigs whatever their birth weights. After weaning, the difference in growth rate persisted only in male pigs. With respect to the regulatory axes, the pre-sent study indicates that plasma leptin concentrations and leptin gene expression in adipose tissues were slightly affected by the diets. Nevertheless, these changes were not associated with any significant difference in adiposity between the two dietary groups at 70 d of age.
The finding of an increase in growth rates in HP piglets whatever their birth weight or sex between 7 and 28 d of age supports the conclusion of Premji et al.(28), suggesting in
a systematic review that higher protein intake from formula accelerates growth of low-birth-weight infants. More recently, it has been reported in a large randomised controlled trial that infants receiving a formula with a higher protein content between 15·5 d (median age) and 12 months of age exhibited a higher growth at the end of the intervention period(29). In contrast, a very recent study indicates that feeding a protein-enriched formula without extra energy for 6 months after term did not affect growth of pre-term infants(30). In rats, body weights of pups receiving 130 % of the normal protein content of rat milk did not differ from those of pups receiving a control diet, whereas those of pups receiving 50 % of the normal protein content were lower in the short term(31). In the post-formula-feeding period, the present findings clearly indicate that early protein intake did not influence the
Table 6. Body composition and tissue features of female (F) and male (M) pigs fed adequate-protein (AP) or high-protein (HP) formulae between 7 and 28 d of age and fed a standard diet thereafter
(Mean values with their standard errors, n 7)
NW SW
HP AP HP AP Effects
Mean SEM Mean SEM Mean SEM Mean SEM Diet BW S
Lipids (% DM) F 32·2 1·0 33·5 0·8 32·6 1·5 34·0 0·9 NS† NS† * M 30·3 0·8 31·5 0·7 31·8 2·5 32·1 2·9 Proteins (% DM) F 54·2 1·1 53·0 0·6 53·3 1·6 52·1 1·2 NS† NS† ** M 56·2 0·7 54·7 1·1 57·3 2·9 55·1 3·0 Minerals (% DM) F 9·4 0·1 8·9 0·2 8·6 0·3 8·5 0·2 NS† *** NS† M 9·0 0·3 9·4 0·2 8·3 0·7 8·2 0·4 Water content (%) F 69 0·5 68 0·3 69 0·8 68 0·7 NS† * *** M 70 0·3 69 0·8 71 1·4 71 1·8 Relative wt (g/kg body wt) Perirenal AT F 3·8 0·2 3·9 0·2 3·4 0·3 3·5 0·2 NS† * ** M 3·2 0·2 3·1 0·3 2·9 0·2 2·8 0·2 Skeletal muscle F 4·5 0·2 4·6 0·2 4·0 0·2 3·7 0·1 NS† *** *** M 3·9 0·1 4·0 0·2 3·7 0·1 3·7 0·2
NW, normal birth weight; SW, small birth weight; BW, birth weight; S, sex; AT, adipose tissue. Mean values were significantly different: *P, 0·05, **P, 0·01, ***P, 0·001.
† Mean values were not significantly different (P. 0·1).
British
Journal
of
subsequent relative growth rate of pigs. In infants(29), the difference in body weights induced by a rise in protein intake persisted in the year following the intervention period. Nevertheless, it should be noted that the reported differences tended to decrease during this period. In rats, no major impact of protein intake could be detected on later body weights(31). Altogether, most of the few available data based on the comparison of early HP intake with AP intake are consistent with growth rate acceleration during the intervention period that does not persist in the post-weaning period.
With respect to adiposity, our observations clearly indicate that the reduction in adiposity that has been reported at the end of the intervention period in our animal model(22) as well as in pre-term infants(30) is not detected at the end of the post-weaning period examined. Indeed, both the carcass lipid content and the perirenal adipose tissue mass were similar in the two dietary groups. This lack of difference in body composition agrees with recent observations in adult rats(31) that have received different protein intakes during
the suckling period. Altogether, these findings indicate that a HP intake in early life reduces adiposity only temporarily. Despite the lack of difference in adiposity of 70-d-old pigs, it cannot be excluded that evaluation of HP pigs for a much longer duration may lead to fatter pigs subsequently.
The evaluation of hormonal factors that have been described to play a role in the processes that link early nutri-tion and later growth may have provided some indicanutri-tions on later tissue development. However, there is no evidence of any effect of this early diet on the IGF system in the period examined. Therefore, these observations do not support the hypothesis that a HP intake may stimulate secretion of IGF-I that may lead to greater adiposity thereafter(9). On the other hand, plasma leptin concentrations and leptin mRNA levels in adipose tissue were found to be slightly affected by the early diet. Whereas plasma leptin concentrations were higher in HP pigs, mRNA levels were not affected by the HP diet in adipose tissue of HP male pigs. Leptin is known to play an important role in the regulation of food intake and energy partitioning, and its plasma concentration is often con-sidered as a good marker of adiposity in adults(32). As pre-viously shown at the end of the intervention period(22), the
present results confirm the lack of relationship between 0 40 80 120 160 NW NW SW Female Male SW Plasma IGF -I (ng/ml) 0 1 2 3 Plasma leptin (ng/ml) Diet BW S I IGF-I NS‡ * † * NS‡ Leptin * NS‡ NS‡
Fig. 1. Plasma insulin-like growth factor-I (IGF-I) and leptin concentrations in pigs fed adequate-protein ( ) or high-protein ( ) formulae between 7 and 28 d of age and fed a standard diet thereafter. Values are means, with their standard errors (n 7) represented by vertical bars. * Mean values were signifi-cantly different (P, 0·05). † Mean values tended to be signifisignifi-cantly different (P, 0·1). ‡ Mean values were not significantly different (P. 0·1). NW, normal birth weight; SW, small birth weight. Diet, BW and S are the effects of diet, birth weight and sex; I are interactions (diet £ S and/or diet £ birth weight).
0 1 2 IGF -II 0 1 2 (a) (b) IGF -I 0 1 2 IGF -IR 0 1 2 0 1 2 0 0·5 1·0 1·5 NW SW NW SW Female Male NW SW NW SW Female Male
Adipose tissue sc Muscle
Diet BW S Diet BW S IGF-I NS‡ *** NS‡ NS‡ * NS‡ NS‡ IGF-II NS‡ ** NS‡ NS‡ NS‡ NS‡ * † NS‡ IGF-IR NS‡ *** † Diet ×S* † NS‡ NS‡ NS‡ I I
Fig. 2. Relative levels of insulin-like growth factor-I (IGF-I), IGF-II, IGF-I receptor mRNA in (a) subcutaneous (sc) adipose tissue and (b) in longissi-mus longissi-muscle in pigs fed adequate-protein ( ) or high-protein ( ) formulae between 7 and 28 d of age and fed a standard diet thereafter. Values are means, with their standard errors (n 7) represented by vertical bars. Mean values were significantly different: *P, 0·05, **P, 0·01, ***P, 0·001. † Mean values tended to be significantly different (P, 0·1). ‡ Mean values were not significantly different (P. 0·1). NW, normal birth weight; SW, small birth weight; R, receptor. Diet, BW and S are the effects of diet, birth weight and sex; I are interactions (diet £ S and/or diet £ birth weight).
British
Journal
of
plasma leptin level and fat mass in young growing animals. Such a lack of a relationship has also been reported in young rats(33). The meaning of the observed changes is not clear. The increase in leptinaemia may result from an increase in leptin production by tissues other than adipose tissue(34). It
could be also hypothesised that this increase may represent an early phase in the development of leptin resistance that may occur in later development(35).
It is possible that the difference in protein intake between the two groups in our investigation as well as in the recent study in rats(31) may not be sufficient to affect subsequent tissue development. However, the hypothesis that an early exposure to a HP intake needs to be associated with other risk factors is more likely. For instance, an early HP intake may need to be associated with a Western-type diet to increase subsequent adiposity. Data based on nutrient restriction corro-borate this hypothesis(36). Another possibility is that the early suckling period may not be so critical for the induction of later obesity in response to a HP intake. Some data in humans further document these points. According to Gu¨nther et al.(37), there was no association between protein intake before 6 months and later adiposity, whereas a HP intake during complementary feeding has been shown to be associ-ated with later adiposity.
The evaluation of the possible interaction between birth weight, sex and early protein intake constitutes another originality of the present study. Even though it is often con-sidered that a HP intake may induce a catch-up growth in low-birth-weight individuals, no significant interaction between early protein intake and birth weight could be ident-ified in our experimental conditions. Despite a higher relative daily weight gain in SW piglets than in NW piglets during the formula-feeding period, the growth retardation persisted in the two dietary groups during the whole period examined.
This agrees with data indicating that pigs exhibiting small weight at birth stay lighter than their counterparts until at least 6 months of age(38 – 41). As suggested previously(42), it is possible that SW pigs cannot exhibit catch-up growth because they may have been undernourished throughout gestation.
With respect to sex, several expected parameters such as adipose tissue mass and plasma IGF-I concentrations differed between female and male pigs(43). Moreover, the finding of interactions between diet and sex suggests that the impact of the diet may be sex-dependent. The HP diet increased both absolute growth rate and weight at 70 d in male pigs but not in female pigs. Altogether, our observations are con-sistent with the statement that male pigs may be more respon-sive to early protein intake than female pigs, at least in term of growth. In rats, studies that have investigated protein intake during lactation and pregnancy indicate that the impact of early nutrition is also sex-specific(18,44,45). As mentioned in these studies, the reason for this sex specificity remains unknown.
Altogether, our data clearly indicate that an exposure to a high-protein diet induced an increase in growth rate during the intervention period. Our current data also support an interaction between diet and sex, with male pigs being more sensitive to the diet but do not support an interaction between diet and birth weight. The findings of similar adiposity in 70-d-old pigs of the two dietary groups suggest that the effects of early protein intake on subsequent body composition may not be as important as those suggested in some epidemiologi-cal studies(9,10). Of course, we cannot exclude that the period
examined was too short to detect a significant effect. It is also possible that an early exposure to a HP intake needs to be associated with a Western-type diet to later increase adipose tissue development.
Acknowledgements
The present study was supported by INRA and Nestec. The authors wish to thank C. Tre´feu for her expert technical assist-ance and M. Alix, J. Liger and J. F. Rouaud for animal slaugh-tering and carcass homogenisation. They also acknowledge A. Chauvin, L. Gaillard, F. Le Gouevec and V. Piedvache for expert assistance with animal care as well as E. Bobillier and G. Savary for the conception, production and maintenance of formula feeders. A. M., B. S., K. M., C. M., I. L. H.-L. and I. L. were responsible for the study design; B. S. and C. M. designed the experimental diets; A. M., B. S., I. L. H.-L. and I. L. conducted the research; A. M. and I. L. analysed data and wrote the manuscript. I. L. and K. M. had primary respon-sibility for the final content. All authors read and approved the final manuscript. There are no conflicts of interest.
References
1. Dauncey MJ (1997) From early nutrition and later develop-ment to underlying mechanisms and optimal health. Br J Nutr 78, S113 – S123. 0 2 4 6 L eptin 0 5 10 15 Adiponectin NW SW NW SW Female Male NW SW NW SW Female Male BW S I Leptin NS‡ † Diet × S* Adiponectin NS‡ NS‡ Diet *** NS‡ Diet × BW†
Fig. 3. Relative levels of leptin and adiponectin mRNA in subcutaneous adi-pose tissue in pigs fed adequate-protein ( ) or high-protein ( ) formulae between 7 and 28 d of age and fed a standard diet thereafter. Values are means, with their standard errors (n 7) represented by vertical bars. Mean values were significantly different (***P, 0·001). † Mean values tended to be significantly different (P, 0·1). ‡ Mean values were not significantly different (P. 0·1). NW, normal birth weight; SW, small birth weight. Diet, BW and S are the effects of diet, birth weight and sex; I are interactions (diet £ S and/or diet £ birth weight).
British
Journal
of
2. Hales CN & Barker DJ (1992) Type 2 (non-insulin-depen-dent) diabetes mellitus: the thrifty phenotype hypothesis. Diabetologia 35, 595 – 601.
3. Lucas A (1998) Programming by early nutrition: an experi-mental approach. J Nutr 128, 401S – 406S.
4. McMillen IC & Robinson JS (2005) Developmental origins of the metabolic syndrome: prediction, plasticity, and program-ming. Physiol Rev 85, 571 – 633.
5. Widdowson EM & McCance RA (1975) A review: new thoughts on growth. Pediatr Res 9, 154 – 156.
6. Godfrey KM & Barker DJ (2000) Fetal nutrition and adult disease. Am J Clin Nutr 71, 1344S – 1352S.
7. Ong KK & Dunger DB (2004) Birth weight, infant growth and insulin resistance. Eur J Endocrinol 151, Suppl. 3, U131 – U139.
8. Saenger P, Czernichow P, Hughes I, et al. (2007) Small for gestational age: short stature and beyond. Endocr Rev 28, 219 – 251.
9. Rolland-Cachera MF, Deheeger M, Akrout M, et al. (1995) Influence of macronutrients on adiposity development: a follow up study of nutrition and growth from 10 months to 8 years of age. Int J Obes Relat Metab Disord 19, 573 – 578. 10. Koletzko B (2006) Long-term consequences of early feeding
on later obesity risk. In Protein and Energy Requirements in Infancy and Childhood, vol. 58, pp. 1 – 18 [J Rigo and EE Ziegler, editors]. Nestle´ Nutr Workshop Ser Pediatr Program. 11. Scaglioni S, Agostoni C, Notaris RD, et al. (2000) Early macronutrient intake and overweight at five years of age. Int J Obes Relat Metab Disord 24, 777 – 781.
12. Kemper HC, Post GB, Twisk JW, et al. (1999) Lifestyle and obesity in adolescence and young adulthood: results from the Amsterdam Growth And Health Longitudinal Study (AGAHLS). Int J Obes Relat Metab Disord 23, Suppl. 3, S34 – S40.
13. Dorosty AR, Emmett PM, Cowin S, et al. (2000) Factors associated with early adiposity rebound. ALSPAC Study Team. Pediatrics 105, 115 – 118.
14. Hoppe C, Molgaard C, Thomsen BL, et al. (2004) Protein intake at 9 mo of age is associated with body size but not with body fat in 10-y-old Danish children. Am J Clin Nutr 79, 494 – 501.
15. Bertram CE & Hanson MA (2001) Animal models and pro-gramming of the metabolic syndrome. Br Med Bull 60, 103 – 121.
16. Daenzer M, Ortmann S, Klaus S, et al. (2002) Prenatal high protein exposure decreases energy expenditure and increases adiposity in young rats. J Nutr 132, 142 – 144. 17. Shepherd PR, Crowther NJ, Desai M, et al. (1997) Altered
adipocyte properties in the offspring of protein malnour-ished rats. Br J Nutr 78, 121 – 129.
18. Zambrano E, Bautista CJ, Dea´s M, et al. (2006) A low maternal protein diet during pregnancy and lactation has sex- and window of exposure-specific effects on offspring growth and food intake, glucose metabolism and serum leptin in the rat. J Physiol 571, 221 – 230.
19. Stahl CH, Lei X & Larson B (2008) Introduction to the sym-posium: appropriate animal models for nutritional research in health and disease. J Nutr 138, 389 – 390.
20. Litten-Brown JC, Corson AM & Clarke L (2010) Porcine models for the metabolic syndrome, digestive and bone disorders: a general overview. Animal 4, 899 – 920. 21. Morise A, Louveau I & Le Hue¨rou-Luron I (2008) Growth and
development of adipose tissue and gut and related endo-crine status during early growth in the pig: impact on low birth weight. Animal 2, 73 – 83.
22. Morise A, Se`ve B, Mace´ K, et al. (2009) Impact of intrauterine growth retardation and early protein intake on growth, adipose tissue and the insulin-like growth factor system in piglets. Pediatr Res 65, 45 – 50.
23. AOAC (1999) Official Methods of Analysis, 16th ed. Gaithers-burg, MD: Association of Official Analytical Chemists. 24. Folch J, Lees M & Sloane Stanley GH (1957) A simple method
for the isolation and purification of total lipides from animal tissues. J Biol Chem 226, 497 – 509.
25. Louveau I & Bonneau M (1996) Effect of a growth hormone infusion on plasma insulin-like growth factor-I in Meishan and large white pigs. Reprod Nutr Dev 36, 301 – 310. 26. Qian H, Barb CR, Compton MM, et al. (1999) Leptin mRNA
expression and serum leptin concentrations as influenced by age, weight, and estradiol in pigs. Domest Anim Endocri-nol 16, 135 – 143.
27. Pfaffl MW (2001) A new mathematical model for relative quantification in real-time RT-PCR. Nucleic Acids Res 29, 2002 – 2007.
28. Premji SS, Fenton T & Sauve RS (2006) Higher versus lower protein intake in formula-fed low birth weight infants. The Cochrane Database of Systematic Reviews 2006, issue 1, CD003959.
29. Koletzko B, von Kries R, Closa R, et al. (2009) Lower protein in infant formula is associated with lower weight up to age 2 y: a randomized clinical trial. Am J Clin Nutr 89, 1836 – 1845.
30. Amesz EM, Schaafsma A, Cranendonk A, et al. (2010) Opti-mal growth and lower fat mass in preterm infants fed a pro-tein-enriched postdischarge formula. J Pediatr Gastroenterol Nutr 50, 200 – 207.
31. Des Robert C, Li N, Caicedo R, et al. (2009) Metabolic effects of different protein intakes after short term undernutrition in artificially reared infant rats. Early Hum Dev 85, 41 – 49. 32. Maffei M, Halaas J, Ravussin E, et al. (1995) Leptin levels in
human and rodent: measurement of plasma leptin and ob RNA in obese and weight-reduced subjects. Nat Med 1, 1155 – 1161.
33. Passos MC, Toste FP, Dutra SC, et al. (2009) Role of neonatal hyperleptinaemia on serum adiponectin and suppressor of cytokine signalling-3 expression in young rats. Br J Nutr 101, 250 – 256.
34. Wang J, Liu R, Hawkins M, et al. (1998) A nutrient-sensing pathway regulates leptin gene expression in muscle and fat. Nature 393, 684 – 688.
35. Attig L, Solomon G, Ferezou J, et al. (2008) Early postnatal leptin blockage leads to a long-term leptin resistance and susceptibility to diet-induced obesity in rats. Int J Obes (Lond) 32, 1153 – 1160.
36. Bieswal F, Ahn MT, Reusens B, et al. (2006) The importance of catch-up growth after early malnutrition for the program-ming of obesity in male rat. Obesity 14, 1330 – 1343. 37. Gu¨nther ALB, Remer T, Kroke A, et al. (2007) Protein intake
during the period of complementary feeding and early child-hood and the association with body mass index and percen-tage body fat at 7 y of age. Am J Clin Nutr 85, 1626 – 1633. 38. Campbell RG & Dunkin AC (1982) The effect of birth weight
on the estimated milk intake, growth and body composition of sow-reared piglets. Anim Prod 35, 193 – 197.
39. Wolter BF, Ellis M, Corrigan BP, et al. (2002) The effect of birth weight on feeding of supplemental milk replacer to piglets during lactation on preweaning and postweaning growth performance and carcass characteristics. J Anim Sci 80, 301 – 308.
40. Poore KR & Fowden AL (2004) The effects of birth weight and postnatal growth patterns on fat depth and plasma
British
Journal
of
leptin concentrations in juvenile and adult pigs. J Physiol 558, 295 – 304.
41. Gondret F, Lefaucheur L, Juin H, et al. (1997) Low birth weight is associated with enlarged muscle fiber area and impaired meat tenderness of the longissimus muscle in pigs. J Anim Sci 84, 93 – 103.
42. Davis TA, Fiorotto ML, Burrin DG, et al. (1997) Intrauterine growth restriction does not alter response of protein syn-thesis to feeding in newborn pigs. Am J Physiol Endocrinol Metab 272, E877 – E884.
43. Louveau I, Bonneau M & Salter DN (1991) Age-related changes in plasma porcine growth hormone (GH) profiles
and insulin-like growth factor-I (IGF-I) concentrations in Large White and Meishan pigs. Reprod Nutr Dev 31, 205 – 216.
44. Sugden MC & Holness MJ (2002) Gender-specific program-ming of insulin secretion and action. J Endocrinol 175, 757 – 767.
45. Thone-Reineke C, Kalk P, Dorn M, et al. (2006) High-protein nutrition during pregnancy and lactation programs blood pressure, food efficiency, and body weight of the offspring in a sex-dependent manner. Am J Physiol Regul Integr Comp Physiol 291, R1025 – R1030.