HAL Id: halshs-00556805
https://halshs.archives-ouvertes.fr/halshs-00556805
Preprint submitted on 17 Jan 2011
HAL is a multi-disciplinary open access
archive for the deposit and dissemination of sci-entific research documents, whether they are pub-lished or not. The documents may come from teaching and research institutions in France or abroad, or from public or private research centers.
L’archive ouverte pluridisciplinaire HAL, est destinée au dépôt et à la diffusion de documents scientifiques de niveau recherche, publiés ou non, émanant des établissements d’enseignement et de recherche français ou étrangers, des laboratoires publics ou privés.
twelve countries
Gbewopo Attila
To cite this version:
Gbewopo Attila. How do African populations perceive corruption: microeconomic evidence from Afrobarometer data in twelve countries. 2011. �halshs-00556805�
1 Document de travail de la série
Etudes et Documents
E 2008.11
How do African populations perceive corruption:
microeconomic evidence from Afrobarometer data in twelve countries
Gbewopo Attila1
CERDI-CNRS, UMR 6587 University of Auvergne, Clermont I
July 2008 ******
1
The author would like to thank the following for helpful comments and suggestions: Stephen Hall, Kaddour Hadri, Sylvain Boko and participants of the 11th annual meeting of African Econometric Society, Dakar July 5-7 2006. He is also grateful to Jean-Louis Combes, Gérard Chambas, Mathilde Maurel, Wladimir Andreff, and François Roubaud. Any errors of omission or interpretations remain the responsibility of the author. Please adress correspondance to : CERDI-CNRS, 65 Bd François Mitterrand, E-mail: [email protected] ; Tel +33 4 73 17 74 41; Fax: +33 4 73 17 74 28.
2 Abstract
In this paper, we examine the microeconomic determinants of the perception of corruption in twelve Sub-Saharan African countries. Unlike the indicators of corruption based on the opinion of international experts, the study focuses on corrupt practices as experienced by the African people themselves. The results of our estimates, using an ordered probit indicate that the individual characteristics such as age and sex significantly affect the perception people have of corruption as do social and political factors like access to information (press, media, radio). However, neither democracy nor participation in demonstrations, seem to affect the attitude of individuals towards corruption.
Keywords: Corruption, Sub-Saharan Africa, Ordered Probit JEL: H11, O12
3 Introduction
Since the early 1980s, the problem of low development in African countries has been primarily attributed to institutional weakness (Hall and Jones, 1999; Acemoglu et al, 2001). It is also well established that corruption slows economic growth or development (Mauro, 1995, 1997; Dreher and Herzfeld, 2005; Gerlagh and Pelligrini, 2004; Brempong, 2002; Gyimah-Brempong and de Camacho, 2006; Minorov, 2005). Some authors talk of a culture of corruption (Le Vine, 1975) and of the complexity of corruption in Africa2 (Blundo and de Sardan, 2001) because it is there systemic and widespread across all sectors (Médard, 1998). Other authors consider that African countries have specific socio-cultural characteristics such as ethnic fractionalization (cf. Easterly and Levine, 1997) or ethnic conflict (cf. Collier and Hoeffler, 2002; Collier, 2003) that negatively affect the process of economic development.
According to existing indicators (Kaufman et al. (World Bank), CPI (Transparency International); ICRG index, etc.), African countries seem to be often ranked as the most corrupt in the world (see table A1 in appendix). However, the various indicators of corruption as assessed by international experts have been criticized (Arndt and Oman, 2006; Kurtz and Schrank, 2007). Thus, the need to take into account the views of local populations becomes paramount. While more than 50% of local people surveyed consider corruption as a major social problems (TI, 2003), there seems to be no correlation between the perception of these populations and the assessment of international experts (Roubaud and Razafindrakoto, 2006).
The aim of the present study is to provide an empirical analysis of microeconomic determinants of the perception of corruption in a sample of African countries. This paper presents three novel features. First, we focus our analysis on a sample of countries where corruption prevails. The populations of these countries are frequently confronted with this problem, and hence their assessment is less likely to be misjudged. By taking into account the expression of personal experience, this approach might succeed in narrowing the gap between expert opinion and that of African people themselves. By avoiding errors of judgment, anti-corruption policies may therefore be much more accurately targeted and effective.
2
4 Second, the econometric analysis conducted here is the first attempt to identify factors that govern perception of corruption in African countries. Methodically, taking into account local people's views requires the identification of individual, social, political and economic factors that shape their behavior vis-à-vis corruption. Notwithstanding the importance of such factors and their impact on corruption, there is a paucity of empirical studies at the micro level. In this perspective, the present study differs from previous works in several aspects. Swamy et al. (2000) focus on the behavior of enterprises and businessmen in Georgia while Svensson et al. (2003) and Svensson (2003) examine the business environment in Uganda. Čábelková (2001) analyzes individual attitudes towards corruption and individual perceptions of individuals of corruption in Ukraine. Mocan (2004) analyzes individual experience of corruption in 49 countries, only 4 of which are African. Our study focuses on the perception of corruption in a sample composed exclusively of (twelve) African countries. In addition, we focus the analysis on microeconomic factors alone while Mocan combines individual factors and factors (political and social) measured at the macroeconomic level. The studies of Reineikka and Svenson (2003, 2005), using an experimental approach in a school-grant program involving in a sample consisting of schools (250 in the 1996 original survey) in Uganda, showed that increased public access to information is an important tool to reduce the capture and misappropriation of public funds allocated to education.
Finally, this study is based on original data from households’ opinion surveys in 12 countries in Sub-Saharan Africa covering up to 16000 individuals over the period 1999-2001. The data allow us to consider many facets of corruption: corruption among civil servants, the extent of bribery in public administration, corruption among elected leaders and the way in which public authorities handle corruption.
The rest of this article is organized as follows. The first section presents the factors that affect the perception of corruption. The second section outlines the empirical methodology in the present study; and the last section discusses the major findings.
5 Section 1- Factors influencing the perception of corruption
Here, we review the individual characteristics and other factors that shape the perception of corruption.
1.1- Individual and social characteristics
(1) Age: The young and elderly feel less concerned by the problems of corruption than the middle age who are employed. Also, their perception of corruption is less precise.
(2) Gender: Gender has received special attention in the analysis of corruption in particular in the policies of deterrence (Swamy et al. 2001; Dollar, Gatti, et al, 2003; Mocan, 2004). Because men and women have different roles in society, they react differently to corruption. More generally, women are considered to have a greater aversion to corruption than men. Men are more frequently targets in the market of corruption for several reasons (Mocan, 2004). The first is that in most countries, especially developing countries, men are more active than women in the labour market. The second is that men are more likely tolerant of dishonest activities (Mocan, 2004; Swamy et al., 2001). In other words, women have a more ethical viewpoint and focus on the interests of the community (Dollar, Gatti, et al, 2003).
(3) Employment and wealth: The relationship between employment and corruption can be established through the profitability of a business (and the benefit gained from corruption) (Čábelková, 2001). Businessmen have more contacts with officials than the rest of the population. The propensity of bureaucrats to demand a bribe is great because they know that potential “victims” have a high enough income level. This is not the case, however, for individuals who are less active in the labour market or are absent from it altogether (Mocan, 2004). The situation is different for farmers. They believe that everything is limited in quantity (cultivable area, harvests, etc.) and taking bribes can be seen as an opportunity for obtaining a greater share of the cake.
6 (4) The place of residence: The decision to corrupt individuals depends on the perception of corruption in the given setting. In large cities, for example, there are more economic opportunities than in small towns. There is therefore a substantial incentive for a businessman to pay bribes to get a large market share in big cities or a monopoly position in small towns. In addition, unlike small towns or villages, cities favour anonymity and thus make it easier for individuals to engage clandestinely in reprehensible activities.
1.2- Other local factors of corruption
Local factors concern other social and political settings that shape individual attitudes towards corruption.
Political characteristics of countries shape individual attitudes. Populations express more freely their opinions on the performance of public administration, political leaders, etc. in democratic countries than autocratic ones.
Publicly available information plays a great role in individuals’ attitude vis-à-vis corruption. Decisions are influenced by two major sources of information (Čábelková, 2001).
(i) Media: The press, radio and television are sources of information exposing the nature and extent of corruption in a country. The revelation of bribery of officials in newspapers, news and documentaries in these media inform people and raise awareness about the state of corruption. Reineikka and Svensson (2003, 2005) showed that increased public access to information is an important tool to reduce capture and corruption in education sector in Uganda.
(ii) Experience: It seems to be the most reliable source. Both personal experience that of relatives or neighbors influence individuals’ choice. Individuals may face explicit requests or flagrant bribes or implicit slowdowns of bureaucratic procedures. In contrast, the individual has the option of offering bribes to speed up procedures. Thus, when people come in contact with a public administration, their perceptions of corrupt practices become more reliable.
7 Section 2- Econometric analysis of determinants of the perception of corruption
2.1- The empirical methodology
The method used in this study is based on a pseudo panel in which we have survey data on individuals from different countries over the same period. The variable of corruption is observed for each individual. The model to estimate corruption takes the form:
* '
ij i ij ij
y =
α
+β
X +ε
(1)with (i, j) representing respectively the country and individual, Xij the vector of determinant of
perception of corruption by individual i from country j . yij* is unobservable. In an opinion survey, respondents express their own feelings toward corruption, which depend on observable factors Xij and certain unobservable factors
ε
, in a such a way that the chosen value yij remainsas close as possible to their own feelings.
The variable of corruption is an ordered variable with four modalities:
* 1 * 1 2 * 2 3 * 4 1 0 (almost all) 2 (most) 3 (some) y = 4 si y µ (almost none) y si y y si y y si y
µ
µ
µ
µ
µ
= < < = < < = < < ≥ (2) 1, 2, 3, 3µ µ µ µ
are unknown parameters to be estimated with the β3coefficients.
3
The probabilities of having the y values are calculated as follows: (Green, 2003) :
1 1 1 1 2 2 1 3 2 4 3 4 Pr(y=0) = Pr( 'X+ < ) = Pr( < - 'X) = F( - 'X) Pr(y=1) = Pr( < 'Xb + < ) = F( - 'X) - F( - 'X) Pr(y=2) = F( - 'X) - F( - 'X) Pr(y=3) = F( - 'X) - F( - 'X) Pr(y=4) = Pr( < 'X+ ) = 1 - F( β ε µ ε µ β µ β µ β ε µ µ β µ β µ β µ β µ β µ β µ β ε 4- 'X)
F() is the the normal distribution function.
8 Our estimation method is the ordered probit with unknown parameters. Such an approach is justified by the fact that corruption data are rankings. The use of ordinary least squares is not appropriate insofar as it treats equally the difference between a 1 and a 2 as that between a 3 and a 4 (Greene, 2003). The probit or logit models would also fail to account for the ordinal nature of the dependent variable.
The interest of pooling data from different countries is to have a maximum of information. In addition, through this approach, we presuppose that behavior is uniform across the different countries studied. However, in order to control for the heterogeneity between countries, we included in the equations country dummy variables.
2.2- Data source
The data used in this analysis from the first round of Afrobarometer households surveys in 12 countries in Africa over the period 1999-20014. Given the ambiguity of the concept of corruption, Afrobarometer uses a narrow definition of corruption: "bribes, gifts or benefits to officers of the government". Moreover, it does not address issues such as favoritism or nepotism. The survey collected the opinions of ordinary citizens, and thus did not target the elite. Finally, in each country, surveys are conducted on a representative sample of the populations.
We selected four variables of corruption in this study:
(i) Corruption among civil servants: how many civil servants, or those who work in government offices and ministries, do you think are involved in corruption
(ii) Extent of corruption/ Bribery: What about corruption? How many officials in the government do you think are involved in corruption?
(iii) Corruption among elected leaders: What about corruption? How many people in the parliament do you think are involved in corruption?
4
9 (iv) Handling corruption: How well would you say the government is handling the following matters?
The definition of the variables of corruption is presented in appendix A2. The explanatory variables are described in appendix A3.
2.3- Descriptive statistics
Tables 1 to 4 present the salient features of these data by country. A quick look at these tables shows that African people have a perception of high corruption in the political and administrative spheres. The interest of such indicators is that the phenomenon of corruption is assessed by those who are face to face with the problem because they are involved either directly or indirectly through various local processes.
2.3.1- Corruption among civil servants
34% of respondents in Zimbabwe consider that almost all civil servants are corrupt. This proportion is close to other countries like Tanzania (28%), Uganda (30%) and Mali (27%). In Zimbabwe, about 66% (34% almost all+ 32% most) of individuals surveyed perceive corruption as a great problem. This corruption pattern holds for the aforementioned countries (Tanzania, Uganda and Mali).
Table 1 : Corruption among civil servants
Country almost all most some almost none don't know refuse to answer Missing Total
Botswana 4.58 26.92 26 11.67 29.17 0.17 1.5 100 Lesotho 9.09 20.82 43.67 3.4 22.6 0 0.42 100 Malawi 12.83 33.11 32.45 4.97 15.73 0 0.91 100 Mali 26.71 32.7 17.57 11.25 11.78 0 0 100 Namibia 3.89 20.54 39.22 15.38 20.46 0 0.51 100 South Africa 14.41 35.64 34.5 3.55 11.91 0 0 100 Tanzania 27.57 34.71 20.47 13.1 4.14 0 0 100 Uganda 29.59 34.96 15.54 9.11 10.22 0.09 0.48 100 Zambie 22.45 27.21 29.05 3.76 16.86 0.17 0.5 100 Zimbabwe 33.75 31.5 15.5 4.33 13.67 0.42 0.83 100 Total 14.82 22.94 19.25 6.16 10.43 0.05 26.35 100
Source: our calculation, based on Afrobarometer data. NB The average proportion of missing data in the overall sample is overvalued by taking into account the countries (Ghana and Nigeria) that did not participate in the investigations:
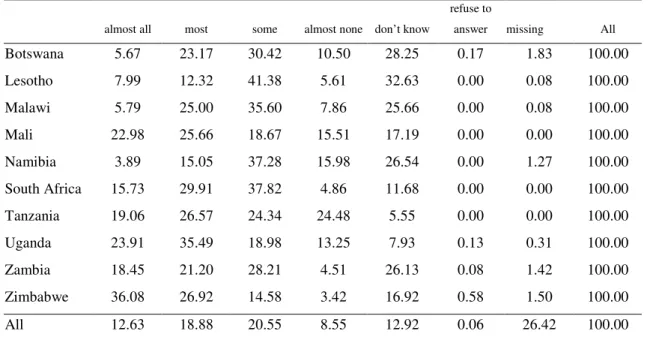
10 2.3.2- Corruption among elected leaders
As might be expected elected officials are not immune to corruption. The proportion of individuals perceiving almost all civil servants as corrupt is 23% in Mali and Uganda and 36% in Zimbabwe. Individuals who work with public administration or are connected to it consider the phenomenon more severely: for the total sample, nine out of ten officials believe that almost all elected leaders are corrupt. The same view is held by two soldiers in three, and by nearly 20% of businessmen, who are accustomed to dealing with elected officials for tenders, public procurement, public works, etc. These results seem to confirm two basic assumptions in the literature. On the one hand political corruption is seen as a serious cause of dysfunctioning, given that most African countries are governed by non-democratic regimes, and on the other hand, the public administration is highly politicized.
Table 2- Corruption among elected leaders
almost all most some almost none don’t know
refuse to
answer missing All Botswana 5.67 23.17 30.42 10.50 28.25 0.17 1.83 100.00 Lesotho 7.99 12.32 41.38 5.61 32.63 0.00 0.08 100.00 Malawi 5.79 25.00 35.60 7.86 25.66 0.00 0.08 100.00 Mali 22.98 25.66 18.67 15.51 17.19 0.00 0.00 100.00 Namibia 3.89 15.05 37.28 15.98 26.54 0.00 1.27 100.00 South Africa 15.73 29.91 37.82 4.86 11.68 0.00 0.00 100.00 Tanzania 19.06 26.57 24.34 24.48 5.55 0.00 0.00 100.00 Uganda 23.91 35.49 18.98 13.25 7.93 0.13 0.31 100.00 Zambia 18.45 21.20 28.21 4.51 26.13 0.08 1.42 100.00 Zimbabwe 36.08 26.92 14.58 3.42 16.92 0.58 1.50 100.00 All 12.63 18.88 20.55 8.55 12.92 0.06 26.42 100.00
Source: our calculation, based on Afrobarometer data. NB The average proportion of missing data in the overall sample is overvalued by taking into account the countries (Ghana and Nigeria) that did not participate in the investigations:
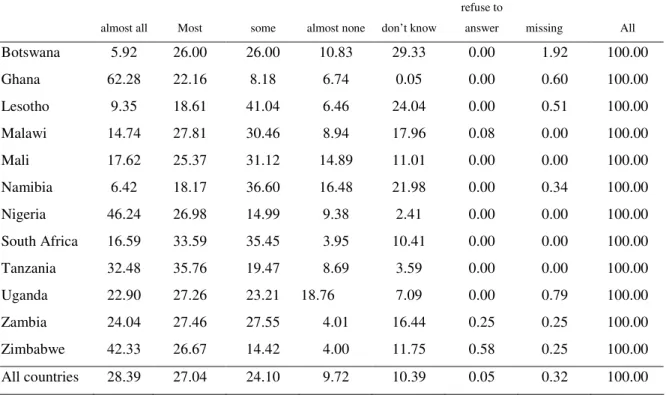
11 2.3.3- Extent of corruption
Corruption is more widespread in two countries in our sample: Ghana and Nigeria. Other countries also experience high levels of corruption. In Ghana, about 62% of respondents believe that almost all officials are involved in corruption against 46% in Nigeria for the same category. Likewise, respectively 32 and 42 in every 100 people in Tanzania and Zimbabwe consider corruption as widespread.
Tableau 3- Extent of corruption (bribery)
almost all Most some almost none don’t know
refuse to
answer missing All Botswana 5.92 26.00 26.00 10.83 29.33 0.00 1.92 100.00 Ghana 62.28 22.16 8.18 6.74 0.05 0.00 0.60 100.00 Lesotho 9.35 18.61 41.04 6.46 24.04 0.00 0.51 100.00 Malawi 14.74 27.81 30.46 8.94 17.96 0.08 0.00 100.00 Mali 17.62 25.37 31.12 14.89 11.01 0.00 0.00 100.00 Namibia 6.42 18.17 36.60 16.48 21.98 0.00 0.34 100.00 Nigeria 46.24 26.98 14.99 9.38 2.41 0.00 0.00 100.00 South Africa 16.59 33.59 35.45 3.95 10.41 0.00 0.00 100.00 Tanzania 32.48 35.76 19.47 8.69 3.59 0.00 0.00 100.00 Uganda 22.90 27.26 23.21 18.76 7.09 0.00 0.79 100.00 Zambia 24.04 27.46 27.55 4.01 16.44 0.25 0.25 100.00 Zimbabwe 42.33 26.67 14.42 4.00 11.75 0.58 0.25 100.00 All countries 28.39 27.04 24.10 9.72 10.39 0.05 0.32 100.00
Source: our calculation, based on Afrobarometer data
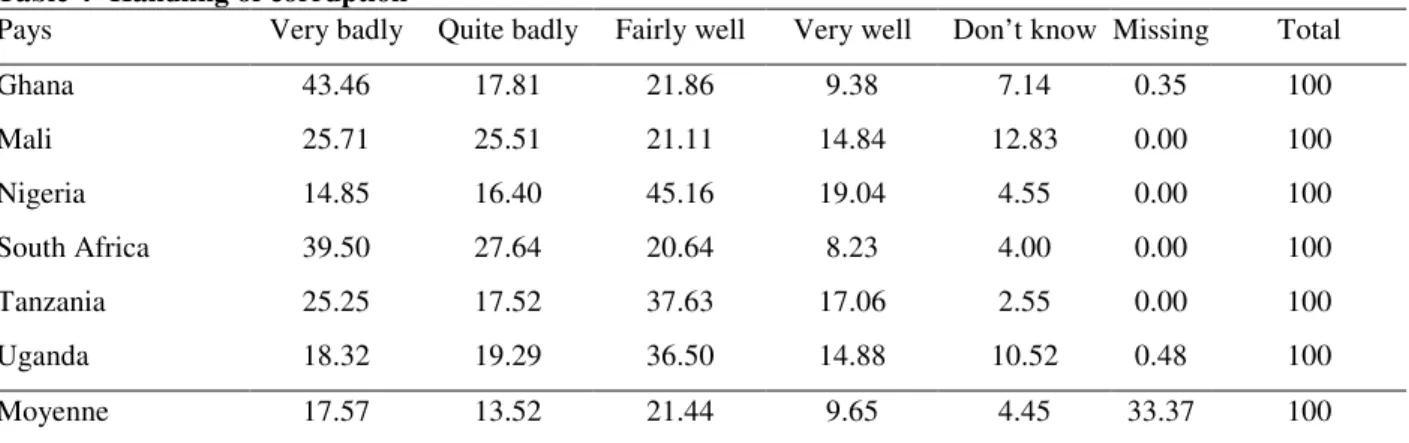
2.3.4- Handling corruption
Two groups could be classified at this level. In the first group, which can be described as "most inefficient", Ghana and South African Republic are at the top. The actions of government in these countries are perceived as inefficient, according to a global assessment by over 33% of the male population as against only 28% of women. Thus, in Ghana nearly 61% of respondents
12 felt that the anti-corruption policy is very poor (Table 4). This view seems to be shared by people in other countries including the South African Republic and Mali where the figure is respectively 67% and 51%. The second category of countries, the "most efficient", includes Nigeria, Tanzania and Uganda with 64%. 55% and 51% of people surveyed who consider public actions have some effectiveness. In all cases, there was no clearcut distinction between urban and rural populations.
Table 4- Handling of corruption
Pays Very badly Quite badly Fairly well Very well Don’t know Missing Total
Ghana 43.46 17.81 21.86 9.38 7.14 0.35 100 Mali 25.71 25.51 21.11 14.84 12.83 0.00 100 Nigeria 14.85 16.40 45.16 19.04 4.55 0.00 100 South Africa 39.50 27.64 20.64 8.23 4.00 0.00 100 Tanzania 25.25 17.52 37.63 17.06 2.55 0.00 100 Uganda 18.32 19.29 36.50 14.88 10.52 0.48 100 Moyenne 17.57 13.52 21.44 9.65 4.45 33.37 100
Source: our calculation, based on Afrobarometer data
Opinion differs according to occupation or employment status. While more than a third of the unemployed, religious leaders and employers rated anti-corruption policy poorly or very poorly, politicians, soldiers and officials had a (very) favorable opinion (48%, 67%, 40% respectively). It is tempting to conclude that officials appreciate the positive actions of the State. In contrast, the police negatively appreciate (24%) the same policy.
13 Section 3- Results and discussion
Before interpreting the results, a few points are worth noting. First, the interpretation of coefficients obtained by the ordered probit model is not straightforward (Greene, 2003). It is also necessary to clarify the direction in which the indicator of corruption varies: a score of 1 on the index indicates a high level of corruption while 4 indicates a low level. As for the variable representing the fight against corruption 4 means that the policies implemented by the authorities are considered very effective. More specifically, a negative sign reflects the likelihood of perceiving a high level of corruption while a positive sign indicates a low perception thereof. The results are presented in Tables 5 and 6.
3.1- Individual characteristics
Our estimates show that the overall impact of individual characteristics on perceptions varies depending on the form of corruption as do the predicted probabilities of perception (see table A4 in appendices). These probabilities also vary depending on the country. Most noteworthy is that the countries of the sample have different predicted probabilities for high levels of corruption. In other words, views are divergent when the level of corruption is high (modalities 1 and 2 in the right side of the graphs in appendix A5). However, when corruption is low the views of people from different countries converge on the perception of the phenomenon (modalities 3 and 4 in the left side of the graphs in appendix A5).
There is a U-shape between age and the perception of corruption. This means that as age increases people have a greater probability of perceiving a high level of corruption among officials. When we look at the evaluation of anti-corruption policy, older people believe that the authorities do not tackle the problem effectively. In both cases, his probability decreases after a certain threshold. This threshold is estimated approximately to be 35 years for the perception of corruption among civil servants and 54-55 years for anti-corruption policy. The higher peoples’ level of education, the higher the probability that they perceive corruption among officials to be a serious problem but to a lesser extent among elected leaders.
14 The results show that gender affects significantly the perception of corruption, in whatever form. Women tend to perceive lesser level of corruption in all spheres of government compared to males. This result is consistent with that of Mocan (2004) but seems to contradict the cross-country result established by Swamy et al. (2001) that women tend to pay less bribes and are more honest than men. Nevertheless, one can explain this seemingly paradox by the fact that men interact more with public administration and hence pay bribes more often.
Regarding the status of employment, it appears that in general those who have a connection with public administration are much more likely to perceive less corruption. This is the case of officials and businessmen. The positive role often attributed to NGOs in the fight against corruption in some African countries is not clearly evidenced in this study. At least with respect to corruption and the fight against it, there is no significant difference between the perception of NGOs workers and that of the rest of populations.
The place of residence has a strong impact on the perception of corruption. In this respect, our results corroborate theoretical predictions (Čábelková, 2001). It is clear from our estimates that those in rural areas have a low perception of corruption. This result is confirmed by the same low perception on the part of farmers. Finally, it is highly likely that the rural poor have a low probability of perception of corruption.
15
Table 5: Microeconomic determinants of extent of corruption and corruption among civil servants
Extent of corruption (bribery) (pfpcr2) Corruption among civil servants(pfpcr4)
(1.2) (2.2) (3.2) (4.2) (1.4) (2.4) (3.4) (4.4) Age -0.005 -0.005 -0.005 -0.005 -0.007* -0.007* -0.007** -0.007** (1.30) (1.29) (1.44) (1.42) (1.90) (1.89) (2.00) (1.98) Age squared 0.000 0.000 0.000 0.000 0.000** 0.000** 0.000** 0.000** (1.16) (1.21) (1.29) (1.33) (2.32) (2.38) (2.41) (2.47) Gender (Female=1) 0.091*** 0.105*** 0.090*** 0.106*** 0.126*** 0.142*** 0.126*** 0.143*** (4.50) (5.22) (4.47) (5.24) (6.32) (7.12) (6.30) (7.12) Rural 0.111*** 0.144*** 0.127*** 0.166*** 0.086*** 0.124*** 0.098*** 0.139*** (4.80) (6.47) (5.54) (7.49) (3.73) (5.43) (4.25) (6.07) Education -0.022 -0.027* -0.024 -0.030* -0.029 -0.038 -0.031 -0.041 (1.56) (1.70) (1.64) (1.78) (1.45) (1.43) (1.47) (1.43) Indicator of poverty 0.172*** 0.179*** 0.122*** 0.130*** (6.13) (6.23) (5.03) (5.20)
General trust in the society 0.016** 0.016** 0.017** 0.018** 0.016 0.017 0.017 0.018
(2.15) (2.18) (2.36) (2.40) (1.37) (1.40) (1.46) (1.50)
Being member of an association -0.085*** -0.091*** -0.075*** -0.082*** -0.076*** -0.087*** -0.069*** -0.080***
(3.76) (4.10) (3.36) (3.69) (3.33) (3.85) (3.04) (3.54)
Participate in a demonstration 0.006 0.011 -0.021 -0.017
(0.26) (0.48) (0.89) (0.72)
Write to the press -0.006 -0.007* -0.006 -0.007* -0.002 -0.003 -0.001 -0.003
(1.48) (1.81) (1.37) (1.71) (0.37) (0.71) (0.31) (0.65) Listen to radio -0.038*** -0.039*** -0.029*** -0.029*** (5.89) (6.04) (4.32) (4.44) Watching TV 0.004* 0.004 0.005** 0.004** (1.70) (1.56) (2.08) (1.96) Reading news -0.035*** -0.039*** -0.038*** -0.040*** (5.89) (6.42) (6.17) (6.47) Access to information -0.224*** -0.235*** -0.150*** -0.158*** (6.94) (7.29) (4.38) (4.60) Democracy 0.000 0.000 0.000 0.000 0.001 0.001 0.001 0.001 (0.44) (0.66) (0.54) (0.78) (1.27) (1.51) (1.34) (1.60)
Trust in the court of appeal 0.077*** 0.077*** 0.079*** 0.079*** 0.083*** 0.083*** 0.084*** 0.085***
(4.22) (4.22) (4.28) (4.28) (7.06) (7.10) (7.08) (7.12)
Unemployed -0.047 -0.033 -0.065 -0.050 -0.024 -0.007 -0.038 -0.020
(0.40) (0.28) (0.56) (0.43) (0.22) (0.06) (0.34) (0.18)
Dummy informal worker -0.044 -0.030 -0.037 -0.021 0.060 0.076* 0.064 0.082**
(1.17) (0.81) (0.98) (0.57) (1.52) (1.92) (1.64) (2.07) Dummy businessman 0.053 0.072 0.060 0.080 0.100 0.118* 0.105 0.124* (0.86) (1.15) (0.96) (1.29) (1.45) (1.69) (1.53) (1.79) Dummy official -0.026 -0.038 -0.025 -0.038 0.219 0.204 0.220 0.204 (0.16) (0.23) (0.15) (0.23) (1.08) (0.99) (1.09) (1.00) Dummy NGO -0.121 -0.110 -0.114 -0.102 -0.015 0.001 -0.010 0.007 (1.15) (1.05) (1.10) (0.98) (0.12) (0.01) (0.08) (0.06) Dummy peasant 0.100 0.088 0.133 0.121 0.166 0.153 0.190 0.178 (0.66) (0.58) (0.87) (0.80) (1.08) (1.00) (1.24) (1.17) Dummy politician -0.355 -0.328 -0.343 -0.313 -0.519* -0.489 -0.511* -0.479 (1.43) (1.31) (1.40) (1.27) (1.74) (1.64) (1.72) (1.60)
Country dummies YES YES YES YES YES YES YES YES
Number of observations 12192 12192 12192 12192 12183 12183 12183 12183
16
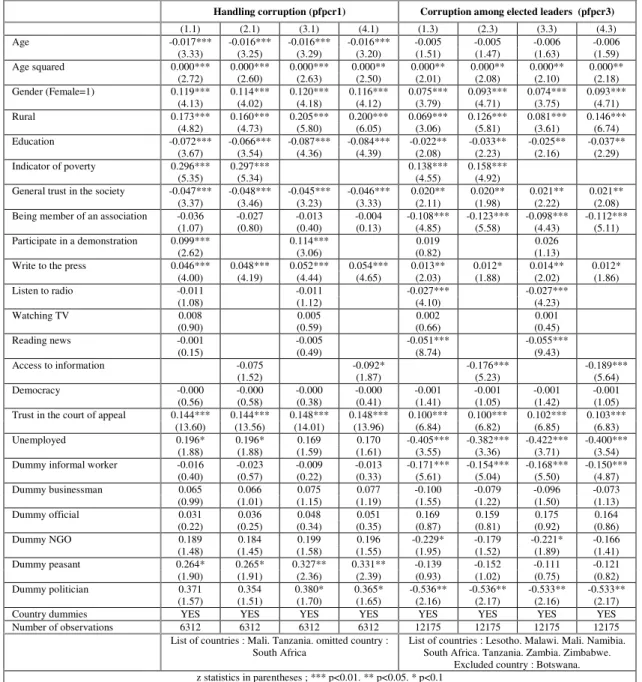
Table 6: Microeconomic determinants of handling of corruption and corruption among elected leaders
Handling corruption (pfpcr1) Corruption among elected leaders (pfpcr3)
(1.1) (2.1) (3.1) (4.1) (1.3) (2.3) (3.3) (4.3) Age -0.017*** -0.016*** -0.016*** -0.016*** -0.005 -0.005 -0.006 -0.006 (3.33) (3.25) (3.29) (3.20) (1.51) (1.47) (1.63) (1.59) Age squared 0.000*** 0.000*** 0.000*** 0.000** 0.000** 0.000** 0.000** 0.000** (2.72) (2.60) (2.63) (2.50) (2.01) (2.08) (2.10) (2.18) Gender (Female=1) 0.119*** 0.114*** 0.120*** 0.116*** 0.075*** 0.093*** 0.074*** 0.093*** (4.13) (4.02) (4.18) (4.12) (3.79) (4.71) (3.75) (4.71) Rural 0.173*** 0.160*** 0.205*** 0.200*** 0.069*** 0.126*** 0.081*** 0.146*** (4.82) (4.73) (5.80) (6.05) (3.06) (5.81) (3.61) (6.74) Education -0.072*** -0.066*** -0.087*** -0.084*** -0.022** -0.033** -0.025** -0.037** (3.67) (3.54) (4.36) (4.39) (2.08) (2.23) (2.16) (2.29) Indicator of poverty 0.296*** 0.297*** 0.138*** 0.158*** (5.35) (5.34) (4.55) (4.92)
General trust in the society -0.047*** -0.048*** -0.045*** -0.046*** 0.020** 0.020** 0.021** 0.021**
(3.37) (3.46) (3.23) (3.33) (2.11) (1.98) (2.22) (2.08)
Being member of an association -0.036 -0.027 -0.013 -0.004 -0.108*** -0.123*** -0.098*** -0.112***
(1.07) (0.80) (0.40) (0.13) (4.85) (5.58) (4.43) (5.11)
Participate in a demonstration 0.099*** 0.114*** 0.019 0.026
(2.62) (3.06) (0.82) (1.13)
Write to the press 0.046*** 0.048*** 0.052*** 0.054*** 0.013** 0.012* 0.014** 0.012*
(4.00) (4.19) (4.44) (4.65) (2.03) (1.88) (2.02) (1.86) Listen to radio -0.011 -0.011 -0.027*** -0.027*** (1.08) (1.12) (4.10) (4.23) Watching TV 0.008 0.005 0.002 0.001 (0.90) (0.59) (0.66) (0.45) Reading news -0.001 -0.005 -0.051*** -0.055*** (0.15) (0.49) (8.74) (9.43) Access to information -0.075 -0.092* -0.176*** -0.189*** (1.52) (1.87) (5.23) (5.64) Democracy -0.000 -0.000 -0.000 -0.000 -0.001 -0.001 -0.001 -0.001 (0.56) (0.58) (0.38) (0.41) (1.41) (1.05) (1.42) (1.05)
Trust in the court of appeal 0.144*** 0.144*** 0.148*** 0.148*** 0.100*** 0.100*** 0.102*** 0.103*** (13.60) (13.56) (14.01) (13.96) (6.84) (6.82) (6.85) (6.83)
Unemployed 0.196* 0.196* 0.169 0.170 -0.405*** -0.382*** -0.422*** -0.400***
(1.88) (1.88) (1.59) (1.61) (3.55) (3.36) (3.71) (3.54)
Dummy informal worker -0.016 -0.023 -0.009 -0.013 -0.171*** -0.154*** -0.168*** -0.150***
(0.40) (0.57) (0.22) (0.33) (5.61) (5.04) (5.50) (4.87) Dummy businessman 0.065 0.066 0.075 0.077 -0.100 -0.079 -0.096 -0.073 (0.99) (1.01) (1.15) (1.19) (1.55) (1.22) (1.50) (1.13) Dummy official 0.031 0.036 0.048 0.051 0.169 0.159 0.175 0.164 (0.22) (0.25) (0.34) (0.35) (0.87) (0.81) (0.92) (0.86) Dummy NGO 0.189 0.184 0.199 0.196 -0.229* -0.179 -0.221* -0.166 (1.48) (1.45) (1.58) (1.55) (1.95) (1.52) (1.89) (1.41) Dummy peasant 0.264* 0.265* 0.327** 0.331** -0.139 -0.152 -0.111 -0.121 (1.90) (1.91) (2.36) (2.39) (0.93) (1.02) (0.75) (0.82) Dummy politician 0.371 0.354 0.380* 0.365* -0.536** -0.536** -0.533** -0.533** (1.57) (1.51) (1.70) (1.65) (2.16) (2.17) (2.16) (2.17)
Country dummies YES YES YES YES YES YES YES YES
Number of observations 6312 6312 6312 6312 12175 12175 12175 12175
List of countries : Mali. Tanzania. omitted country : South Africa
List of countries : Lesotho. Malawi. Mali. Namibia. South Africa. Tanzania. Zambia. Zimbabwe.
Excluded country : Botswana. z statistics in parentheses ; *** p<0.01. ** p<0.05. * p<0.1
17 3.2 Social and political factors
The level of general trust in the society is an important determinant of the perception of corruption. Thus, those who have great confidence in the court of appeal are highly likely to perceive low levels of corruption. However, neither democracy nor participation in demonstrations seem to affect the attitude of individuals towards corruption. This latter result is line with the macroeconomic empirics of corruption. Indeed several studies found no significant effect of democracy on corruption (Paldam, 2002; Treisman, 2000; Rose-Ackerman, 1999; Serra, 2006; Brunetti and Weder, 2003). Surprising though this result may be, other components of democracy such as community life (community meetings, religious associations, development) have a high significance on perception of corruption.
The access to information through the press or listening to radio significantly affects the perception of corruption. This result is consistent with the study of Reineikka and Svensson (2003, 2005), and that of Brunetti and Weder (2002), who, using a cross-country macro-data showed that a free press may have a powerful controlling influence on corruption.
This study confirms that the media are a factor in the fight against corruption. However, some crucial issues should be highlighted in the context of developing countries. First, access to information through the media is limited due to the low level of development of infrastructures and the precarious financial situation of populations. This interaction between poverty and access to information appears in our regressions, where the introduction of the variable of poverty tends to lower the ratio of variable access to information. The same result applies for the low level of literacy. Individuals can certainly share information among themselves, with parents or friends, but access to information remains nonetheless a real challenge. Another problem concerns the controversy of the freedom of expression in the media. The media may be sanctioned and censored at any time. Access to information is therefore a valuable opportunity in the fight against corruption; and it is hoped that over time, institutional and economic maturity can produce positive results.
18 Concluding remarks
This paper examines the phenomenon of corruption in the African context: corruption as defined in the literature seems to be an imported concept. It is therefore necessary to adapt it to the institutional context, taking into account the opinions of local populations.
It attempts to identify microeconomic determinants of the perception of corruption. Econometric investigations indicate that individual characteristics such as age and sex affect significantly the perception people have of corruption as do social and political factors. More specifically, access to information appears to be a valuable tool in combating corruption. The microeconomic determinants that affect the perception of corruption are somewhat different from those found elsewhere, in Latin America (Mocan, 2004) or Eastern Europe (Čábelková, 2001).
A number of factors emerging from this first analysis warrant further investigation. In this paper, we focused only on the perception of corruption. Whether the individuals interviewed tolerate it or are victims of it has not been addressed. Thus, this article may be extended by considering corruption in terms of its acceptability or its effects on individuals (being a victim) in one country.
19 References
Acemoglu, D., S. Johnson and J. A. Robinson (2001), "The colonial origins of comparative development: an empirical investigation", American Economic Review, n°91, pp. 1369-1401.
Arndt, C. and C. Oman (2006), "Uses and Abuses of Governance Indicators", OECD Online Bookshop.
Blundo G. and de Sardan J.P O; (2001); "La corruption au quotidien en Afrique de l'Ouest";
Politique africaine n°83.
Brunetti, A. and B. Weder (2002), "A free press is bad news for corruption", Journal of Public
Economics, vol. 87, no. 7-8, pp.1801-1824.
Cabelkova, Inna; (2001);"Perceptions of Corruption in Ukraine: Are they Correct?"; CERGE-EI Working Paper No. 176.
Collier, P. (2003), "Breaking the Conflict Trap: Civil War and Development Policy", World Bank Publications.
Collier, P. and A. Hoeffler (2002), "On the Incidence of Civil War in Africa", Journal of Conflict
Resolution, vol. 46, no. 1, pp.13.
Dreher, A. et T. Herzfeld (2005). "The Economic Costs of Corruption: A Survey and New Evidence", Mimeo.
Easterly, W. and R. Levine (1997), "Africa’s Growth Tragedy", Quarterly Journal of Economics, vol. 112, no. 4, pp.1203-50.
Gatti, Roberta, Paternostro, Stefano and Rigolini, Jamele; (2003); "Individual Attitudes toward Corruption: Do Social Effects Matter?"; World Bank Policy Research Working Paper No. 3122.World Bank
Gerlagh R. and Pellegrini, L. (2004). "Corruption's Effect on Growth and its Transmission Channels". Kyklos 57(3). pp.429-456.
Green, W. (2003), "Econometric Analysis", New York University.
Gupta, Sanjeev & Davoodi, Hamid & Alonso-Terme, Rosa; (1998); "Does Corruption Affect Income Inequality and Poverty?"; IMF Working Papers 98/76, International Monetary Fund.
Gyimah-Brempong, K. (2002), "Corruption, economic growth and income inequality in Africa",
Economics of Governance, vol. 3, pp.183-209.
Gyimah-Brempong, K. and S. M. De Camacho (2006), "Corruption, Growth, and Income Distribution: Are there Regional Differences?" Economics of Governance, vol. V7, no. 3, pp.245-269.
Hall, E. R. and C. I. Jones (1999), "Why do some countries produce so much more output per worker than others", Quarterly Journal Of Economics, vol. 114, pp.83-116.
20 Kaufmann, D., A. Kraay and M. Mastruzzi (2003), "Governance Matters III: Governance
Indicators for 1996-2002", World Bank Policy Research Working Paper N°3106.
Kurtz, M. J. and A. Schrank (2007), "Growth and Governance: Models, Measures, and Mechanisms", The Journal of Politics, vol. 69, pp.538-554.
LeVine V.; (1975); "Political Corruption: The Ghana Case"; Stanford: Hoover Institution Mauro, P. (1995). “Corruption and Growth”. Quarterly Journal of Economics. 60(3); 681-712. Médard J-F; (1998); "La crise de l'Etat néo-patrimonial et l'évolution de la corruption en
Afrique sub-saharienne";Monde en Développement, Tome 26 - 102 – 55.
Mironov, M. (2005). “Bad Corruption, Good Corruption and Growth”. University of Chicago. Miméo.
Mocan, Naci H; (2004); "What Determines Corruption? International Evidence from Micro Data"; NBER Working Paper No. W10460.
Paldam, M., 2002, The cross-country pattern of corruption: economics, culture and the seesaw dynamics, European Journal of Political Economy, Vol. 18, No. 2.
Reinikka Ritva, , Jakob, Svensson; (2003); Survey techniques to measure and explain corruption. ;The World Bank / Policy Research Working Paper Series.
Rose-Ackerman, S., (1999), Corruption and Government: Causes, Consequences, and Reform, Cambridge University Press.
Svensson, Jakob; (2003); Who must pay bribes and how much?: Evidence from a Cross-Section of Firms; Quarterly Journal of Economics n°118 issue (1) pp.207-30.
Reinikka, R. and J. Svensson (2003), "The Power of Information: Evidence from a Newspaper Campaign to Reduce Capture", World Bank Policy Research Working Paper No. 3239. Reinikka, R. and J. Svensson (2005), "Fighting Corruption to Improve Schooling: Evidence from
a Newspaper Campaign in Uganda", Journal of the European Economic Association, vol. 3, no. 2-3, pp.259-267.
Swamy, An and, V., Lee, Young, Azfar, Omar and Knack, Stephen; (2000); "Gender and Corruption"; IRIS Center Working Paper No. 232.
Transparency International; (2003); "Accès à l'information"; Thème spécial; Rapport mondial
sur la corruption, Karthala.
Treisman, D., 2000, The causes of corruption: a cross-national study, Journal of Public Economics, Vol. 76, No. 3.
21 Appendices
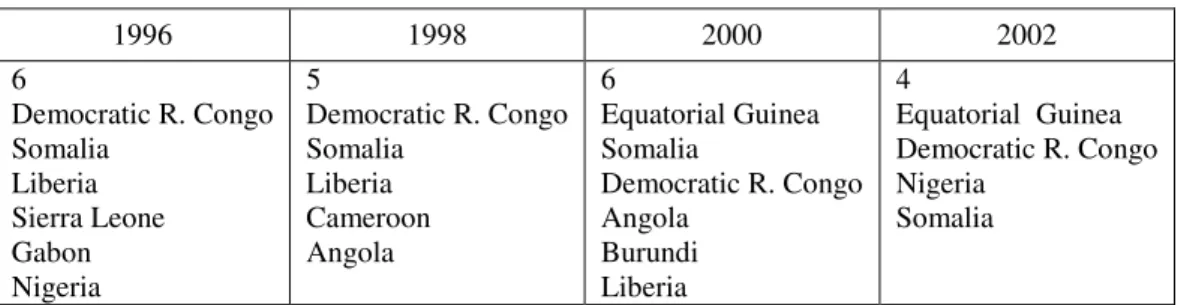
Table A1: Number of African countries in the ten most corrupt countries in the world
1996 1998 2000 2002 6 Democratic R. Congo Somalia Liberia Sierra Leone Gabon Nigeria 5 Democratic R. Congo Somalia Liberia Cameroon Angola 6 Equatorial Guinea Somalia Democratic R. Congo Angola Burundi Liberia 4 Equatorial Guinea Democratic R. Congo Nigeria Somalia
Source: based on KKM (2003) data
Tableau A2- : Definition of the variables of corruption in the Afrobarometer data
Handling corruption
How well would you say the government is handling the following matters?
1=Very badly/Not al all well. 2=Quite badly/Not very well. 3=Fairly well. 4=Very well
Extent of corruption/ Bribery
What about corruption? How many officials in the government do you think are involved in corruption?
1=Almost all; 2=Most; 3=Some; 4=Almost none
Corruption among elected leaders
What about corruption? How many people in the parliament do you think are involved in corruption?
1=Almost all; 2=Most; 3=Some; 4=Almost none
Corruption among civil servants
How many civil servants. or those who work in government offices and ministries do you think are involved in corruption?
22 Appendix A3-Definitions of the other variables
Age Age of the individual (continue)
Sex Female = 1; Male = 0
Rural = 1 if the individual lives in rural areas and 0 in the city
Education Level of education 0 = no formal education 1 = Primary 2 = Secondary 3 = Post-secondary (treated as a continuous variable)
Indicator of poverty = (povfoo + povhth + povinc + povwat + pfeerd + pfenow) / 6
(simple average of indicators of access to food. health care. drinking water. with no income. living conditions. economic situation in the country) 0 = never 1 = rarely 2 = 3 = often forever
Level of general trust 1 = You can have confidence in most people. 2 = You should be careful
Member of an association = 1 if the respondent is a member of a local development association. religion or a business association
Take part in a demonstration if the respondent has participated in a demonstration (community meetings. political demonstrations) 0 = never 1 = once or twice 2 = only a few times 3 = often
Write to the press Write to the press: 0 = never 1 = once or twice 2 = only a few times 3 = often
Listen to the radio (medrad) 0 = never 1 = less than once per month 2 = roughly once a month 3 = roughly once a week 4 = Several times a week 5 = Every day
Watching TV (medtv) 0 = never 1 = less than once a month 2 = roughly once a month 3 = roughly once a week 4 = Several times a week 5 = Every day
Read newspapers (mednew) 0 = never 1 = less than once a month 2 = roughly once a month 3 = roughly once a week 4 = Several times a week 5 = Every day
Access to information 1 if (medrad> = 3 | medtv> = 1 | mednew> = 1) Democracy Meaning of democracy 1 = civil liberties and
individual 2 = vote / electoral choice / competition multiparty
Confidence in the Court of Appeal 1 = not at all 2 = a few times 3 = most of the time 4=always
Unemployed 1 = if the interviewee says that he is unemployed 0 otherwise
informal worker = 1 if the individual works in the informal sector; 0 otherwise
Businessman 1 = if the interviewee is a businessman 0 otherwise Officer 1 = if the respondent is an official 0 otherwise NGOs = 1 if the respondent works in an NGO 0 otherwise Farmer = 1 if the respondent is a farmer 0 otherwise Politician 1 = if the interviewee is a politician 0 otherwise
23
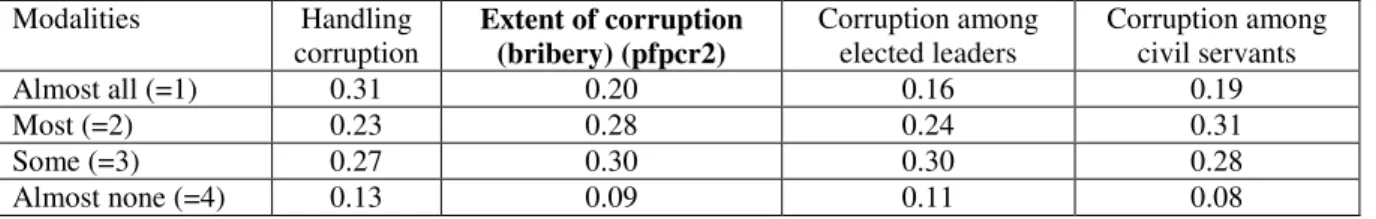
Tableau A4- : Predicted probabilities for modalities of corruption
Modalities Handling corruption Extent of corruption (bribery) (pfpcr2) Corruption among elected leaders Corruption among civil servants Almost all (=1) 0.31 0.20 0.16 0.19 Most (=2) 0.23 0.28 0.24 0.31 Some (=3) 0.27 0.30 0.30 0.28 Almost none (=4) 0.13 0.09 0.11 0.08
Appendix A5- : Predicted probabilities according to corruption modalities in African countries
0 0,05 0,1 0,15 0,2 0,25 0,3 0,35 1 2 3 4
Corruption among elected leaders
0 0,05 0,1 0,15 0,2 0,25 0,3 0,35 1 2 3 4 Extent of corruption 0 0,05 0,1 0,15 0,2 0,25 0,3 0,35 0,4 1 2 3 4