THE DESIGN AND SYNTHESIS OF POLYMERIC ASSEMBLIES FOR MATERIALS APPLICATIONS: CHEMOSENSING, LIQUID CRYSTAL ALIGNMENT AND BLOCK
COPOLYMERS
by
Jason R. Cox
B.S. (with Distinction), Chemistry Worcester Polytechnic Institute, 2005
M.S., Chemistry
Worcester Polytechnic Institute, 2009 Submitted to the Department of Chemistry
in Partial Fulfillment of the Requirements for the Degree of Doctor of Philosophy
at the
Massachusetts Institute of Technology
MASSACHUSETTS INSTnUTE OF TECHNOLOGY
JUN 2 5 2012
LiBRARIES
ARCHIVES
June 2012© Massachusetts Institute of Technology, 2012. All rights reserved.
Signature of Author: Department of Chemistry May 24, 2012 '-I,-
/1"
Certified by: Accepted by(9
Timothy M. Swager Thesis Supervisor Robert W. FieldThis doctoral thesis has been examined by a Committee of the Department of Chemistry as follows:
Professor Stephen L. Buchwald: Thesis Committee Chair
Professor Timothy M. Swager:
Thesis Supervisor
Professor Gregory C. Fu:
THE DESIGN AND SYNTHESIS OF POLYMERIC ASSEMBLIES FOR MATERIALS APPLICATIONS: CHEMOSENSING, LIQUID CRYSTAL ALIGNMENT AND BLOCK
COPOLYMERS by
Jason R. Cox
Submitted to the Department of Chemistry on May 24, 2012 in
Partial Fulfillment of the Requirements for the Degree of Doctor of Philosophy in Chemistry.
ABSTRACT
Conjugated polymers are an indispensable class of materials that have advanced the development
of optoelectronic device architectures; in part, due to their outstanding electronic and mechanical
properties. This thesis explores the utility of rationally designed energy transfer cascades
involving conjugated polymers that can be used in applications such as chemosensing and liquid crystal alignment.
We begin by describing the design and development of a new transduction mechanism for the
detection of cyclic ketones - molecules that are found in plasticized explosives. We discuss the synthesis of a new reporter dye bearing a receptor for cyclic ketones that is capable of undergoing efficient energy transfer with conjugated polymers. We further describe the optimization of a thin-film sensor comprised of these two components as well as its performance
and selectivity.
In the next chapter we describe the design and synthesis of two new polymers that are capable of undergoing the di-a-methane rearrangement. We begin by describing the synthesis and photochemistry of the polymers as well as a model compound. The polymers contain triplet
sensitizers built into the polymer backbone thereby creating an energy transfer cascade that
facilitates the di-a-methane rearrangement. These materials are then evaluated as liquid crystal alignment layers for optoelectronic applications.
In the final chapter, we describe the end-capping of cross-coupling polymerizations using the hydroarylation of norbornadiene. This reaction is shown to be an efficient approach to generating macroinitiators which can be further polymerized using ring opening metathesis polymerization. These end-capped materials can also be crosslinked into hybrid materials that show promise as thin-film sensors for volatile organic compounds.
Dedicated to my girls-Maegan and Norah Faith -for their unwavering support and understanding
TABLE OF CONTENTS Title Page 1 Signature Page 3 Abstract 5 Dedication 6 Table of Contents 7 List of Abbreviations 9 List of Figures 10 List of Schemes 15 List of Tables 17
Chapter 1. Introduction to Electronic Energy Transfer in Conjugated Systems 19
1.1 Introduction 20
1.2 Photophysical Processes of Organic Materials 20
1.3 Mechanisms for Electronic Energy Transfer - FRET and Electron Exchange 22
1.4 Photophysical Processes in Conjugated Polymers 24
1.5 Summary 27
1.6 References 27
Chapter 2. Interrupted Energy Transfer: Highly Selective Detection of Cyclic 30
Ketones in the Vapor Phase
2.1 Introduction and Motivation for Ketone Detection 31
2.2 Proposed Transduction Mechanism 33
2.3 Design Considerations and Synthesis of Emissive Receptor 34 2.4 Optimization of Dye Loading, Energy Transfer Efficiency and Ketone 37
Detection
2.5 Development of a Reversible, Field-portable Detection System Using 43
Interrupted Energy Transfer
2.6 Conclusion 48
2.7 Experimental Section 48
2.8 References 60
Chapter 3. Liquid Crystal Alignment Layers Using an Axis-Selective 62
Di-7r-Methane Rearrangement
3.1 Introduction to Liquid Crystals 63
3.2 The Di-n-Methane Rearrangement 66
3.3 Approach and Design Considerations 67
3.4 Synthesis of Monomers, Model Compounds and Photoalignment Polymers 69
3.5 Photochemistry of Model Compound and Photoalignment Polymer 70
3.6 Alignment of Liquid Crystal Phases using P1. 75
3.7 Conclusion 78
3.9 References
Chapter 4. Norbornadiene End-Capping of Cross-Coupling Polymerizations: 102
A Facile Route to Triblock Polymers
4.1 Introduction 103
4.2 The Hydroarylation of Norbornadiene 105
4.3 Model Reactions 106
4.4 Polymer End-capping 107
4.5 Formation of Triblock Copolymers 110
4.6 Applications of Macroinitiators 112 4.7 Conclusion 114 4.8 Experimental Section 115 4.9 References 136 Curriculum Vitae 138 Acknowledgements 141 100
LIST OF ABBREVIATIONS
AFP amplifying fluorescent polymer
CP conjugated polymer
DART direct analysis in real time
DMF dimethylformamide
DMSO dimethyl sulfoxide
DNT 2,4-dinitrotoluene
EET electronic energy transfer
ET triplet energy
FRET Frster resonance energy transfer
GRIM Grignard metathesis reaction
HOMO highest occupied molecular orbital
HRMS high-resolution mass spectra
IC internal conversion
IMS ion mobility spectrometry
ISC intersystem crossing
kET rate of energy transfer
LCD liquid crystal display
LCM liquid crystal material
LOD limit of detection
LUMO lowest unoccupied molecular orbital
Mn number-average molecular weight
MS mass spectroscopy
NIR near infrared
NMR nuclear magnetic resonance
OLED organic light emitting diode
OPV organic photovoltaics
PDI polydispersity index
PET photoinduced electron transfer
PETN pentaerythritol tetranitrate
POM polarized optical microscopy
QCM
quartz crystal microbalanceRDX 1,3,5-trinitro- 1,3,5-triazacyclohexane
ROMP ring-opening metathesis
SEC size-exclusion chromatography
Tg glass transition temperature
THF tetrahydrofuran
THz-TDS terahertz time domain spectroscopy
TNT 2,4,6-trinitrotoluene
UV ultraviolet
LIST OF FIGURES FROM MAIN TEXT
Figure 1.1 Jablonski diagram depicting the photophysical pathways 21 available to an organic molecule after excitation with a photon.
Photochemical transformations have been omitted; however, in many cases reactivity initiated from the excited state is the dominant pathway.
Figure 1.2 Schematic depiction of electronic energy transfer between a 22 donor and acceptor. Both modes of non-trivial EET are described
-FRET (left) and exchange transfer (right).
Figure 1.3 Schematic depiction of the band gap (Eg) of extended 25 conjugated systems (left) and the relationship between semiconductor
band structure and conjugated polymers (right).
Figure 1.4 Schematic depiction of conformational effects on band gap 26 structure and photophysical properties of conjugated polymers. At the
interface of the light blue and red subunits is a 90 E twist in the polymer chain, this generates two separate chromophoric subunits.
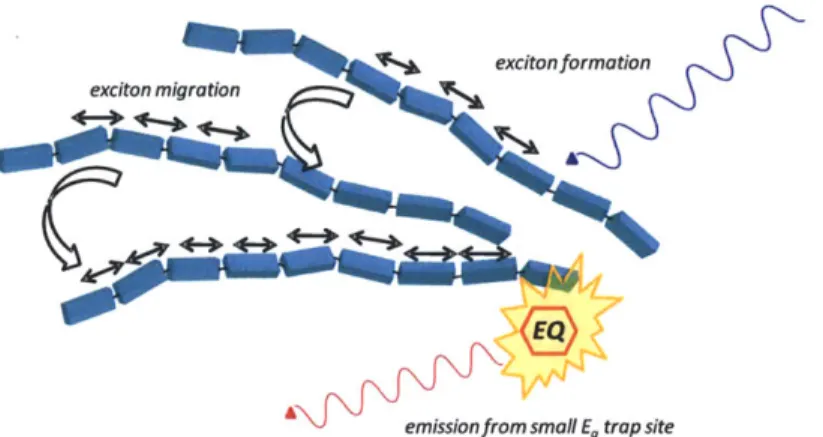
Figure 1.5 Schematic depiction of energy migration to an emissive 27 defect in a CP thin film.
Figure 2.1. Schematic depiction of the proposed transduction mechanism 34 (blue barbed structure = AFP, red structure = NIR-emitting receptor,
green structure = cyclohexanone).
Figure 2.2. Absorbance (solid line) and emission (line with squares) 37 spectra of PPE1 (blue) and SQ1 (red). Spectra were taken in CHCl3,
using the absorbance maximum for each component as the excitation wavelength for emission collection.
Figure 2.3. Plot expressing the relationship between dye-loading (wt%) 38 and energy transfer efficiency. Thin-films containing both components
were excited in a spectral region where only PPE1 absorbs (400 nm) and the ratio of SQ1:PPE1 was compared.
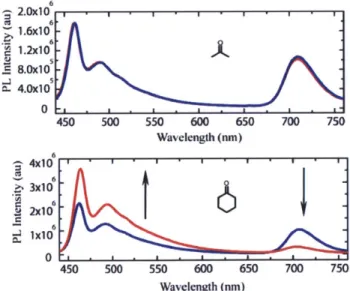
Figure 2.4. Thin-film fluorescence spectra before (blue) and after (red) 38 exposure to the saturated vapor of acetone (top) and cyclohexanone
(bottom) for 30 s (kx = 400 nm).
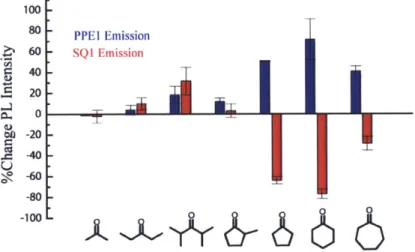
Figure 2.5. Change in thin-film fluorescence intensity of polymer (blue) 39 and squaraine dye (red) after 30 s exposure to the saturated vapor of the
indicated ketone
(
= 400 nm) (mean of three different films).Figure 2.6. Mean frequency shift of a QCM crystal coated with a thin- 40 film of the sensor formulation after 30 s exposure to the saturated vapor
of the indicated ketone (mean of three sequential measurements).
Figure 2.7. Thermal ellipsoid representation of the X-ray structure of 42 SQ1 (1:1 cocrystal with DMF). The displacement ellipsoids are drawn at
the 50% probability level, hydrogen atoms are represented by a sphere of arbitrary radius (gray = carbon, green = fluorine, blue = nitrogen, red =
oxygen, light blue = hydrogen, black dashed lines = hydrogen bonds).
Figure 2.8. Thin-film fluorescence spectra taken in the presence of the 43 saturated vapor of toluene. The black trace represents the first collected
spectrum with red and green traces following at intervals of approximately 30 s (x = 400 nm).
Figure 2.9. Sequential fluorescence spectra of sensor formulation. The 44 film is first exposed to the saturated vapor of cyclohexanone until the
emission of SQ1 is suppressed (top, left). The film is then sparged with a stream of N2 and a subsequent spectrum recorded (top, middle). The
same film is heated to 120 'C for 10 minutes and an additional spectrum recorded (top, right). The resulting film is then re-exposed to the saturated vapor of cyclohexanone (bottom, middle) (Xex = 400 nm).
Figure 2.10. Uncorrected response of FIDO@ to the saturated vapor of 45 acetone (first three reversible peaks) followed by saturated
cyclohexanone vapor (four consecutive exposures). Note the 'staircase' structure of the data indicating that it is an irreversible response.
Figure 2.11. Uncorrected response of FIDO@ to the saturated vapor of 46 cyclohexanone using a plasticized film.
Figure 2.12. Calibration curve showing the response of the sensor system 47 to different concentrations of cyclohexanone vapor (exponential fit).
Inset figure is an expansion of the 0 - 200 ppm concentration range (linear fit).
Figure 2.13. Uncorrected response of the FIDO@ instrument to the 47
headspace of C-4 explosive.
Figure 3.1. Schematic depictions of the structure of liquid crystal 64 mesogens (left) and the nematic phase (right). Small inset (lower left)
displays the molecular structure of 4-cyano-4'pentylbiphenyl (5CB).
Figure 3.2. Schematic depictions of unaligned (left) and aligned (right) 64 nematic liquid crystalline phases. The rod-like structure represents a
liquid crystal mesogen such as 5CB. The black arrow on the right side represents the molecular director.
Figure 3.3. Various photochemical transformations that are applied in 65 photoalignment mechanisms.
Figure 3.4. Overall transformation and mechanism of the di-i-methane 66 rearrangement (top). Implications of the multiplicity of the di-n-methane
rearrangement (bottom).
Figure 3.5. Molecular structure of P1 and the resulting photoproduct of 67 the di-n-methane rearrangement.
Figure 3.6. Schematic depiction of the proposed photoalignment 68 mechanism using the di-7c-methane rearrangement. Red (green) structures
represent P1 before (after) photolysis. Blue structures represent LC molecules.
Figure 3.7. Stacked 'H NMR spectra obtained during photolysis of 5. 72
Figure 3.8. Stacked 1H NMR spectra obtained during photolysis of P1. 73
Figure 3.9. Stacked 1H NMR spectra obtained during photolysis of P2. 74
Figure 3.10. Fluorescence spectra of model compound 5 (left), P1 and 75 P2 (right). Spectra were taken in dichloromethane solution using x =
300 nm with O.D. of 0.1 for all components.
Figure 3.11. Schematic depiction of LC cell fabrication using 76 photoalignment polymer P2.
Figure 3.12. Optical micrographs of LC cells where the photopolymer 77 P1 has not been irradiated (top) or has been irradiated with polarized
Figure 3.13. Optical micrographs of LC cells where the photopolymer 78 P1 has been irradiated through a polarizer and striped photomask.
Irradiation was carried out for 10 minutes in air (LC = MLC 6884). The alternating stripes correspond to features of 100 pm. Black arrows correspond to the orientation of the polarizers.
Figure 4.1. Crude 2H NMR spectrum (bottom) (CH
2Cl2) of the indicated 107
transformation (top). Spectrum was taken after the removal of volatiles from the reaction mixture.
Figure 4.2. 'H NMR spectrum of P2. Included is the molecular structure 109 of P2 with the appropriate protons highlighted. The inset is a magnified
portion of the spectrum.
Figure 4.3. (a) Synthesis of PNB-b-P1-b-PNB. (b) THF SEC (UV 110
detection 450 nm) traces of P1 (black) and PNB-b-P1-b-PNB triblock copolymer (blue).
Figure 4.4. (a) Optical micrographs of PNB cross-linked with P1 in 113 unstretched (left) and stretched (right) states. (b) Optical micrographs
with 365 nm excitation light of the same material in unstretched (left) and stretched (right) states.
Figure 4.5. (a) Photoluminescence spectra of PNB cross-linked with P2 114 in water (red) and 1% THF/water (v:v) (black). (b) Optical micrograph
(UV excitation at 365 nm) showing PNB cross-linked with P2 in water (right) and 1% THF/water (v:v; left). (c) Photoluminescence intensity decay (monitored at 450 nm) of the same film after exposure to the saturated vapor of THF.
LIST OF SCHEMES FROM MAIN TEXT Scheme 2.1. Synthetic route to emissive receptor SQ1.
Scheme 2.2. Molecular structure of PPE1.
Scheme 3.1. Synthesis of model compound 5.
Scheme 3.2. Synthesis of comonomers 6 and 7.
Scheme 3.3. Synthesis of photoalignment polymers P1 and P2.
Scheme 3.4. Regiochemical possibilities during photolysis of model compound 5.
Scheme 4.1. Molecular structures of common conjugated polymers (top). Palladium catalyzed reactions that are employed in the synthesis of conjugated materials (bottom).
Scheme 4.2. Post-polymerization end-capping of PT using the Vilsmeier reaction.
Scheme 4.3. Proposed catalytic cycle for the hydroarylation reaction (top). Ring strain energies associated with norbornane derivatives (bottom).
Scheme 4.4. Conditions and yields for the formation of model compounds MC1, MC2, and MC3.
Scheme 4.5. Conditions used for the end-capping of cross-coupling polymerizations (top) and the resulting end-capped polymers synthesized
35 36 69 70 70 72 103 104 105 106 108
in this work (bottom).
Scheme 4.6. Conditions and monomers used for the formation of triblock 111 copolymers.
LIST OF TABLES FROM MAIN TEXT
Table 2.1. Names, molecular structures and equilibrium vapor pressures of explosives and related compounds.
Table 4.1. Selected results of triblock copolymerizations.
31
Chapter 1
Introduction to Electronic Energy Transfer
1.1 Introduction
In 1953, Hermann Staudinger received the Nobel Prize for his role in the development of macromolecular chemistry, a field that was surprisingly underdeveloped despite the ubiquity of polymers in naturally occurring systems. During his lecture he stated, "I sincerely hope that this great distinction will be the means whereby macromolecular chemistry will undergo further fruitful development."2 This wish was undoubtedly fulfilled as exemplified by the impact of
polymeric materials in every aspect of human life.3 A second Nobel Prize was awarded to Alan J.
Heeger, Alan G. MacDiarmid, and Hideki Shirakawa in 2000 for their pioneering work with conductive (conjugated) polymers whereby a new sub-field of macromolecular chemistry was born.4 Conjugated polymers; that is, polymeric materials that contain alternating single and
multiple bonds, occupy a venerable role in device architectures as they combine the optoelectronic properties of semiconductors with the mechanical properties of organic polymers.5 These materials are readily synthesized using standard carbon-carbon bond forming techniques and are typically soluble materials that can be processed into thin-films over large areas.6 Initially, these materials found utility in devices such as organic light emitting diodes (OLEDs) due to their excellent luminescent properties and have since matured into materials for organic photovoltaics (OPV) and sensing applications. The latter two applications take advantage of the electronic and photophysical properties of conjugated polymers, namely exciton migration, which will be described in the following sections.
1.2 Photophysical Processes of Organic Materials
In order to fully understand the photophysical properties of conjugated polymers, it is first necessary to understand the various transitions that are available to organic molecules when they interact with electromagnetic radiation. The different transitions are best explained with the
aid of a Jablonski diagram (Figure 1.1). The generation of an excited stated is a direct result of the interaction of electrons in the highest occupied molecular orbital (HOMO) with the oscillating electric and magnetic fields of a photon. The oscillating electric field couples with the electron and if certain energetic (band gap) and geometric (field is oscillating in the same direction as the transition dipole moment) considerations are met, the electron will be promoted to the lowest unoccupied molecular orbital (LUMO) or higher unoccupied orbitals.8
S. I
Energy
Figure 1.1 Jablonski diagram depicting the photophysical pathways available to an organic molecule after excitation with a photon. Photochemical transformations have been omitted; however, in many cases reactivity initiated from the excited state is the dominant pathway.
After excitation, the molecule will rapidly relax to the lowest vibrational level of the first excited singlet state in a process known as internal conversion (IC). From here, a number of pathways are possible including fluorescence, non-radiative decay, intersystem crossing (ISC) and phosphorescence.9 An additional deactivation process is called electronic energy transfer
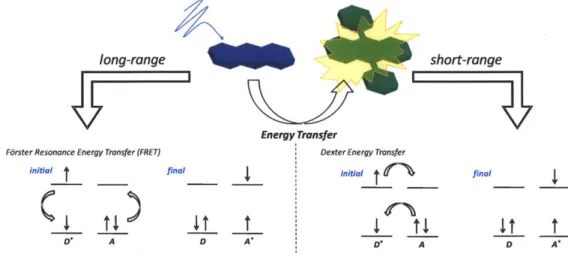
nearby molecule (acceptor) (Figure 1.2). There are two possible mechanisms for energy transfer
- F6rster resonance energy transfer (FRET)' 0 and Dexter energy transfer.'
long-range short-range
Energy Transfer
Forster Resonance Energy Transfer (FRET) Dexter Energy Transfer
initial final initial final
_ _I_ _ t I I i
D* A D A* A D A*
Figure 1.2 Schematic depiction of electronic energy transfer between a donor and acceptor. Both modes of non-trivial EET are described - FRET (left) and exchange transfer (right).
1.3 Mechanisms for Electronic Energy Transfer - FRET and Electron Exchange
The excited state of an organic chromphore is itself an oscillating dipole; as such, it is capable of inducing a resonant interaction with nearby molecules whereby the excitation energy
is transferred from the donor molecule to the acceptor molecule (Figure 1.2 left). This type of energy transfer is known as FRET and is the dominant form of energy transfer between organic compounds.'2 It is not to be confused with trivial modes of energy transfer whereby the emission
of a photon from a donor chromophore is reabsorbed by an acceptor molecule followed by emission. In the case of FRET, the transfer process results in a diminished lifetime of the donor which would not be observed in the trivial case. The rate of energy transfer (kET) is described by Equations 1-3 where TD is the lifetime of the donor, Ro is the F6rster radius, R is the distance between donor and acceptor molecules, K2 is an orientation factor, FD(A) describes the
normalized fluorescence intensity of the donor, sA(A) represents the molar extinction coefficient of the acceptor, and J is the spectral overlap integral.
kET TD R (1)
RO6 = 90001n10 K2 "QD (2)
12875NA n4
J=
FDA A A A Z4 d (3)These equations describe a system in which the efficiency of EET is directly proportional to the spectral overlap integral and inversely proportional to R6. These predictable dependencies have made FRET an indispensable analytical tool for measuring sub-nanometer intermolecular
separations.
The exchange, or Dexter mechanism, describes a situation where the donor and acceptor molecules formally exchange electrons (Figure 1.2 right). This implies that the two components exist at intermolecular separations small enough to permit overlap of the involved orbitals. The rate constant for the exchange mechanism is described by Equation 4 where K describes specific orbital interactions, J' is the normalized spectral overlap integral, R is the intermolecular separation between donor and acceptor, and L is the sum of the van der Waals radii.
kET = KJ'exp(- 2) (4)
Implicit in this description is the steep dependency of kET on the intermolecular
separation of donor and acceptor. The exponential drop-off in exchange efficiency with increasing separation results in a process that can only occur over distances of 1 or 2 molecular diameters - a point that is central to the work described here.
It is worth summarizing the key differences between these two forms of EET: (i) the efficiency of energy transfer is dependent on the oscillator strength for the transitions D*-+D and
A--A* in the case of F6rster energy transfer unlike the exchange mechanism, (ii) the distance dependence for Dexter energy transfer (exp(-2R/L) is much stronger than for FRET (1/R6) and (iii) only for exchange interactions are triplet states allowed to transfer. The first difference highlights an important distinction between the two mechanisms - the spectral overlap integral for the exchange mechanism is not dependent on the intensity of the overlapping transitions. Conversely, the F5rster mechanism is strongly dependent on the oscillator strength of the A--A * transition.
1.4 Photophysical Processes in Conjugated Polymers
In many ways, the processes that have been described for small organic molecules thus far also pertain to larger systems such as conjugated polymers (CPs). Events such as absorption/emission of a photon, internal conversion, intersystem crossing and energy transfer have all been observed with CPs.13 However, there are some subtle differences between these two classes of materials that are a result of the extended conjugation in such systems.
As shown in Figure 1.3, the sequential addition of unsaturated centers results in a narrowing of the band gap (Eg) until the electronic system more closely resembles an inorganic semiconductor possessing valence and conduction bands.14 Absorption of a photon generates a strongly bound electron-hole pair (exciton) that is capable of diffusing along the polymer backbone as well as hopping from one polymer chain to another.15 The diffusion length of an exciton, ranging from 5 to 14 nm,16 means that a single excitation can sample many different polymer subunits prior to a photophysical process taking place. In Figure 1.3 (right) we have illustrated a process where the exciton is quenched by two sequential electron transfer events with an analyte - a process known as photoinduced electron transfer (PET). It is important to note that the diffuse nature of the exciton increases sensory gain as a single analyte molecule is
capable of quenching an entire polymer chain.7 The Swager group has devised a number of sensing applications that exploit this characteristic including a system that boasts the highest sensitivity for the detection of trinitrotoluene (TNT) vapor.17
Energy
HOMO 1
Increasing conjugation
Figure 1.3 Schematic depiction of systems (left) and the relationship conjugated polymers (right).
the band gap (Eg) of extended conjugated between semiconductor band structure and
In addition, the Swager group has shown that exciton migration is greatly increased when the polymer molecules are aggregated.'8 The condensed nature of an aggregated system gives rise to decreased interpolymer separations thereby facilitating multidimensional exciton transport. Figure 1.3 depicts an idealized situation that assumes the polymer subunits are coplanar thus enforcing the band gap perturbations that result from extended conjugation. In practice, polymer molecules are typically coiled or aggregated to some degree, especially high molecular weight materials. The result is that there is a collection of chromophores within each polymer strand that differ in effective conjugation length and hence band gap. This point is
emission exciton migration
excitonformation
longer effective conjugation length smaller Eg
Figure 1.4 Schematic depiction of conformational effects on band gap structure and photophysical properties of conjugated polymers. At the interface of the light blue and red subunits is a 90 E twist in the polymer chain, this generates two separate chromophoric subunits.
As shown in Figure 1.4, initial excitation of a smaller (larger band gap) conjugated subunit generates an exciton that rapidly diffuses to the lower energy (smaller band gap) subunit and then radiatively decays to the ground state. This exemplifies why conjugated polymers often exhibit broad structureless absorbance spectra yet also exhibit well structured emission spectra. This seemingly paradoxical situation arises from the fact that a coiled.CP chain possesses a variety of different chromophoric subunits - each with a different bad gap that can absorb a photon - while the emission spectra is controlled by exciton diffusion to the smallest band gap subunit in the chain.
Thus far we have described situations where an analyte may quench CP emission as well as how excitons will diffuse to and emit from small band gap subunits; however, we have not described the situation where a small band gap analyte acts as an emissive quencher. If we consider the fact that excitons readily diffuse to small band gap defects in CP chains then we would expect that amplified emission from an emissive quencher doped into a CP film should also occur. Indeed, the Swager group has shown that covalently attached emissive defects will emit strongly when the CP is excited19 as well as films that have been doped with small molecule
funnels excitons to the small band gap traps and actually amplifies their emission via energy transfer (Figure 1.5).
excitonformation exciton migration
A emission from small E, trap site
Figure 1.5 Schematic depiction of energy migration to an emissive defect in a CP thin film.
1.5 Summary
In summary, the photphysical processes available to the excited states of organic molecules and conjugated polymers have been described. Behavioral distinctions between the two classes of materials are governed by excition diffusion and energy transfer processes. This brief introduction highlights the essential characteristics of electronic energy transfer in order to be described in subsequent chapters including the detection of ketone molecules in the vapor phase (Chapter 2), alignment of liquid crystalline materials (Chapter 3) and the photophysical properties of crosslinked CP materials (Chapter 4).
1.6 References
(1) (a) Staudinger, H. Ber. Deut. Chem. Ges. 1920, 53, 1073. (b) Staudinger, H. Chem. Ztg. 1953, 77, 679.
Amsterdam, 1964.
(3) Polymers exhibit a wide range of properties that can be tuned for a given application ranging from high-strength materials to biopolymers. From elastomers to polyamides and conjugated polymers, polymer science has advanced nearly every scientific discipline.
(4) (a) Shirakawa, H.; Louis, E. J.; MacDiarmid, A. G.; Chiang, C. K.; Heeger, A. J. J. Chem.
Soc. Chem. Commun. 1977, 578. (b) Shirakawa, H. Angew. Chem. Int. Ed. 2001, 40, 2575. (c)
MacDiarmid, A. G. Angew. Chem. Int. Ed. 2001, 40, 2581. (d) Heeger, A. J. Angew. Chem. Int.
Ed. 2001, 40, 2591.
(5) (a) Conjugated Polymers: The Novel Science and Technology of Highly Conducting and
Nonlinear Optically Active Materials; Bredas, J.-L.; Silbey, R. J., Eds.; KluwerAcademic Publishers: Boston, 1991. (b) Conjugated Conducting Polymers; Kiess, H. G.; Baeriswyl, D., Eds.; Springer-Verlag: New York, 1992. (c) Barashkov, N. N.; Gunder, 0. A. Fluorescent Polymers; Ellis Horwood: NewYork, 1993. (d) Conjugated Polymers and Related Materials: The Interconnection of Chemical and Electronic Structure; Salaneck, W. R.; Lundstr6m, I.; Rdnby, B. G., Eds.;Oxford University Press: New York, 1993. (e) Advances in Synthetic Metals: Twenty Years of Progress in Science and Technology; Bernier, P.; Lefrant, S.; Bidan, G., Eds.; Elsevier: New York, 1999. (f) Roth, S.; Carroll, D. One-Dimensional Metals: Conjugated Polymers, Organic Crystals, Carbon Nanotubes, 2nd ed.; Wiley-VCH: Weinheim, 2004. (g) Handbook of Conducting Polymers, 3rd ed.; Skotheim, T. A.; Elsenbaumer, R. L.;Reynolds, J. R., Eds.; CRC Press: New York, 2007.
(6) Cheng, Y.-J.; Yang, S.-H.; Hsu, C.-S. Chem. Rev. 2009, 109, 5868.
(7) Many of these applications are referenced in Ref. 6, for more recent reviews the reader is directed to the following publications. For OLED applications: (a) Grimsdale, A. C.; Chan, K. L.; Martine, R. E.; Jokisz, P. G.; Holmes, A. B. Chem. Rev. 2009, 109, 897. (b) Beaujuge, P. M.; Reynolds, J. R. Chem. Rev. 2010, 110, 268. For OPV applications: Gfines, S.; Neugebauer, H.; Sariciftci, N. S. Chem. Rev. 2007, 107, 1324. For chemical sensing: (a) McQuade, D. T.; Pullen,
A. E.; Swager, T. M. Chem. Rev. 2000, 100, 2537. (b) Swager, T. M. Acc. Chem. Res. 1998, 31,
201. (c) Thomas III, S. W.; Joly, G. D.; Swager, T. M. Chem. Rev. 2007, 107, 1339.
(8) Turro, N. J. Modern Molecular Photochemistry; University Science Books:Sausalito, CA, 1991.
New York, 1999.
(10) Frster, T. Ann. Phys. 1948, 2, 55.
(11) Dexter, D. L. J. Chem. Phys. 1953, 21, 836.
(12) Anslyn, E. V.; Dougherty, D. A. Modern Physical Organic Chemistry; University Science Books: Sausolito, CA, 2006.
(13) These photophysical processes are observed in a variety of applications, the reader is directed to Refs 5, 6 and 7 for more information.
(14) Moliton, A.; Hiorns, R. C. Polym. Int. 2004, 53, 1397.
(15) Yan, M.; Rothberg, L.; Hsieh, B. R.; Alfano, R. R. Phys. Rev. B 1994, 49, 9419-9422. (16) (a) Theander, M.; Yartsev, A.; Zigmantas, D.; Sundstrom, V.; Mammo, W.; Andersson, M. R.; Inganas, 0. Phys. Rev. B 2000, 61, 12957. (b) Haugeneder, A.; Neges, M.; Kallinger, C.; Spirkl, W.; Lemmer, U.; Feldmann, J.; Scherf, U.; Harth, E.; Gugel, A.; Mullen, K. Phys. Rev. B 1999, 59, 15346. (c) Halls, J. J. M.; Pichler, K.; Friend, R. H.; Moratti, S. C.; Holmes, A. B.
Appl. Phys. Lett. 1996, 68, 3120. (d) Stubinger, T.; Brutting, W. J. Appl. Phys. 2001, 90, 3632.
(17) (a) Yang, J. S.; Swager, T. M. J. Am. Chem. Soc. 1998, 120, 5321-5322. (b) Yang, J. S.; Swager, T. M. J. Am. Chem. Soc. 1998, 120, 11864-11873.
(18) (a) McQuade, D. T.; Hegedus, A. H; Swager, T. M. J. Am. Chem. Soc. 2000, 122, 12389. (b) Levitsky, I. A.; Kim, J.; Swager, T. M. J. Am. Chem. Soc. 1999, 121, 1466.
(19) Swager, T. M.; Gil, C. J.; Wrighton, M. S. J. Phys. Chem. 1995, 99, 4886.
(20) Levine, M.; Song, I.; Andrew, T. L.; Kooi, S. E.; Swager, T. M. J. Polym. Sci. A 2010, 48, 3382.
Chapter 2
Interrupted Energy Transfer: Highly
Selective Detection of Cyclic Ketones in the
Vapor Phase
Adapted and reproduced in part with permission from: Cox, J. R; Muller, P.; Swager, T. M. J. Am. Chem. Soc. 2011, 133, 12910-12913.
2.1 Introduction and Motivation for Ketone Detection
Plasticized explosives such as Composition C-4 and Semtex have drawn consiberable interest from government agencies due to the worldwide increase in terrorism related events.' These materials are typically comprised of approximately 90% energetic compounds and 10% binders/plasticizers.2 The molecular structures and relevant physical properties of some expolsives and related materials are depicted in Table 2.1. In the case of C-4, the energetic
material is 1,3,5-trinitro-1,3,5-triazacyclohexane (RDX). This compound exhibits an extremely
low equilibrium vapor pressure - approximately 6 ppt at 25 *C.3 Approaches to the detection of RDX rely upon mass spectroscopic (MS) techniques, ion mobility spectrometry (IMS),5
terahertz time domain spectroscopy (THz-TDS)6 and various colorimetric and fluorescence techniques.7
Table 2.1. Names, molecular structures and equilibrium vapor pressures of explosives and related compounds.
Name Molecular Equilibrium vapor Purpose
structure pressure at 20 C (Torr)
NO2
1,3,5-trinitro-1,3,5- N .N Energetic component
triazacyclohexane N4.1 x 109-4 (RDX) 02 N N N02 02N N02 2,4,6-trinitrotoluene 1.1 X 10- High explosive (TNT)I NO2 NO2
Pentaerythritol O-NO2 3.8 x 10.10 Energetic component
tetranitrate 02N-O of Semtex
(PETN) 2
NO2
Cyclohexanone 5(25"C) Solvent used in therecrystallization of
Each of these approaches carries with it a unique collection of advantages and limitations. Mass spectroscopic techniques, while providing excellent sensitivity and exquisite selectivity, requires the use of equipment that is not amenable to field-portable settings such as military operations. Canines have also proven effective in this regard; however, they require special handling and cannot be employed for long periods of time without significant rest periods. The Swager group recently reported an enzyme inspired approach to RDX detection using acridine-based hydride donors.7"
As outlined previously, amplifying fluorescent polymers (AFPs) are excellent materials for chemosensing applications including the detection of trace energetic materials such as TNT. Despite the success of PET-based transduction mechanisms using AFPs in nitroaromatics detection, RDX cannot easily be detected. This is primarily due to the extremely low equilibrium vapor pressure and unfavorable reduction potential of this compound. In order to create a favorable electron transfer event for PET, a larger band gap AFP is required.7a The increase in
driving force for electron transfer also brings with it a loss in selectivity as many other analytes could potentially quench the AFP.
Plasticized explosives contain a percentage of binders and plasticizers that increase the stability of the energetic component while simultaneously enhancing favorable mechanical properties such as malleability. A recent study using solid-phase microextraction (SPME) techiques coupled with IMS reported the identities of the various additives in different samples of C-4.9 The two most prevalent compounds present in the air above these samples are cyclohexanone and 2-ethylhexanol. Cyclohexanone, whose molecular structure is depicted in Table 2.1, is used as a solvent in the production of RDX.4 Residual quantities of this compound
alcohol, 2-ethylhexanol, is used in the synthesis of a diester phthalate plasticizer known as DEHP and also finds its way into commercial C-4 samples. These two compounds exhibit much larger equilibrium vapor pressures than RDX and are speculated to be the compounds that trained canines actually smell when identifying C-4.10 Cyclohexanone is less prevalent than
2-ethylhexanol in non-explosives materials (present in plastic bottles/bags, glue etc.) thus limiting the number of false positives if using these components for an early warning detection system. These points served as inspiration for the development of an AFP-based sensor to detect cyclic ketones such as cyclohexanone in the context of plasticized explosives detection.
2.2 Proposed Transduction Mechanism
The detection of simple ketones using an AFP-based transduction mechanism has not been described in the literature. This is due, in part, to the lack of a favorable PET event between conjugated organic materials and unconjugated ketone moieties. This called for the formulation of an alternative transduction mechanism that does not rely on any electron transfer events involving the ketone. As described in previous sections, the efficiency of Dexter energy transfer is governed largely by the extent of orbital overlap between the donor and acceptor." The proposed transduction mechanism, outlined in Figure 2.1, is predicated on interrupted Dexter energy transfer. An AFP thin-film is used as a light-harvesting unit that can amplify the luminescence of a near-infrared (NIR) emitting receptor through the synergy of exciton migration and Dexter energy transfer. In the absence of any analytes, the selective excitation of the AFP component should yield fluorescence from both the AFP and the NIR fluorophore. In the presence of an analyte that is capable of interacting with the receptor, the interaction is thought to disturb the distance between the receptor and the AFP backbone thereby perturbing the efficiency of energy transfer and signaling the presence of the analyte.
710 nmo
460 nm
400 nm 400 nm
EET EET interrupted by binding
induced displacement Figure 2.1. Schematic depiction of the proposed transduction mechanism (blue
barbed structure = AFP, red structure = NIR-emitting receptor, green structure = cyclohexanone).
2.3 Design Considerations and Synthesis of Emissive Receptor
Realization of the aforementioned transduction mechanism requires the exclusion of any
EET via the FRET pathway due to the fact that FRET can operate over very large distances.
Condensed phases such as thin-films yield exceedingly small intermolecular distances; and as
such, favor both the FRET and Dexter pathways. In order to favor the exchange mechanism, a
chromophore with an absorbance spectrum that does not overlap with the emission spectrum of
an AFP was necessary. Squaraine dyes are highly luminescent materials with narrow bandwith
absorbance spectra typically in the 650 - 700 nm range.13 Synthetic access to substituted squaraines is facile, making this class of molecules an excellent choice for interrupted energy
transfer. Our proposed sensing scheme also requires that the squaraine dye possess a molecular
recognition unit for the ketone moiety of cyclohexanone. Bifurcated hydrogen bond donors such
as diaryl ureas and thioureas have been widely used as activators of carbonyl functionalities and
Our synthetic route towards SQ1 is displayed in Scheme 2.1. The synthesis begins with the formation of an unsymmetrical diaryl urea via the reaction of a phenylenediamine and 3,5-bis(trifluoromethyl)phenyl isocyanate. This compound underwent an electrophilic aromatic
substitution/condensation reaction with squaric acid to afford SQ1 in good yield.
N CF3
__ N N CF3 :
N N CF3 NIR luminescence H H
O()O O analyte binding
NH2 N N CF3 F3C N N N rigidification
H H
66% / 0 72%
CF3 N SQ1
(i): 3,5-Bis(trifluoromethyl)phenyl isocyanate, CH2CI2, rt, 12 h.
(i): Squaric acid, toluene/n-butanol (3:1), reflux, 6 h.
Scheme 2.1. Synthetic route to emissive receptor SQ1.
The resulting emissive receptor contains two strong intramolecular hydrogen bonds between the urea amide protons and the two oxygen atoms of the central four-membered ring. These interactions rigidify the dye scaffold thereby red shifting the absorbance spectrum (relative to unfunctionalized squaraine dyes) and also increasing the quantum yield of luminescence by removing rotational modes that could promote internal conversion. We chose to use pentiptycene containing PPE1 (structure displayed in Scheme 2.2) as the light harvesting unit for two reasons: (1) the pentiptycene unit reduces interpolymer n-n interactions that could compete as low energy trap sites and (2) the pentiptycene units increase the porosity of the polymer film thereby facilitating analyte diffusion into the film and also providing ample space for SQ1 to interact with the polymer backbone.15
- cyan luminescence
film porosity PPEI
'---Scheme 2.2. Molecular structure of PPE1.
The photophysical properties of SQ1 and PPE1 are displayed in Figure 2.2. The emission spectrum of PPE1 exhibits relatively little spectral overlap with the absorbance spectrum of SQ1
- an ideal scenario for the promotion of Dexter energy transfer. However, SQ1 does exhibit a small absorbance at approximately 415 nm which is due to a So-+Sa transition as the So-+S2 transition is symmetry forbidden.16 This low oscillator strength transition displays finite spectral overlap with the emission maximum of PPE1 and is believed to contribute to the energy transfer cascade. As mention previously, the efficiency of Dexter energy transfer is not dependent on the oscillator strength of the acceptor transition whereas FRET is strongly dependent on this variable; and as such, points towards Dexter energy transfer as the dominant mechanism.17
1.0 1.0 ' 0.8 PPEI SQ. 0.8 0.60. 0.4 0.4 0.2 0.2 Z 0.0 0.0 300 400 500 600 700 800 Wavelength (nm)
Figure 2.2. Absorbance (solid line) and emission (line with squares) spectra of PPE1 (blue) and SQ1 (red). Spectra were taken in CHC13, using the absorbance
maximum for each component as the excitation wavelength for emission collection.
2.4 Optimization of Dye Loading, Energy Transfer Efficiency and Ketone Detection
The efficiency of energy transfer was found to vary according to the dye-loading of SQ1 within thin-films of PPE1. Figure 2.3 displays the results of this study. Surprisingly, dye-loadings greater than approximately 0.5 wt% resulted in a decrease in the effieciency of energy transfer. We hypothesize that this seemingly counter intuitive result is due to the insolubility of SQ1 in films of PPE1 thereby causing phase separation of the two components and a net loss of energy transfer. Indeed, SQ1 was sparingly soluble in all organic solvents tested including chloroform, dichloromethane, DMSO and ethanol. In addition, dye loadings less than 0.5 wt% also resulted in decreased energy transfer. Given that excitons created in AFP thin-films have a finite migration sphere, and that the energy transfer efficiency drops off precipitously at dye loadings below 0.5 wt%, we hypothesize that a dye loading of 0.5 wt/o results in a film where the average dye-dye distance is less than the radius of the exciton sphere.
Once the optimum dye-loading was established, the films were exposed to the saturated vapor of both cyclohexanone and acetone to ascertain whether the thin-films would elicit a
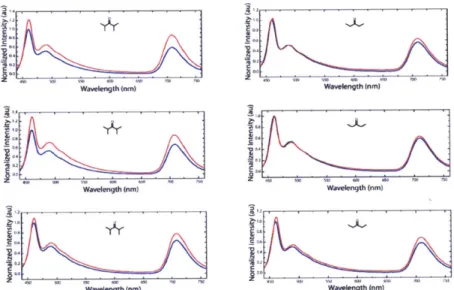
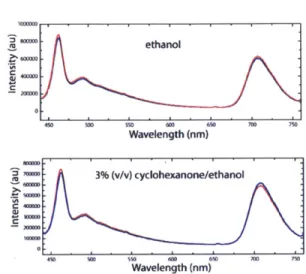
response. Interestingly, exposure to acetone vapor yielded no change in the emission spectra whereas cyclohexanone caused a dramatic shift in the ratio of emission of the two components as shown in Figure 2.4.
_I
0.70 0.65 0.60 0.55 0.50 0.45 0.40 0,35 030 0- 6-00 0. 1.0 1.5 .0 2 0 0 0.5 to 1.5 2.0 2Z5 Weight % DyeFigure 2.3. Plot expressing the relationship between dye-loading (wt%) and energy transfer efficiency. Thin-films containing both components were excited in a spectral region where only PPE1 absorbs (400 nm) and the ratio of SQ1:PPE1 was compared. -3 6 2.Ox10 6 1.6x10 6 1.2x10 8.Ox1O 4.0x0 0 Wavelength (num) 40(1 &' 3x11 2x1 1x1i Wavelength (nm)
Figure 2.4. Thin-film fluorescence spectra before (blue) and after (red) exposure to the saturated vapor of acetone (top) and cyclohexanone (bottom) for 30 s (x = 400 nm).
Given the large disparity in equilibrium vapor pressure between cyclohexanone and acetone (acetone exhibits an equilibrium vapor pressure approximately 40 fold larger than cyclohexanone) and the small size of acetone relative to cyclohexanone, it was surprising to observe the results depicted in Figure 2.4. In order to further probe the selectivity of the sensor system, a number of other acyclic and cyclic ketones were screened. The ketone dependent responses of the sensor system are depicted in Figure 2.5.
100-80 PPEI Emission 60 - SQl Emission S40 20 0 40 W)-20 -100
6
Figure 2.5. Change in thin-film fluorescence intensity of polymer (blue) and squaraine dye (red) after 30 s exposure to the saturated vapor of the indicated ketone (x = 400 nm) (mean of three different films).
Close inspection of Figure 2.5 reveals two important trends. The most intriguing of the two trends lies in the sensor response to cyclic ketones. The three cyclic ketones elicited a ratometric response of the sensor system whereby the emission intensity of SQ1 decreased with a concomitant increase in the emission intensity of PPEL. This particular response matches the expected response if the transduction mechanism described in Figure 2.1 is operating. Conversely, exposure to acyclic ketones such as diisopropyl ketone, acetone, and 3-pentanone
yielded increases in the emission intensity of both components. The second trend is the overall increase in the magnitude of the response as a function of increasing alkyl character. This trend suggested that the hydrophobicity of the analyte may be a contributing factor to the observed selectivity.
To probe whether the observed selectivity was a function of the partition coefficient of the analytes, a quartz crystal microbalance (QCM) study was undertaken. The QCM instrument allows for high precision measurments of changes in mass by measuring the fluctuation of the resonant frequency of an oscillating quartz crystal.18 The results of this study are depicted in Figure 2.6. Each measurment was performed in a manner identical to the method used to produce the results in Figure 2.5.
2.5x10² 2.0x10-1.5x102 1.0x10⁻² :3 5.0x10 3 "- 0.0
-Figure 2.6. Mean frequency shift of a QCM crystal coated with a thin-film of the sensor formulation after 30 s exposure to the saturated vapor of the indicated ketone (mean of three sequential measurements).
In general, the results of the QCM study corroborate the hypothesis that the partition coefficient of the analytes is a contributing factor to the observed selectivity of the sensor. However, there are three important observations that suggest SQ1 is intrinsically selective for cyclic ketones over acyclic ketones. The first point is that the results from Figure 2.6 suggest that
the partition coefficient of diisopropyl ketone is within an order of magnitude of the partition coefficient of cyclopentanone. Interestingly, despite the ability of both analytes to permeate the film, only cyclopentanone elicits a ratiometric response. Along similar lines, the partition coefficients of the cyclic ketones increase with increasing ring size - most likely a result of increased hydrophobicity. Despite this trend, cyclopentanone and cyclohexanone yield a greater response than cycloheptanone. This result suggests that SQ1 may be exhibiting some intrinsic structure-property selectivity; specifically, that the binding area in SQ1 cannot accommodate larger rings. The third point involves the response of the sensor to 2-methylcyclopentanone. This compound partitions into the films as efficiently as cyclopentanone; yet, it does not yield the expected ratiometric response thereby supporting the hypothesis that SQ1 possesses some degree of intrinsic selectivity.
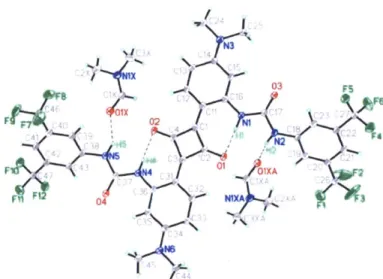
Further supporting evidence comes from the cocrystal structure of SQ1 with dimethylformamide (DMF) shown in Figure 2.7. The structure displays the strong intramolecular hydrogen bonds that exist between the proximal urea protons and the central carbonyl functionalities of the central four membered ring as well as an intramolecular hydrogen bond between the distal urea protons and the amide carbonyl of DMF. The DMF molecules form intermolecular hydrogen bonds with two SQ1 molecules which are situated face to face due to strong nt-7i interactions. Attempts to produce cocrystals of SQ1 with cyclic ketones such as cyclohexanone failed due to the limited solubility of this compound.
/
It-Figure 2.7. Thermal ellipsoid representation of the X-ray structure of SQ1 (1:1 cocrystal with DMF). The displacement ellipsoids are drawn at the 50% probability level, hydrogen atoms are represented by a sphere of arbitrary radius (gray = carbon, green = fluorine, blue = nitrogen, red = oxygen, light blue =
hydrogen, black dashed lines = hydrogen bonds).
To further understand the observed selectivity, we sought to investigate what causes the emission intensity of PPE1 to increase when exposed to acyclic ketones such as diisopropyl ketone. Thin-films solely comprised of PPE1 are known to elicit an increase in emission intensity when exposed to 'good' solvents such as toluene.19 This effect is due to solvent induced
swelling of the film which removes low energy trap sites (n-n stacking) in the polymer film that act as quenching sites. To verify that solvent induced swelling was indeed the origin of the increase in PPE1 emission in the presence of acyclic ketones we exposed the sensor formulation to the saturated vapor of toluene (Figure 2.8).
9x10' 8x10⁷ 706 7x10 S6x107 5x10 -4x10 7 S3x107 2x10⁷ 300 400 450 500 550 600 650 700 750 800 Wavelength (nm)
Figure 2.8. Thin-film fluorescence spectra taken in the presence of the saturated vapor of toluene. The black trace represents the first collected spectrum with red and green traces following at intervals of approximately 30 s (x = 400 nm).
The results in Figure 2.8 are consistent with the notion that 'good' solvents such as toluene are capable of swelling thin-films of PPE1, as demonstrated by the large increase in the emission intensity of PPE1 during the exposure. Interestingly, the emission intensity of SQ1 remains relatively constant (slight decrease) during the exposure indicating that SQ1 maintains a small intermolecular distance with the backbone of PPE1 despite the surge of solvent molecules into the film. This result lends credence to the hypothesis that swelling, in the absence of any molecular recognition event, is not capable of eliciting a ratiometric response.
2.5 Development of a Reversible, Field-portable Detection System Using Interrupted Energy Transfer
In order to develop a truly field-portable sensor it is advantageous to use a reversible sensing system as this increases the lifetime of the sensor, decreases the number of consumables
and defrays some of the cost of the sensing element.2 0 Initially, our sensing system did not display reversibility as shown in Figure 2.9.
normolresponse - Nstream : 120'ClOnin
re-exposetoanalyte
quenchingresponseafterheating
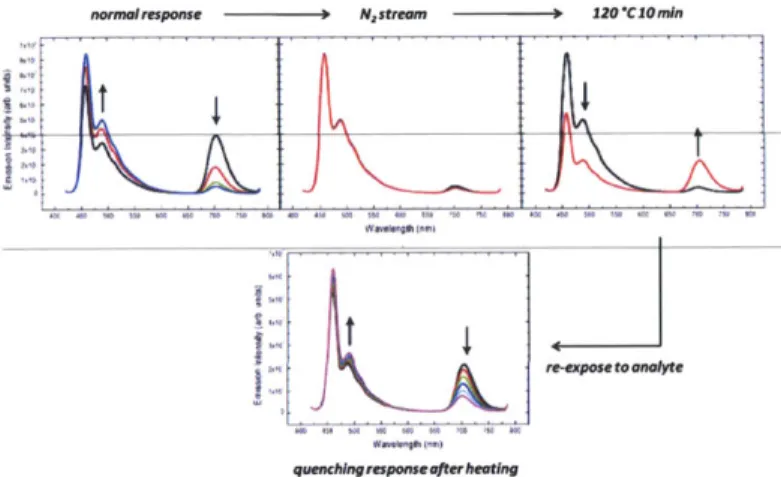
Figure 2.9. Sequential fluorescence spectra of sensor formulation. The film is first exposed to the saturated vapor of cyclohexanone until the emission of SQ1 is suppressed (top, left). The film is then sparged with a stream of N2 and a subsequent spectrum recorded (top, middle). The same film is heated to 120 *C for 10 minutes and an additional spectrum recorded (top, right). The resulting film is then re-exposed to the saturated vapor of cyclohexanone (bottom, middle) (x = 400 nm).
The results displayed in Figure 2.9 show that the lack of reversibility was not due to residual cyclohexanone bound to the receptor site of SQ1 as sparging with an N2 stream did not regenerate the emission from SQ1. However, annealing the film at 120 *C for 10 minutes restored the emission from SQ1 and the resulting film was capable of responding to additional cyclohexanone vapor. This result indicated that the initial exposure to cyclohexanone vapor may have displaced the dye molecules from the polymer backbone and heating (annealing) was necessary to restore the equilibrium positions of the dye molecules within the scaffold.
As discussed previously, chemosensing technology utilizing AFPs have been incorporated into a portable device known as FIDO@. This instrument allows for heating of the sensing element and, in principle, should interface easily with our sensing mechanism to create a field-portable, reversible sensor for cyclohexanone vapor. Unfortunately, despite continuous heating of the thin-film, the sensor did not exhibit any significant reversibility when exposed to cyclohexanone vapor as depicted in Figure 2.10.
60M00 550000 500000 40=- 35-0 1 1 200 Tim (s)
Figure 2.10. Uncorrected response of FIDO@ to the saturated vapor of acetone (first three reversible peaks) followed by saturated cyclohexanone vapor (four consecutive exposures). Note the 'staircase' structure of the data indicating that it
is an irreversible response.
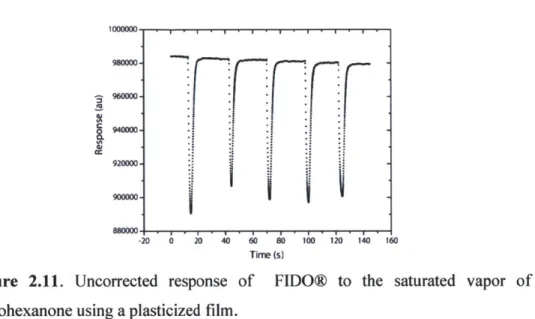
We surmised that lowering the glass transition temperature (Tg) of the polymer would increase the reversibility of the sensor formulation. Dioctyl phthalate was employed as a plasticizer, and at loadings of approximately 1 wt%, successfully increased the fluidity of the film. Gratifyingly, the plasticized film responded to cyclohexanone in a reversible manner as shown in Figure 2.11.
~940000
:
920000-
900000--20 0 20 4 0 6 8 100 120 140 160 Tire (s)
Figure 2.11. Uncorrected response of FIDO@ to the saturated vapor of cyclohexanone using a plasticized film.
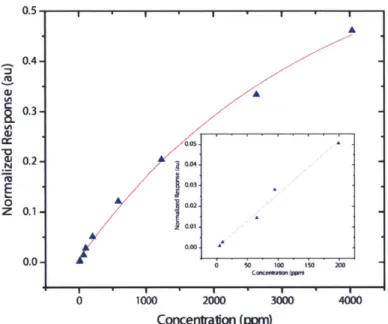
With a reversible sensor in hand, we focused our efforts on determining the analytical capabilities of the new system. Using a calibrated vapor delivery system, we generated precious concentrations of cyclohexanone vapor to challenge our new system.2' The resulting data was used to construct a calibration curve (Figure 2.12) and to determine the limit of detection (LOD). It is noteworthy that all measurements were collected in ambient air with (or without) 48% relative humidity - conditions that mimic those that would be encountered outside the laboratory. The LOD obtained under these conditions was 5 ppm cyclohexanone, a value that is significantly larger than what would be necessary for trace explosives detection. Despite this apparent drawback, we exposed the FIDO@ system to the headspace above a sample of C-4 explosive. The instrument recorded small 'hits' in response to the headspace as shown in Figure 2.13. Using the calibration data from Figure 2.12 we estimated that the magnitude of the FIDO@ response correlated to a concentration of approximately 17 ppm of cyclohexanone vapor. In order to verify this result, the headspace above the same sample of C-4 was sampled using SPME techniques and the concentration of cyclohexanone in the headspace was obtained using GC/MS. The obtained value of 27 ppm was very similar to the value reported by the FIDO@ and lends
credence to the notion that the response of the sensor system was indeed due to cyclohexanone vapor in the headspace. The headspace GC/MS analysis also showed no traces of TNT or 2,4-dinitrotoluene (DNT) contaminants which could potentially interfere with the signal.
0.5 , 0.4- 0.3- 0.05-~0.2-U 0 00 z 0.1-0.01 0.0- do D ID l* i -I i I I I 0 1000 2000 3000 4000 Concentration (ppm)
Figure 2.12. Calibration curve showing the response of the sensor system to different concentrations of cyclohexanone vapor (exponential fit). Inset figure is an expansion of the 0 - 200 ppm concentration range (linear fit).
C4
181M100. ett
170000 . a C4 A
10 20 30 40 SO 60 70 80 90 100 110 120 1-0 14 150
Time (s)
Figure 2.13. Uncorrected response of the FIDO@ instrument to the headspace of C-4 explosive.
2.6 Conclusion
In summary, we have developed a highly selective detection system for cyclic ketones. The transduction mechanism leverages the unique spatial requirements of Dexter energy transfer to generate a selective detector that does not require any type of PET in order to function. In addition, the synthesis and photophysical properties of emissive receptor SQ1 were described as well as the optimization of the energy transfer cascade utilizing this new fluorophore. The sensor was effectively interfaced with the FIDO@ system and was shown to reversibly respond to concentrations of cyclohexanone vapor down to 5 ppm. The sensor also showed promise for the detection of cyclohexanone vapor in the hcadspace of the plasticized explosive C-4.
2.7 Experimental Section
MA TERIALS AND METHODS: All chemicals were of reagent grade, purchased from Sigma-Aldrich
and used as received. All solvents used for photophysical experiments were of spectral grade. PPE1 was a gift from ICx* Technologies (Lot#: BD15267). 1H and 13C NMR spectra were obtained on either a Varian Mercury (500 MHz) or Varian Mercury (501 MHz) spectrometer. NMR chemical shifts are referenced to either THF-d or DMSO-d and reported in units of 8 (ppm). All 13C spectra are proton decoupled. All NMR experiments were conducted at room temperature. High-resolution mass spectra (HRMS) were obtained at the MIT Department of Chemistry using a peak-matching protocol to determine the mass and error range of the molecular ion. Electrospray or direct analysis in real time (DART), operating in negative ion mode, were used as the ionization techniques. UV-vis spectra were measured on an Agilent 8453 diode array spectrophotometer and corrected for background signal with a solvent filled cuvette. Fluorescence spectra were obtained using a SPEX Fluorolog-T3 fluorimeter using right-angle detection (solution measurements) or front-face detection (thin film measurements). Thin films
containing PPE1 and SQ1 were fabricated by spin-coating (5000 RPM for 1 min) chloroform solutions of the appropriate concentrations (Specialty Coating Systems G3P-8 Spincoat). The films were then placed under vacuum to ensure complete removal of the residual solvent. Thin-film quenching experiments were conducted by taking an initial photoluminescence spectrum
(ex= 400 nm, entrance/exit slits 2 nm) of the thin film, placing the surface over a glass vial
loaded with 2 mL of the appropriate ketone for 30s, and taking an additional photoluminescence spectrum immediately after exposure. Quartz crystal microbalance measurements were performed with a home-built quartz crystal microbalance setup with crystals (10 MHz, Au electrodes) and oscillator from the International Crystal Manufacturing Co. Films were applied by spin-coating chloroform solutions of PPE1 and SQ1 on both sides of the crystal (5000 RPM for 1 min). Exposure of the QCM crystals to analyte was performed analogous to the photoluminescence experiments with data collection running continuously during the exposure. Film thicknesses were obtained according to previously published procedures. LOD measurements and experiments involving C-4 explosive were carried out at the Edgewood Chemical Biological Center and the methods are described in a subsequent section.
SYNTHETIC PROCEDURES AND CHARACTERIZATION:
N N CF3
*H 1) M NaOH 0
NH2 2) 3,5-Bis(trifluormethyl)phenyl isocyanate (1.1 equiv) N N CF3
CH2CI2 H H
r.t., 12 h
1-(3,5-bis(trifluoromethyl)phenyl)-3-(3-dimethylamino)phenyl)urea. NN-Dimethyl-m-phenylenediamine dihydrochloride (2.0 g, 9.56 mmols) was dissolved in 10 mL of methylene chloride and washed with IM NaOH (aq). The resulting organic layer was isolated, dried over anhydrous MgSO4, and added directly to a 25 mL round-bottom flask containing a stirred solution of 3,5-Bis(trifluoromethyl)phenyl isocyanate (2.68 g, 10.52 mmols) in 5 mL methylene