The Design of a HSMM-Based Operator State Monitoring Display
by Ryan W. Castonia
S.B. Aerospace Engineering Massachusetts Institute of Technology, 2010
Submitted to the Department of Aeronautics and Astronautics in partial fulfillment of the requirements for the degree of
Master of Science in Aeronautics and Astronautics
at the
Massachusetts Institute of Technology
June 2010
©2010 Massachusetts Institute of Technology. All rights reserved.
ARCHIVES
Signature of Author:_
Ryan W. Castonia Department of Aeronautics and Astronautics May 21, 2010 /1 4 Y
Certified by:
Certfiedby:M
. L. Cummings Associate Professor of'ronautics and Astronautics Thesis Supervisor
Accepted by:
Eytan H. Modiano Professor of Aeronautics and Astronautics
Chair, Committee on Graduate Studies
MASSACHUSETTS INSTffUTE OF TECHNOLOGY
JU N 2 3 2010
The Design of a HSMM-based Operator State Monitoring Display
by
Ryan William Castonia
Submitted to the Department of Aeronautics and Astronautics on May 21, 2010 in partial fulfillment of the requirements for the degree of Master of Science in Aeronautics and Astronautics
Abstract
This thesis presents the development of and the findings from the design and evaluation of a hidden semi-Markov model (HSMM)-based operator state monitoring display. This operator state monitoring display is designed to function as a decision support tool (DST) for the supervisor of a small team of operators (between 2 and 4 team members) that are each monitoring and controlling multiple highly autonomous heterogeneous unmanned vehicles (UVs). Such displays are important in real-time, mission-critical complex systems because both operator and vehicle state monitoring are difficult, and failure to appropriately handle emerging situations could have life or mission-critical consequences.
Recent research has shown that HSMM-based models can be used to model the time-sensitive behavior of operators controlling multiple heterogeneous UVs. Because this method requires substantial knowledge in probability theory to understand, the difficulty lies in the accurate, useful display of the HSMM information to a team commander in the field. It must be assumed that the team commander generally does not have the required background in stochastic processes to understand the method and may be biased in interpreting probabilistic functions. This further increases the difficulty of the proposed method. In this thesis, a cognitive task analysis (CTA) was performed to determine the functional and information requirements of the DST, and a human systems engineering design process was used to develop a prototype display. A human subject experiment was then conducted to test the effectiveness of the DST. The DST was shown to improve team supervisor performance in terms of increased decision accuracy, decreased incorrect interventions, and decreased response times in single alert scenarios. The DST was also shown to decrease the number of incorrect interventions, while having no affect on decision accuracy and total response time scenarios when the supervisor faced multiple simultaneous alerts. Additionally, the DST was not shown to increase operator mental workload, as measured by a secondary task, for any of the scenarios. Overall, the results suggest that HSMM-based operator state modeling can be effectively utilized in a real-time DST for team supervisors.
While this research was focused on a team supervisor of multiple operators each independently
controlling multiple heterogeneous UVs, the results are generalizable, and any research in time-critical team HSC domains may benefit from this work.
Thesis Supervisor: M. L. Cummings
Acknowledgements
First and foremost, I must express my deepest gratitude, love, and awe that God has continuously blessed me beyond my wildest dreams. I pray that I continuously become more obedient as I seek to more fully demonstrate His love through my thoughts, words, and actions.
Thank you, Professor Cummings, for your willingness to work with me through every situation that I brought your way. Through all of the varied Air Force requirements, my leaving for the summer to get married, and several other commitments that kept me from always being in the lab like a good grad student, you always understood and supported me. I am proud to have worked for you and look forward to keeping in touch.
Yves, working closely with you over the past couple years has been fantastic. You were always there to brainstorm with me and provide substantial, effective feedback every step of the way (except for when you were out of the country teaching SCUBA or attending weddings in castles...) I'm glad we were able to share so many experiences outside of the lab together such as Reach the Beach, WODs, and volleyball. There is no way that I could have done this without you, and I look forward to hearing about you becoming Dr. Boussemart! Thank you!
To all of my fraternity brothers and close friends at MIT, you have made my last five years an amazing experience. You are what make MIT the finest institution in the world. Thank you for your support and for so many memories.
To Hank, Jonathan, and all the UROPs that worked on this project along the way, thanks for being part of the team! I hope you enjoyed your work and hope you can apply what you learned to your future projects.
To the Great 8 and the rest of the HALiens, congratulations and good luck! Working in HAL has been an amazing adventure. I will always reminisce of volleyball in front of building 33, spirit dances at lab meetings, countless reminders about how bad we all are at writing, and the 2010 US Olympic dominance (except for that last hockey game...)
To my mother and father, I thank you for your unwavering support for the past 23+ years. Thank you for encouraging me to always aim for the top. You have always made sure that I knew I could do anything I put my mind to as long as I committed, worked hard, and never gave up. I am the man I am today because of you. I thank you more than I can express in mere words. I love you, and look forward to our adventures in trying to catch up with each other around the world!
Rachel, I have missed you deeply during my college and your high school years. I was so happy that you were able to visit us during your spring break in 2010! You know that you will always have a place to stay wherever we are, so visit often! Love ya!
Tirzah, my beautiful, caring, charming, loving, amazing wife, words cannot express the love and respect I have for you. Together, we have tackled one "impossible" task after another without wavering. We might not always take the easy road, but we take the road that is right for us. I cherish every moment that I get to spend with you. I love you z-hundred!
Table of Contents
Abstract ... 3 Acknowledgem ents...5 Table of Contents...7 List of Figures ... 9 List of Tables ... 11 List of Acronyms ... 13 1. Introduction... 151.1 Problem Statem ent ... 17
1.2 Research Objectives... 17
1.3 Thesis Organization ... 18
2. Background... 19
2.1 Team M onitoring ... 19
2.2 Hum an Behavior Pattern Recognition and Prediction ... 22
2.2.1 Statistical Learning Techniques ... 23
2.2.2 Bayesian M ethods... 23
2.2.3 HSM M -based Operator M odeling ... 24
2.3 Display of Probabilistic Data... 26
2.4 Background Summ ary... 27
3. Design of a HSMM-based Operator State Decision Support Tool... 29
3.1 Cognitive Task Analysis ... 29
3.1.1 Decision Ladders... 30
3.1.2 Display Requirem ents Checklist... 33
3.1.3 Cognitive Task Analysis Sum mary ... 34
3.2 HSM M -based Operator State Decision Support Tool ... 34
3.2.1 Interaction Frequency Plot ... 35
3.2.2 M odel A ccuracy Prediction Plot ... 37
3.2.3 Confidence History Plot... 40
3.2.4 Status Panel... 43
3.3 Sum mary...47
4. Experim ental Evaluation...49
4.1 Participants...49
4.2 Apparatus...49
4.2.1 Testing Environm ent Layout ... 50
4.2.2 Operator Interface: RESCHU ... 51
4.2.3 Team Supervisor Interface: HSMM-based Operator State Decision Support Tool...53
4.2.4 Secondary Task Display ... 54
4.3 Experim ental Design ... 55
4.3.1 Independent Variables... 56
4.3.2 Dependent Variables ... 57
4.4 Procedure ... 58
4.5 Experim ental Evaluation Summ ary ... 59
5.1 D ecision A ccuracy ...-- ... .--.. . - ---...61
5.2 Incorrect Interventions ... ..63
5.3 R esponse Tim e... .... . ---... 64
5.4 Secondary Task Ratio ...--... 67
5.5 Subjective D ST Understanding... ... ... 68
5.6 Discussion of Experimental Findings ... 70
5.6.1 Decision Accuracy ... .... 70
5.6.2 Incorrect Interventions ... . .. 71
5.6.3 Response Time... ... 72
5.6.4 Secondary Task Ratio ... ... ...73
5.6.5 Subjective Feedback ... 74
5.6.6 Summary of Results... 75
6. C onclusions...----...---. . ---... 77
6.1 Supervisor Performance ... 77
6.2 Display of Probabilistic Data... 78
6.3 Future W ork ...-...-... ---... 78
6.4 Thesis Sum m ary...--.... . ---...79
R eferences...- --... ----.... ---... 81
A ppendix A : D ecision Ladders... .... 87
Appendix B: Decision Ladders with Display Requirements for Decision Support Tool ... 89
Appendix C: Scenario Descriptions and Test Matrix ... 91
Appendix D: Human Subject Post Experiment Questionnaire ... 93
Appendix E: Human Subject Consent Form... ... 95
Appendix F: Human Subject Demographic Survey...99
Appendix G: Training Slides - DST User ... 103
Appendix H: Training Slides - Non DST User ...----. 111
Appendix I: Supporting Statistics ...- ... 115
List of Figures
Figure 1.1: US Navy Dahlgren Integrated Command Environment Lab
(http://www.navsea.navy.mil/nswc/dahlgren/default.aspx) ... 15
Figure 2.1: Literature review visualization... 19
Figure 2.2: Yerkes-Dodson Law adapted to performance (Hancock & Warm, 1989)... 21
Figure 2.3: Large-screen mission status display (Scott, et al., 2007; Scott, et al., 2009)... 22
Figure 2.4: A three-state hidden semi-Markov model (Castonia, 2010)... 25
Figure 3.1: Systems engineering process (Blanchard & Fabrycky, 1998)... 29
Figure 3.2: A decision ladder with human behavior heirachies shown (Rasmussen, 1983)... 30
Figure 3.3: Display requirements for the "Is There a Problem?" decision ladder... 33
F igure 3 .4 : D ST (C aston ia, 2009) ... 35
Figure 3.5: Interaction Frequency plot ... 35
Figure 3.6: Interaction Frequency plot with icons shown ... 36
Figure 3.7: Interaction frequency plot with icons and grid shown... 36
Figure 3.8: M odel A ccuracy Prediction plot ... 37
Figure 3.9: Discrete variation of the Model Accuracy Prediction display (Castonia, 2009)... 39
Figure 3.10: Linear variation of the Model Accuracy Prediction display (Castonia, 2009)... 39
Figure 3.11: Curved variations of the Model Accuracy Prediction display (Castonia, 2009)... 40
Figure 3.12: C onfidence H istory plot... 40
Figure 3.13: Model Accuracy Prediction plot with applicable Confidence History plot values... 41
Figure 3.14: A nnotated Confidence H istory plot ... 42
Figure 3.15: Confidence History plot with 3 min prediction not shown ... 43
F igu re 3 .16 : Statu s P anel... 4 3 Figure 3.17: D ST w ith U IN 's highlighted ... 44
F ig u re 3 .18 : A lert p an e l... 4 6 Figure 3.19: Status Panel w ith alert show n ... 46
Figure 3.20: Annotated DST with Design Requirements (DR) shown (Castonia, 2009)... 47
Figure 4.1: Testing environm ent layout ... 50
Figure 4.2: Operator workstation (RESCHU and DST)... 51
Figure 4.3: Annotated screenshot of the operator display - RESCHU (Nehme, 2009)... 52
Figure 4.4: RESCHU - payload camera view (visual search task)... 53
Figure 4.5: D ST screenshot w ith alert show n... 54
Figure 5.1: M ean Decision A ccuracy per subject... 62
Figure 5.2: Mean Number of Incorrect Interventions per subject ... 64
Figure 5.3: Mean first Response Times per subject (individual scenarios)... 65
Figure 5.4: Mean first Response Times per subject (grouped scenarios)... 65
Figure 5.5: Mean second Response Times (total Response Time) per subject ... 66
Figure 5.6: M ean response interval per subject... 66
Figure 5.7: DST Understanding - Likert scale box plots... 69
Figure A . 1: "Is there a problem ?" Decision Ladder ... 87
Figure A.2: "What should I do to solve the problem?" Decision Ladder... 88
Figure B. 1: "Is there a problem?" Decision Ladder with display requirements... 89
List of Tables
Table 3.1: Display requirements for DSTs that provide predictions of future operator performance ... 34
Table 3.2: UIN Descriptions ... ... 45
Table 4.1: Secondary Task target utterance and occurrences ... 55
Table 4.2: Experimental scenario descriptions ... 58
Table 5.1: Decision Accuracy results ... 62
Table 5.2: Incorrect Interventions results ... 63
Table 5.3: Early Interventions...67
Table 5.4: Secondary Task Ratio results... 67
List of Acronyms
ATC Air Traffic Control
CTA Cognitive Task Analysis
DR Design Requirement
DoD Department of Defense
DST Decision Support Tool HALab Humans and Automation Lab
HALE High Altitude Long Endurance Unmanned Vehicle
HMM Hidden Markov Model
HSC Human Supervisory Control
HSMM Hidden Semi-Markov Model
ISR Intelligence, Surveillance, and Reconnaissance
MAS Model Accuracy Score
MIT Massachusetts Institute of Technology
POMDP Partially Observable Markov Decision Process
RESCHU Research Environment for Supervisory Control of Heterogeneous Unmanned Vehicles
SA Situational Awareness
UIN User-Initiated Notification
UAV Unmanned Aerial Vehicle
UUV Unmanned Underwater Vehicle
1. Introduction
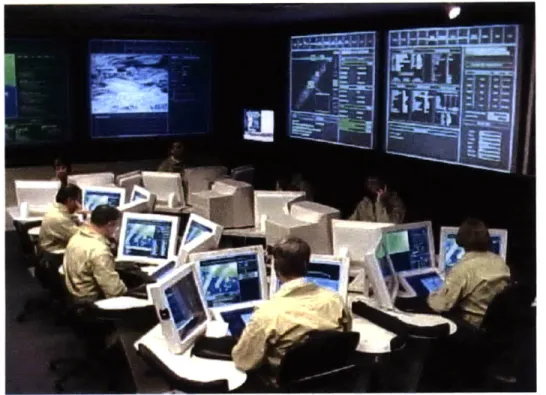
The movement toward single operators controlling multiple unmanned vehicles (UVs) is gaining momentum throughout academia and industry as a whole (Cummings, et al., 2007; DoD, 2007b, 2009). As this transition occurs, multiple operators will likely work together, under the leadership of a team supervisor, to carry out coordinated tasks similar to present-day air traffic control (ATC) settings. An example of a similar human supervisory control (HSC) environment in which multiple operators are working together is the US Navy's Integrated Command Environment Lab, shown in Figure 1.1.
Figure 1.1: US Navy Dahigren Integrated Command Environment Lab (http://www.navsea.navy.mil/nswc/dahlgren/default.aspx)
There are many ways in which multiple operators and a supervisor could interact in these futuristic scenarios, one of which places the supervisor in a HSC role over the operators. This creates a complex HSC system in which decision support tools (DSTs) have been shown to improve supervisor performance (Mitchell, Cummings, & Sheridan, 2004). This thesis focuses specifically on developing a decision support tool for a supervisor of multiple, independent operators, i.e. operators are assigned their own areas of responsibility which do not significantly overlap. ATC sector control is an example of this type of relationship.
While there has been substantial effort in designing and developing displays for the individual operators controlling multiple UVs, there has been little research into what type of displays a team supervisor requires to most efficiently supervise the team (Scott, et al., 2007), even though it is recognized that the role of the team commander is critical (Burns, 1978; Hackman, 2002). Within the development process of these types of futuristic displays, it has become evident that the common tasks of navigation, monitoring the health and status of the UVs, and operating multiple sensors provide each operator with vast amounts of information (Nehme, et al., 2006). It is unrealistic to provide the supervisor with all this information from each operator without expecting the supervisor to become overloaded. Therefore, automation may be useful in assisting a team supervisor in the assessment of operator performance. Of the little research that begins to address the issue of supervisor displays, supervisors in human operator-unmanned vehicle teaming environments are only being provided with situational awareness tools capable of identifying
current problems. However, supervisory decision support tools that attempt to predict the onset of
possiblefuture problems have not been explored (Scott, Sasangohar, & Cummings, 2009). This is another area where automation may be helpful, particularly in real-time complex systems, such as UV command and control systems, where both operator and vehicle state monitoring are difficult, and failure to appropriately handle emerging situations could have catastrophic consequences (Leveson, 1986).
Accurately detecting current and predicting possible future problems requires a thorough understanding of what "normal" operator behavior entails. This is a difficult task in a time-pressured command and control environment that contains significant uncertainty and unanticipated events. Recent research has shown that hidden semi-Markov models (HSMMs) can be used to model the time-sensitive behavior of operators controlling multiple heterogeneous UVs (Huang, 2009). Such models can both describe and predict operator behaviors. The prediction, expressed as a sequence of the most likely future operator behaviors, can be compared to learned patterns of normal operator behavior. The supervisor can then be alerted when the predicted behavior deviates from, or is expected to deviate from, the norm. It is important to note however, that such models cannot detect whether an abnormal pattern is good or bad, only that it is different, which is why the supervisor is needed to make the important decision of whether the abnormal behavior is detrimental and keep the team operating efficiently. Thus, full automation is not feasible; the human must remain part of the system.
Additionally, HSMM modeling methods require substantial knowledge in probability theory to both implement and understand. Thus, the difficulty lies in the accurate, useful display of the information to a team commander in the field who generally does not have the required background in stochastic processes and may be biased in interpreting probabilistic functions (Tversky & Kahneman, 1974).
This thesis focuses on the creation and evaluation of such a display, specifically utilizing the probabilistic output of the aforementioned HSMM-based operator model, in order to support a team commander with little to no background in statistical inferential reasoning. Design requirements were derived from a cognitive task analysis (Crandall, Klein, & Hoffman, 2006), the DST was developed, and a human subject experiment was conducted to test the effectiveness of the DST. Results show the DST improved team supervisor performance in terms of increased Decision Accuracy, decreased Incorrect Interventions, and decreased Response Times in single alert scenarios. In scenarios where the supervisor faced multiple, simultaneous alerts, the DST was shown to decrease the number of Incorrect Interventions and have no affect on Decision Accuracy or total Response Time. Overall, the results validate that HSMM-based operator state modeling can be effectively utilized in a real-time DST for team supervisors. While this research was focused on a team supervisor of multiple operators each independently controlling multiple heterogeneous UVs, the results are generalizable and any research in time-critical team HSC domains may benefit from this thesis.
1.1
Problem Statement
In order to leverage the recent advances in HSMM-based operator modeling techniques to improve team performance, it is first necessary to determine the best method for employing these techniques. Such models could operate either online as a real-time DST or offline as a post hoc evaluation tool. This thesis focuses on the development and evaluation of a real-time DST to determine whether team supervisors with a HSMM-based DST perform better than supervisors without the DST in terms of correctly identifying current and possible future problems, solving current problems efficiently and accurately, correctly preventing future problems from occurring, and limiting unnecessary interventions. This thesis also attempts to address the question of how to best display complex probabilistic data, specifically the HSMM-based operator model output, so that someone with little to no background in statistical inferential reasoning may efficiently and accurately make time-critical decisions.
1.2
Research Objectives
In order to address the problem statement, the following research objectives were posed:
* Objective 1: Conduct a cognitive task analysis for a supervisor of multiple operators who are each independently controlling a set of highly autonomous UVs. A cognitive task analysis (CTA) was conducted in order to understand the decisions the supervisor would need to make in this domain and determine what information the supervisor would need in order to quickly and
accurately make those decisions. Design requirements were then derived from the CTA in order to focus the design cycle. The CTA process and results are highlighted in Chapter 3.
* Objective 2: Develop a HSMM-based operator state decision support tool. The design requirements derived from the CTA were used to design a HSMM-based operator state decision support tool, herein referred to as the DST. The DST takes into account the applicable literature in Chapter 2 and a discussion of the design of the DST is included in Chapter 3.
* Objective 3: Evaluate the effectiveness of the HSMM-based operator state decision support tool in a simulated team supervisory scenario. In order to achieve this objective, a human subject experiment was conducted in which subject performance while using the DST was compared to subject performance in a standard team HSC setting. Details about the design of this experiment are included in Chapter 4. The experimental results and discussion are included in Chapter 5.
1.3
Thesis Organization
This thesis is organized into the following six chapters:
* Chapter 1, Introduction, provides the motivation for this research, problem statement, and research objectives of this thesis.
* Chapter 2, Background, presents the findings of a literature review focused on team monitoring, human behavior pattern recognition and prediction, and the display of probabilistic data. This chapter identifies the current research gap that this thesis addresses.
" Chapter 3, Design of a HSMM-based Operator State Decision Support Tool, explains the method used for developing the DST. The CTA is described, as well as how design requirements (DR) were derived from the process. This chapter then highlights the final design of the DST and describes how the interface meets the design requirements that were derived from the CTA. * Chapter 4, Experimental Evaluation, presents the human subject experiment used to test the
effectiveness of the DST in a simulated team supervisory control scenario. Descriptions of the participants, apparatus, experimental design, and procedure are included.
* Chapter 5, Results and Discussion, explains the results of the experimental evaluation including the dependent variables of Decision Accuracy, Incorrect Interventions, Response Time, Secondary Task Ratio, and subjective feedback.
* Chapter 6, Conclusion, reviews the answers to the research questions, discusses the contribution of this work, suggests design considerations and changes for future iterations of team supervisor DSTs, and identifies areas for future research.
2. Background
This thesis provides a team supervisor of multiple, independent operators with a DST in order to best maintain and improve team performance in a HSC setting. A significant body of research exists on team performance assessment in supervisory control settings, including team monitoring, but no clear consensus has emerged regarding how to do this effectively. Work has also been produced on the topic of human behavior pattern recognition and prediction, as well as human difficulties in understanding probabilistic data. Unfortunately, little literature exists on the topic of providing a team supervisor with real-time team monitoring support in general. No known research discusses the use of probabilistic models to provide team monitoring support, although recent work has focused on providing an individual operator with probabilistic-based decision support in port and littoral zone surveillance (Rhodes, et al., 2009). These areas of research are discussed in more detail below, and the void that exists at the intersection, providing a team supervisor with a DST that utilizes probabilistic operator modeling, is emphasized (Figure 2.1).
Figure 2.1: Literature review visualization
2.1
Team Monitoring
For this thesis, a team is defined as "a distinguishable set of two or more people who interact dynamically, interdependently, and adaptively toward a common and valued goal/object/mission, who have each been assigned specific roles or functions to perform, and who have a limited lifespan of
membership" (Salas, et al., 1992, p. 4). The concept of team members having a common valued goal is critical as it results in team members working together for the completion of that goal and not just out of self-interest. This concept of a common goal leads to team members assisting each other and improving overall team performance as they build a "shared mental model" of the current situation, goal, and team performance (Cannon-Bowers, Salas, & Converse, 1993).
Team monitoring, both from group members monitoring each other and from a team supervisor monitoring the group, has also been shown to improve team performance by helping a group integrate related task activities, identify appropriate interruption opportunities, and notice when a team member requires assistance (Gutwin & Greenberg, 2004; Pinelle, Gutwin, & Greenberg, 2003). While previous literature has indicated that having a constant team monitoring system in place may negatively influence operator behavior (Brewer & Ridgway, 1998; Guerin & Innes, 1993), many fields employ constant monitoring systems, such as ATC, aircraft flight operations, and generally all mission and life-critical HSC settings. Since UV crews and many military operation teams already operate under monitoring systems (DoD, 2007b), it is assumed that the team in the multiple UV scenario posed by this work is not subject to adverse social facilitation influences from a constant monitoring system. Instead, team supervisors must focus on the positive influence they can have on team performance through direct action, as well the establishment of team culture, trust, and dedication. Specifically, for a supervisor monitoring a team, determining the correct timing and number of times to intervene in team behaviors are the key factors to optimizing team performance (Brewer & Ridgway, 1998; Irving, Higgins, & Safayeni,
1986; Mitchell, et al., 2004).
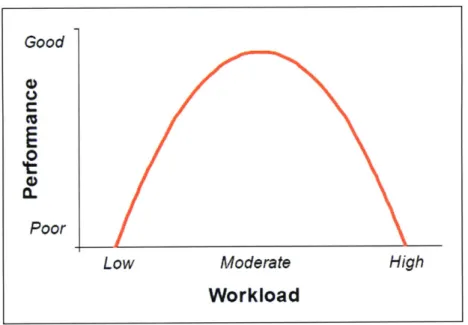
This key decision, deciding when to intervene, is nontrivial. Operator performance is often difficult to infer from only observing physical actions and interactions with a computer interface, which may even be hidden from the team supervisor in HSC settings. The task becomes more difficult when the supervisor must merge information from a variety of sources, often in a time sensitive environment, to evaluate team performance. Due to such a high mental workload, the supervisor is subject to poor performance from operating on the far right side of the Yerkes-Dodson curve shown in Figure 2.2 and may make costly incorrect decisions (Hancock & Warm, 1989; Yerkes & Dodson, 1908). It has been shown that performance significantly degrades when supervisors are tasked beyond 70% utilization, or busy time (Cummings & Guerlain, 2007; Rouse, 1983; Schmidt, 1978). Therefore, the key decision of deciding when to intervene can benefit greatly from the addition of automation to offload some of the mental workload in high workload settings.
Good
Figure 2.2: Yerkes-Dodson Law adapted to performance (Hancock & Warm, 1989)
One way automation can assist the supervisor is through real-time monitoring that provides a better understanding of operator and team performance through the use of a decision support tool, seen as critical in most HSC settings (Mitchell, et al., 2004). Since researchers recognize that the role of the team supervisor can be critical in improving team performance (Burns, 1978; Hackman, 2002), the advancement of supervisor decision support displays may also play a critical role in improving team performance. This advancement carries great significance in real-time complex systems where state monitoring is difficult and incorrect decisions could have catastrophic consequences (Leveson, 1986).
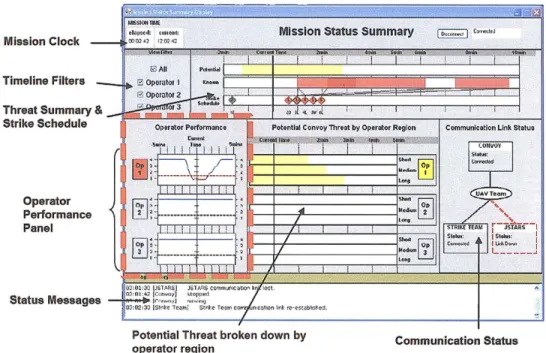
Recent studies that have researched team supervisor interfaces have focused on large-screen situation and activity awareness displays and the design of an Interruption Recovery Assistance display (Scott, et al., 2007; Scott, et al., 2009; Scott, et al., 2008). The Interruption Recovery Assistance display was not shown to have a significant impact on supervisor performance (Scott, et al., 2008), while the large-screen situation and activity awareness displays were shown to have high usability and effectiveness ratings through an exploratory study (Scott, et al., 2009). Of particular interest is the operator performance panel outlined by the red dashed box in Figure 2.3. This continuous operator performance monitoring display was part of a large screen mission status display and served as the original motivation for this thesis. It was used by experimental subjects to aid in the supervision of three simulated operators, each controlling three UVs in order to provide surveillance of a specific area of interest. The operator performance display was based on simple system metrics, such as the number of expected targets in each threat area. Results showed this operator performance panel was useful, and it was hypothesized that team performance could
0 CL
Poor
Low
Moderate
Workload
H igh
benefit from the integration of human behavior pattern recognition and prediction techniques in order to improve this display. Different types of human behavior pattern recognition and prediction techniques, discussed in the next section, were then analyzed in the context of creating a real-time continuous monitoring DST that could improve team performance in HSC settings.
awa em
Mission Status Surnmaryeie
Mission Clock --- 32 ?
I AlPl nta
Timeline Filters - - operatol 1
Threat Summary &
Strike Schedule Operator Performance Potentia Convoy Threat by Operator Reglon Communication Link Status
Operator
Performance
Panel T -ST__ TEA STARS
Oop
p dLAD-1,3!01:42 b o 032 Status Messages
Potential Threat broken down by Communication Status operator region
Figure 2.3: Large-screen mission status display (Scott, et al., 2007; Scott, et al., 2009)
2.2
Human Behavior Pattern Recognition and Prediction
While some work has focused on using pattern recognition techniques for human behaviors such as intrusion detection (Terran, 1999) and navigation (Gardenier, 1981), relatively little work has been done within the HSC realm. Within this domain, human actions have been shown to be appropriately modeled by serial processes because humans can solve only one complex problem at a time (Broadbent, 1958; Nehme, 2009; Welford, 1952). Therefore, such human behavior can be analyzed with time series analysis techniques. This technique departs from previous qualitative methodologies that focus on descriptive models and have no predictive capability (Hackman, 2002; Klein, 1999). The time series analysis techniques are beneficial because they provide a formal, quantitative basis for describing human behavior patterns and for predicting future actions. These techniques are primarily categorized as either statistical
2.2.1 Statistical Learning Techniques
The simplest time series analysis technique belonging to the statistical learning category relies on descriptive statistics of operator behavior (Olson, Herbsleb, & Rueter, 1994). An example is reporting overall mean performance scores for UAV operators without showing how the performance scores changed throughout the mission (Nehme, et al., 2008). Descriptive statistics are useful in the analysis of high level mission performance but do not discriminate the temporal evolution throughout the mission. Other statistical learning techniques are based on complex neural networks that require supervised training (Polvichai, et al., 2006), which is a learning technique where a human has to parse and label operator actions into a priori network outputs. These neural networks tend to have good identification power. Unfortunately, supervised training requires a large amount of prior knowledge about the system as a whole in order to assign a specific network output to a specific behavioral input. An example is the automated written character recognition system the US Postal Service uses to identify hand-written zip codes (LeCun, et al., 1989).
A technique that does not require supervised learning is algorithmic data mining, and it has been used in many domains, such as healthcare, marketing, and fraud detection (Witten & Frank, 2005). The goal of data mining is to find correlation between variables (Kay, et al., 2006). This method is able to parse out common trends from large amounts of data but is computationally intensive and at risk of finding correlation between unrelated parameters. Similar to algorithmic data mining, exploratory sequential data analysis (Sanderson & Fisher, 1994) utilizes data-mining-like techniques with a focus on time series. This approach results in a less computationally intensive method that shares the same major drawback as data mining; there is a non-trivial risk of finding correlation between unrelated parameters. An example of sequential data analysis is an attempt to identify the patterns of behavior in medical students that cause failure in determining a genetic pedigree (Judd & Kennedy, 2004).
When applied specifically to HSC operator modeling, which is the problem at hand, these techniques fall short. They all either require known patterns to analyze incoming data or are exclusively used as post hoc analysis tools. Additionally, all have little predictive power in a sequential, dynamic environment such as multiple operators controlling multiple highly autonomous UVs.
2.2.2 Bayesian Methods
The previous methods all belong to the family of statistical learning techniques in that they do not assume an a priori structure and instead rely solely on describing the human behavior as a set of stochastic
functions (Cucker & Smale, 2002). In contrast, Bayesian methods make the assumption of an underlying structure consisting of states and transitions between those states.' While this assumption restricts the particular form of the model, it also simplifies the formulation of the state space. Three commonly used Bayesian methods used for pattern recognition and prediction are partially observable Markov decision processes (POMDPs) (Sondik, 1971), hidden Markov models (HMI4Ms) (Rabiner & Juang, 1986), and hidden semi-Markov models (HSMMs) (Guedon, 2003). Specifically applied to operator state modeling, POMDPs have proven to be successful for facial and gesture recognition (Sondik, 1971); but this domain is not generally cognitive in nature, and the goal of POMDPs is to compute the optimal policy given the current belief in the environment. HMMs and HSMvs, however, only focus on describing the most likely current belief in the environment and do not search for policy decisions. Additionally, HMMs have been shown to accurately classify and predict hand motions in driving tasks, which is a strong application of monitoring and prediction of sequential data (Pentland & Liu, 1995). In this work, however, the authors had access to the unambiguous ground truth linking the state of the model to the known hand positions. Thus, this method utilizes supervised training which makes it less useful for dynamic environments typical of HSC settings where the definitions of the states of the model are not known a priori (Boussemart, et al., 2009).
A recurring drawback of the previous techniques lies in their requirement of supervised training, a task that is labor intensive and may introduce bias via the human labeling process. However, recent research has shown success in HSC operator modeling with unsupervised learning of HNMs, as well as with model selection techniques that promote model generalizability (Boussemart & Cummings, 2008). Current work on HSMMs has been able to incorporate the temporal component of operator behavior, which was a limitation of using HMMs. It was also proposed and proven that HSMMs can both recognize normal operator behavioral patterns and flag abnormal patterns and events (Huang, 2009).
2.2.3 HSMM-based Operator Modeling
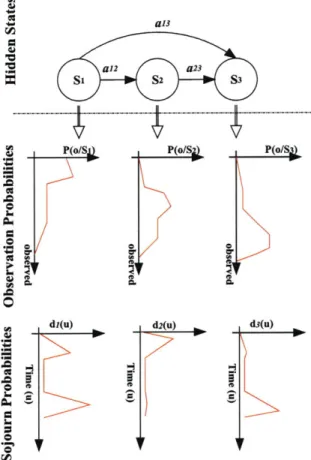
It has been hypothesized that the structure of HSMMs makes them well suited for modeling human behavior (Huang, 2009). Structurally, HSMMs consist of a set of hidden states, observable events, sojourn time, and transition probabilities. In Figure 2.4, each Si is a hidden state, each at; is a transition probability between hidden states, the observable probability density functions P(o/S) link the state and the observable events each hidden state emits, and the sojourn probability density functions di (u) describe the amount of time an operator is likely to stay in each state.
1In this context, a state is defined as the set of partitions of the behavioral space that most likely explain the behaviors seen in the training data.
ai3
PC
an a23
Si S2 S3
0 P(o/SD P(oIS P(oI
W M
di(u) d2(U) d3(U)
PC F
M
Figure 2.4: A three-state hidden semi-Markov model (Castonia, 2010)
Each hidden state emits observable events through a certain probability density function. Just as the hidden states in HSMs must be inferred from observable events, cognitive states of an operator are not directly visible and must be inferred from his or her actions. Therefore, operator cognitive states can be likened to the hidden states in an HSMM, and operator interface interactions, i.e. mouse clicks, can be likened to the HSMM observable events. This structure allows for the prediction of future operator behavior but is limited by the semi-Markov assumption2, by the need for accurate training data in order to ensure the model accurately recognizes the correct patterns, and also by the decrease in confidence in future predictions as the prediction window increases.
2 The semi-Markov assumption states that the transition to the next state is only based on the current state and the amount of time that has been spent in that state.
The complex probabilistic nature of the outputs from these models, and all Markov-based models, results in difficulty in designing a decision support interface for a team supervisor unlikely to possess the background required to understand them. This issue is discussed in the following section.
2.3
Display of Probabilistic Data
It is highly unlikely that a team supervisor in a complex HSC setting, such as the futuristic environment previously described, has the background in probability and modeling needed to understand the raw output from an HSMM-based DST. This is a concern because it has been well established that humans are often biased and subjective when given even simple probabilistic values (Tversky & Kahneman, 1974). Therefore, giving a HSC supervisor the raw probability density functions resulting from a HSMM-based model will likely result in confusion and may result in a negative effect on decision making, especially in time-critical scenarios. Also, the framing and context within which a probability is given to an individual may result in strong optimistic or pessimistic biases for the exact same probability (Tversky & Kahneman, 1981; Weinstein & Klein, 1995). The way in which probabilistic information is displayed, even as simple percentages in deciding whether or not to keep a set amount of money or take a percentage risk for an increased payout, has been shown to significantly affect what decision is made with that information (De Martino, et al., 2006). In a complex monitoring environment, subjects have been shown to completely ignore changes in a priori probabilities of subsystem failures (Kerstholt, et al., 1996). Unfortunately, these types of biases are difficult to remove (Weinstein & Klein, 1995), and thus extreme care must be taken to ensure that probabilistic data is displayed in a manner that reduces the tendency of operators to succumb to these biases.
The information must also be displayed in such a manner that that the supervisor neither blindly follows the algorithm's predictions and recommendations (misuse) nor fully disregards the algorithm's output (disuse) (Dzindolet, et al., 2003; Muir & Moray, 1996; Parasuraman & Riley, 1997). One technique to combat these biases is to provide the supervisor with information about how confident the algorithm is in regard to the given prediction (Bisantz, et al., 2000). This technique is important because the time sensitive nature of a HSC scenario will often require the supervisor to settle for a satisficing strategy as opposed to being able to evaluate all possible options, which will result in decisions being made with incomplete knowledge of the full situation (Gigerenzer & Goldstein, 1996). Misuse or disuse of the algorithm's output could lead to negative effects on decision making in this type of situation and/or further automation bias (Cummings, 2004).
Previous work confirms it is critical that the information be displayed to the supervisor with minimal probabilistic information and in a way that is clear, reduces decision biases, includes confidence in predictions, and promotes quick decision making. Otherwise, the inaccurate and/or biased interpretation of a probabilistic value may result in an incorrect decision with potentially fatal consequences.
2.4
Background Summary
The complex HSC task of supervising a team of multiple, independent operators each controlling multiple, heterogeneous UVs produces a difficult team monitoring scenario. Supervisors of such systems could become quickly overloaded and perform poorly without the aid of automation. One form of assistance is a decision support tool. Specifically, recent advances in operator modeling through HSMM-based behavioral pattern recognition and prediction could provide the algorithms to drive a real-time supervisor's predictive display. However, the difficulty lies in the effective display of the probabilistic output from the HSMM-based operator model since humans have difficulty interpreting and acting on probabilities. This thesis seeks to fill the literature gap that exists at the critical intersection of these three domains: team monitoring, human behavior pattern recognition and prediction, and the display of probabilistic data. The next chapter addresses the design of the HSMM-based operator state decision support tool and the steps taken to address the issues raised in this chapter.
3. Design of a HSMM-based Operator State Decision Support Tool
After reviewing related work, a cognitive task analysis (CTA) was performed in order to generate requirements, both functional and information requirements, for the task of supervising teams of 2-6 operators, each independently controlling a set of highly autonomous UVs (Castonia, 2009). This team size is consistent with literature defining small groups as consisting of 3-7 personnel. The types of interaction that occur with groups of more than 7 people begin to exhibit organizational behavior, as opposed to team behavior (Levine & Moreland, 1998), which is beyond the scope of this thesis. Furthermore, these assumptions on team size are ecologically valid because current UV operations are mostly conducted in teams of three people (DoD, 2007a).After the completion of the CTA, a standard systems engineering design process (Figure 3.1) was used to develop a prototype display. The dashed box in Figure 3.1 highlights the portion of the systems engineering design process, which was the focus of this research and normally occurs in the early aspects of the acquisition phase. The final design is described in this chapter, while the full design process is described in more detail in Castonia (2009).
ACQUISITION PHASE UTILIZATION PHASE
E Conceptual- Detail Design and Production Product Use, Phaseout, and
Preminary Design Development or Construction I
D
Figure 3.1: Systems engineering process (Blanchard & Fabrycky, 1998)
3.1
Cognitive Task Analysis
A CTA is a tool used to analyze and represent the knowledge and cognitive activities needed in complex work domains (Schraagen, Chipman, & Shalin, 2000). Because it was determined that the main purpose of the DST would be to help supervisors determine if and when potentially detrimental problems could occur, the scope of the CTA is relatively narrow, focused primarily on the decision of whether to take action given a model prediction. Furthermore, the process of conducting a more traditional CTA requires access to subject matter experts, documentation, and predecessor systems to gain insight. However, these techniques are not applicable in a futuristic scenario, such as the scenario proposed in this work, where predecessor systems do not exist. The Hybrid CTA (Nehme, et al., 2006) addresses the shortcomings of a
-traditional CTA when dealing with futuristic systems, but given the limited focus of this effort, only decision ladders were used to descriptively model critical decision processes and generate the functional and information requirements. The end result of this CTA is a display requirements checklist (Table 3.1) that details 12 requirements that should be met given DST prototypes with predictive capabilities. Conducting this, and all CTAs, is an iterative process that becomes more refined as more information about the situation becomes available.
3.1.1 Decision Ladders
Decision ladders break decisions down into the important information and information-processing activities required to make a decision. They also help a designer to see the three levels of human behavior hierarchies that exist within a set of tasks: skill-based, rule-based, and knowledge-based behavior (Rasmussen, 1983). Figure 3.2 shows a generic decision ladder with these hierarchy levels.
Knowledge-based domain
Skill-based domain
Figure 3.2: A decision ladder with human behavior heirachies shown (Rasmussen, 1983)
The skill-based level relates to activities that take place without conscious control, which are typically behaviors that have reached a level of automaticity, such as tracking between lane markers while driving. The rule-based level relates to activities that rely on stored rules from prior experience in similar situations, such as looking for yellow or red text to appear on a screen when an alert sounds. The
knowledge-based level relates to higher level decision making resulting from the goals and cues from the environment, such as deciding what UV should be assigned to an emergent target. Each decision ladder includes boxes that portray the information processing activities and ovals that portray the information or knowledge that is produced from the information processing activities.
Given the focus of this research, which is to develop a predictive DST that alerts a supervisor to a possible problem for one or more team members, there are two fundamental decisions:
1. "Is there a problem?"
2. "What should I do to solve the problem?"
A decision ladder was created for each of the two critical decisions, and then functional and information requirements for the DST were derived from the decision ladders. In keeping with the hybrid CTA approach, each decision was represented by two decision ladders (an initial ladder and one augmented with display requirements), provided in Appendices A and B, respectively. These two decisions are detailed below.
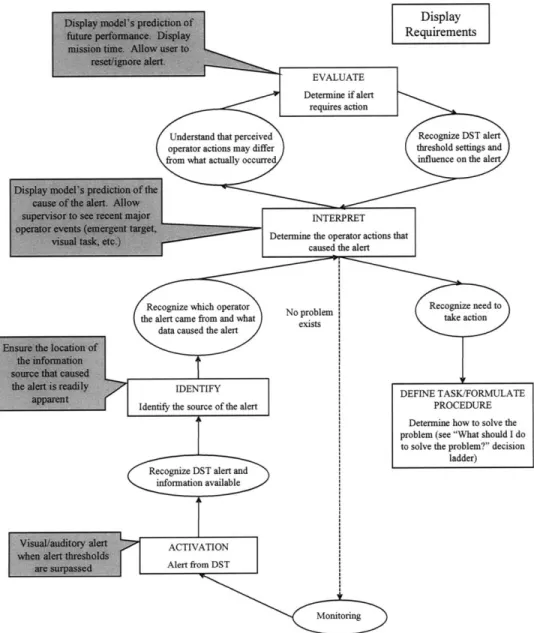
After receiving a visual and/or auditory alert to reference the DST for a possible problem (as determined by the HSMM-based operator model), the first critical decision the supervisor faces is determining if there is actualy a problem. First, the source of the alert must be identified. In order for this to occur, the DST should display the information source that caused the alert so that it is readily apparent to the supervisor. The supervisor must then determine if operator actions caused the alert and if so, which actions. Consequently, the DST should display both what the model infers as the most likely cause of the alert and recent major environmental events, such as emergent targets, visual tasks, etc. that could have triggered the alert. After determining what caused the alert, the supervisor must then decide whether the alert requires action. To aid in this decision, the DST should display the prediction of future model performance to allow the supervisor the ability to develop appropriate confidence in the automation. If the supervisor decides the alert does not require action, then the DST must allow the alert to be easily ignored or reset. If the supervisor decides to change alert threshold levels, then the DST must ensure this is a quick process so that the supervisor can quickly return to monitoring the rest of the team. If the supervisor decides to intervene, then a procedure must be formulated by moving into the "What should I do to solve the problem?" decision ladder (Appendix A).
The second critical decision involves the supervisor determining what must be done to solve the problem. Optimizing the time and frequency the supervisor intervenes are key factors in optimizing team performance (Brewer & Ridgway, 1998; Irving, et al., 1986; Mitchell, et al., 2004). The supervisor must identify possible solutions, such as advising the operator to change tactics, offloading a target and/or UV to another operator, obtaining an additional UVfrom another operator, changing alert threshold levels, or any combination thereof This process should be aided by a DST that allows the supervisor to select the time frame of the data that is shown, including past operator performance levels. This would allow the supervisor to hone in on the information he/she desires. The supervisor is assumed to have the ability to view the operator displays, either remotely or in situ, in order to obtain more detailed information about current operator resources and actions as well as communicate with the operators.
Throughout this entire decision-making process, the supervisor must be aware of how predictions change with passing time. As time passes, the problem may no longer require intervention because the operator may have adjusted his/her behavior accordingly, targets previously identified as hostile may now be confirmed as neutral, etc. Alternatively, the problem may quickly worsen and may require immediate intervention. In that case, the supervisor would have to make a decision quickly, and a less than optimal solution will suffice.
As mentioned earlier, each decision ladder was then used to derive display requirements. Each information processing activity, denoted by a box in the decision ladder, was assessed to determine which functional and information requirements would be necessary to allow the supervisor to obtain the information or knowledge that is contained in the corresponding oval. Figure 3.3 shows the display requirements derived from the first decision ladder. In this example, in order to recognize which operator an alert came from and what data caused the alert, the requirement is that the location of the information source that caused the alert be readily apparent. The completed display requirements for all decision ladders can be found in Appendix B. Note that the display requirements simply identify what information needs to be displayed, not how it will be displayed. The decision of how to display the information is addressed in the conceptual design phase.
"Is there a problem?"
with display requirements for decision support tool
Figure 3.3: Display requirements for the "Is There a Problem?" decision ladder
3.1.2 Display Requirements Checklist
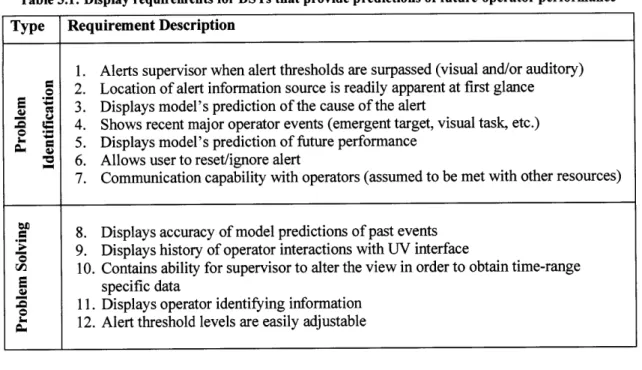
The tangible output from the CTA is the display requirements checklist provided in Table 3.1. It contains 12 different requirements that were obtained through the decision ladder display requirements. These requirements are divided into the problem identification and problem solving categories, which represent
the two primary functions of the DST. This checklist is designed to aid in the development and evaluation of prototype displays for team supervisor DSTs that provide predictions of future operator performance.
Table 3.1: Display requirements for DSTs that provide predictions of future operator performance Type Requirement Description
1. Alerts supervisor when alert thresholds are surpassed (visual and/or auditory)
e 2. Location of alert information source is readily apparent at first glance 3. Displays model's prediction of the cause of the alert
4. Shows recent major operator events (emergent target, visual task, etc.)
5. Displays model's prediction of future performance 3 6. Allows user to reset/ignore alert
7. Communication capability with operators (assumed to be met with other resources)
8. Displays accuracy of model predictions of past events 9. Displays history of operator interactions with UV interface
10. Contains ability for supervisor to alter the view in order to obtain time-range specific data
11. Displays operator identifying information 12. Alert threshold levels are easily adjustable
3.1.3 Cognitive Task Analysis Summary
The complex work domain of a supervisor and team of operators independently controlling multiple, highly autonomous UVs was analyzed through the CTA process described in this section. Specifically, decision ladders were used to generate the functional and informational requirements shown in Table 3.1. While the chosen operator model did not influence the output of the CTA, it greatly affected the way that the requirements generated by the CTA were implemented during the design phase, as described in the
following section.
3.2
HSMM-based Operator State Decision Support Tool
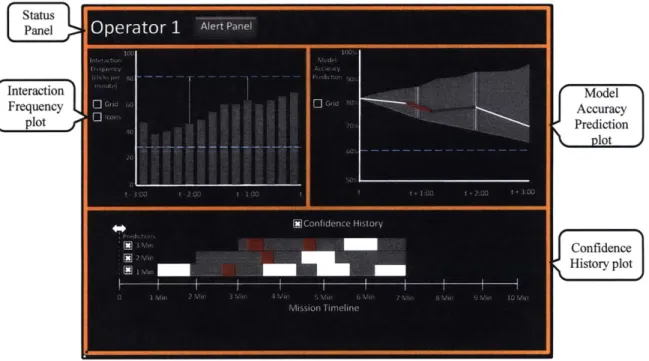
Since the DST is designed as a secondary display in the supervisor's suite of displays, it is designed for a small, possibly portable display with industry standard SXGA resolution (1280 x 1024 pixels). The display requirements checklist in Table 3.1 was used to develop and revise each display revision. Figure 3.4 identifies the four major sections of the DST that will be discussed in this section.
Status Panel Interaction Frequency plot / Model Accuracy Prediction plot Confidence History plot Figure 3.4: DST (Castonia, 2009)
3.2.1 Interaction Frequency Plot
The upper left hand corner of the DST contains the Interaction Frequency plot shown in Figure 3.5.
Historical data for operator clicks per minute are shown as a way to give the supervisor an unprocessed way to infer operator workload (Maule & Hockey, 1993). The horizontal axis ranges from three minutes in the past (t-3:00) to the current time (t). The vertical axis ranges from zero clicks per minute to 100 clicks per minute.
One of the display options for the Interaction Frequency plot is the Icons selection box on the left side of the display. This toggles the display of icons on the Interaction Frequency plot that represent major operator events as seen in Figure 3.6. The use of icons immediately informs the supervisor to the possible cause of a recent increase/decrease in operator interaction frequency. Icons are expected to be useful in helping the supervisor to quickly determine if there is a problem and what must be done in order to solve the problem. Such time savings could be critical in time-pressured situations typical of command and control settings.
Figure 3.6: Interaction Frequency plot with icons shown
Figure 3.7: Interaction frequency plot with icons and grid shown
In an attempt to increase the data-ink ratio (Tufte, 1983), the proportion of the display's ink devoted to the non-redundant display of data-information, unnecessary portions of grid lines and plot outlines are
removed. However, the Grid selection box on the left side of the Interaction Frequency plot allows the supervisor to turn these grid lines and plot outlines back on if he/she wishes (Figure 3.7).
3.2.2 Model Accuracy Prediction Plot
The upper right hand corner of the DST in Figure 3.4 is the Model Accuracy Prediction plot and is the portion of the display that most utilizes the HSMM-based operator model. The HSMM-based model generates transition probabilities between different system states for each instance in time and utilizes those likelihoods, combined with the observed operator actions, to predict the future accuracy of the model and to predict the likelihood of future operator behavior being "normal." The HSMM-based model also provides a prediction as to which operator behavior was deemed to be anomalous by identifying the discrepancies between the expected state transitions and the observed operator actions. This model provides the team supervisor with information about how "normal" the operator behavior is predicted to be, as well as the predicted cause of any alerts that arise from "abnormal" behavior. As a reminder, the HSMM-based model cannot determine whether the abnormal behavior is detrimental.
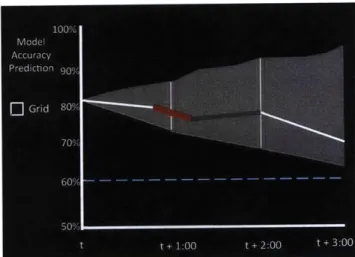
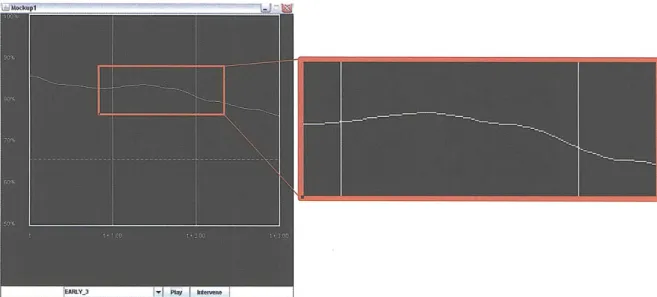
Figure 3.8: Model Accuracy Prediction plot
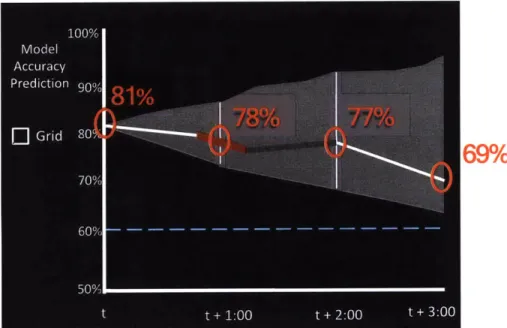
The Model Accuracy Prediction plot (Figure 3.8) incorporates predictions about each future predicted state and the expected duration inclusive of the next three minutes. The horizontal axis ranges from the current time (t) to three minutes in the future (t+3:00). The vertical axis ranges from 50% model accuracy to 100% model accuracy. If the model accuracy prediction is low, then the model is expected to not be able to accurately predict operator behavior and the operator behavior is considered "abnormal." If the model accuracy prediction is high, then the model is expected to predict future operator behavior accurately and the operator behavior is considered "normal." While coding the DST, Huang (2009)
showed that the output of the HSMM-based operator model would require a scoring metric, the Model Accuracy Score (MAS), that represents the current model accuracy based upon the quality and timing of previous predictions. Hypothetical future operator actions are then appended to the current model state and the appropriate future MAS predictions are populated. The MAS takes on values from 50-100, which presents the supervisor with feedback on future prediction accuracy.
The range of possible future model accuracy values, corresponding to the different possible state transitions patterns, is represented by the gray shaded area in Figure 3.8. As expected, the range of possible values, and thus the area of the gray shaded region, increases as the model predicts farther into the future. The white/red/dark gray line represents the midline of the range distribution. When this line drops below a specified threshold, shown by the blue dashed line in Figure 3.8, an alert is triggered. This allows the supervisor to easily see how close the Model Accuracy Prediction is to causing an alert.
While the range and midline of the distribution of model accuracy values are important, so is the confidence the model has in those prediction. This information is available through the color of the midline (Figure 3.8). Each color is mapped to a level of prediction quality: high (white), medium (gray), and low (red). The specific quantities used to classify these three levels depend on the underlying models and supervisor preference. For the given prototype, expected deviations of less than five percent from the midline were mapped to high confidence, expected deviations of five to ten percent from the midline were mapped to medium confidence, and expected deviations of greater than ten percent from the midline were mapped to low confidence. The colors were chosen to reinforce the mental model of white = definite/confident, gray = uncertainty, and red = warning, that is consistent throughout the display, and to ensure the DST can be used by supervisors with red-green color blindness. This color scheme is important since approximately 10% of the male population is color-blind, and 95% of all variations in human color vision involve the red and green receptor in human eyes (Gegenfurtner & Sharpe, 2001). Since an alert is generated when the midline drops below a supervisor-dictated threshold and it is expected that the supervisor will immediately want to know the prediction quality of this alert, this mapping of prediction quality to midline color will result in minimal search time to obtain the relevant data.
While the design for the midline of the model accuracy distribution has always been linear, the actual output from the HSMM-based model is discontinuous horizontal lines. The model output gives the expected amount of time the operator will spend in the current state, the probabilities of moving to each of the other states, and the expected amount of time the operator will spend in each of those states. Therefore, each horizontal line in Figure 3.9 represents the most probable next state, where the length of
each line is the predicted length of time the operator will stay in that state. However, a preliminary experiment was conducted that showed users reported higher understanding and were more confident in the HSMM-based data presented to them in a curvilinear representation (Figure 3.10 or Figure 3.11) than in the discrete representation (Figure 3.9) that is most suitable to the actual model output (Castonia, 2009). Therefore, the DST in Figure 3.4 incorporates a curvilinear representation of the HSMM-based data.
Figure 3.9: Discrete variation of the Model Accuracy Prediction display (Castonia, 2009)