HAL Id: inserm-00443941
https://www.hal.inserm.fr/inserm-00443941
Submitted on 5 Jan 2010HAL is a multi-disciplinary open access
archive for the deposit and dissemination of sci-entific research documents, whether they are pub-lished or not. The documents may come from teaching and research institutions in France or abroad, or from public or private research centers.
L’archive ouverte pluridisciplinaire HAL, est destinée au dépôt et à la diffusion de documents scientifiques de niveau recherche, publiés ou non, émanant des établissements d’enseignement et de recherche français ou étrangers, des laboratoires publics ou privés.
Tuning of the sequence technique.
Dominique Laude, Véronique Baudrie, Jean-Luc Elghozi
To cite this version:
Dominique Laude, Véronique Baudrie, Jean-Luc Elghozi. Tuning of the sequence technique.: Barore-flex in mice. IEEE Engineering in Medicine and Biology Magazine, Institute of Electrical and Elec-tronics Engineers, 2009, 28 (6), pp.30-4. �10.1109/MEMB.2009.934630�. �inserm-00443941�
Tuning of the sequence technique for the assessment of baroreflex function in
mice
D. Laude 1,2,3 V. Baudrie 1,2,3 , and J.-L. Elghozi 1,2,3
1 INSERM, U872, Paris, F-75006 France ;
2 Centre de Recherche des Cordeliers, Université Pierre et Marie Curie – Paris 6, UMR S
872, Paris, F-75006 France ;
3 Université Paris Descartes, UMR S 872, Paris, F-75006 France.
Running title : Baroreflex in mice
Key-words : baroreflex, sequence method, telemetry
Address for correspondence : Dominique Laude,
INSERM U872, Equipe 1, 15 rue de l’Ecole de Médecine, 75006 Paris, France.
Abstract
The sequence method was first described in cats, and applied in different species including humans. Up to now, there is no systematic study of the spontaneous baroreflex sensitivity (BRS) estimated by the sequence method to mice.
This study aimed to characterize the best estimates of BRS using the sequence method, by tuning all the possible parameters. Precisely, the number of beats involved in a sequence, the minimal changes in blood pressure (BP) ramps, or the minimal changes in pulse interval (PI) ramps were considered. Also, the relevance to set a minimal correlation coefficient in the regression line between BP and pulse interval was tested. An important point was the delay to be applied between BP and PI. This delay represents the physiological time for the baroreflex loop to efficiently correct the BP variations.
Telemetry allowed the direct record of BP in different species, including mice. Animals were recorded two weeks after the surgery, allowing a complete recovery. The sequence technique was applied in a 51.2 s time series. Each parameter was successively modified, and the number of sequences and the slope were calculated. Surrogate data were created and compared with the real data.
Most of the sequences found were made of 3 beats. No thresholds in BP or PI were necessary. A delay of 0 or 3 beats between BP and PI should be applied. These parameters should be considered for future studies in mice.
Introduction
The sequence method
The sequence method was first described by Di Rienzo [1]. Concomitant time series of systolic blood pressure (SBP) and pulse interval (PI) were analyzed. The occurrence of spontaneous parallel changes in BP and PI was called “sequences”. The analysis of a 3 hours time series showed several sequences composed of 3 or more beats. The mean slope of all sequences was calculated and reflected the sensitivity of the spontaneous baroreflex (BRS). The baroreflex nature of the sequences was demonstrated by the drastic reduction of the number of sequences after sino-aortic denervation.
One of the complete description of the sequence method was done in unanaesthetized cats [2]. This paper fully described the sequence length, and the optimal parameters that should be set to obtain the best predictor of BRS. The sequences of increase in BP and PI were denominated as “type 1” sequences and the sequence in which BP and PI decreased were denominated as “type 2”. For each sequence the slope and the coefficient of determination of the relationship between BP and PI were calculated. To validate a sequence, the authors suggested to detect sequences of 3 beats or more, with thresholds of 1 mmHg for each BP changes, and thresholds of 4 ms for each PI change. A delay between BP and PI of 1 beat was applied. This means that changes in BP were associated with the changes in the following PI. In those conditions, the average number of sequences of 3 beats was around 650/10000 beats when the number of sequences of 4 beats was around 130/10000 beats. The average slope was around 12 ms/mmHg and 10 ms/mmHg for the sequences of 3 and 4 beats, respectively. The standard deviation (SD) of the slope was around 7 ms/mmHg and 5 ms/mmHg for the sequences of 3 and 4 beats respectively, suggesting a better precision of the BRS when sequences of 4 beats were considered. The number of sequences was strongly reduced when considering longer beat duration. The mean coefficient of determination r²
between individual BP and PI changes was always high, > 0.85 (r>0.92), but no threshold in r² was suggested.
In rats, some studies used the sequence method usually with sequences of 3 beats and more, with or without thresholds in BP or PI or in the coefficient of correlation r [3]. The sequence method was also used in dogs and pigs.
In man, the sequence method was derived from the one applied in cats. Usually, sequences of 3 beats were used [4], whereas some authors applied the sequence method using 4 beats, with thresholds of 1 mmHg and 5 ms [5]. The choice of these strict parameters were chosen to increase the specificity of the assessment of the BRS. In the other hand, these slight differences in methods could lead to analyze a reduced number of sequences, and make difficult the detection of baroreflex deficiency [4]. Also, slight changes in the parameters of the sequence method could lead to huge differences in the estimates of the BRS [4].
Physiological differences exist between species in terms of cardiovascular parameters, respiratory rate or autonomic tone. As an example, a wide range of variation occurred for the heart rate from around 70 bpm for men, to ≈ 100 for dogs, ≈ 160 for cats, ≈ 350 for rats and 400-600 for mice. The breathing frequency is also different in man, dog, and rodents (from 15 cycles/min in humans to 200 cycles/min in mice). These physiological differences may affect estimations of BRS, historically described in cats and man. The methods and values initially described in this species are not necessarily transferable to mice. A validation of the BRS in mice by the sequence method was then necessary.
Tuning of the sequence method in mice.
The sequence method was previously used in mice. The usual parameters were: sequences of 3 beats, with or without thresholds, with a 0 or 1 beat delay for PI, according to the author’s experiences. For example, Gross et al. used only sequences of type 1 (“up sequences”), validated with thresholds of 0.5 mmHg for SBP changes, 5 ms of PI changes, and if the
relationship between SBP and PI in each sequence was > 0.85. The delay between SBP and PI was set to 1 beat [6]. The subsequent BRS was 2.1 ms/mmHg.
It appeared necessary to perform a systematic study of the sequence method in mice. Precisely, several questions should be considered to optimize and apply the sequence method in mice:
- What is the composition of a sequence: 3 beats, 4 beats, or more ? - What is the optimal delay between SBP and PI ?
- Which thresholds should be applied (in terms of minimal changes in SBP and PI) to validate a sequence ?
- Is a minimal coefficient of correlation (r) required to validate a sequence?
All these questions were studied in mice equipped with a telemetric system. Surrogate data were generated from the original time series. The results obtained with the surrogate data were compared with the results obtained with the original data.
Material and methods
Surgery
Eight male mice (C57Bl/6 strain) were implanted with a BP telemeter (model TA11PA-C10, Data Sciences International, St. Paul, MN, USA). Mice were anesthetized initially with 5% isoflurane in an oxygen stream and maintained on 2-3 % isoflurane. The catheter was inserted into the left common carotid artery with the tip in the aortic arch and the telemetric transmitter probe was positioned subcutaneously on the right flank. This procedure was prefered to aortic catheterization in order to minimize the surgical procedure and then facilitate the recovery process. Telemetry allowed the recording of the direct carotid BP waveform, sampled at 1000 Hz, in free awake mice. Recordings were obtained during the
morning, when the mice were generally quiet. Each session included a control 30-min recording [7].
Telemetry acquisition
The complete procedure was previously described [7]. Briefly, the telemetered signal was digitized at a rate of 1000 Hz. Systolic blood pressure was derived from the BP waveform, on a beat-by-beat basis. Pulse Interval was calculated as the time period between two dBP/dtmax points. Each recording was visualized to select one period of 51.2 s without artefacts or abrupt changes in BP or PI induced by animal movements. Each animal was recorded 5 times, at 48 - 72 hours intervals. The estimates of BRS (number of sequences, slope) were averaged from the 5 data segments, then the mean of the n=8 mice were calculated.
Surrogate data
Surrogate data were created and compared to the original data. The original SBP and PI data were randomly distributed and the calculations were performed both with the original and the surrogate data. The surrogate data created had the same mean and variance than the original data, but not the same power spectra. As the sequence method is a time series analysis by nature, it was not necessary to keep the same power spectra in the surrogate data.
Statistics
Results are expressed as mean ± sem.
The comparison between original data and surrogate data were estimated using a paired t-test.
Results
Average levels of resting BP and heart rate were: 112. ± 2.4 mmHg, 83.4 ± 2.1 mmHg ; and 420 ± 11 bpm (or 147 ± 4 ms) for SBP, diastolic BP and heart rate (or PI), respectively.
Composition of the sequences.
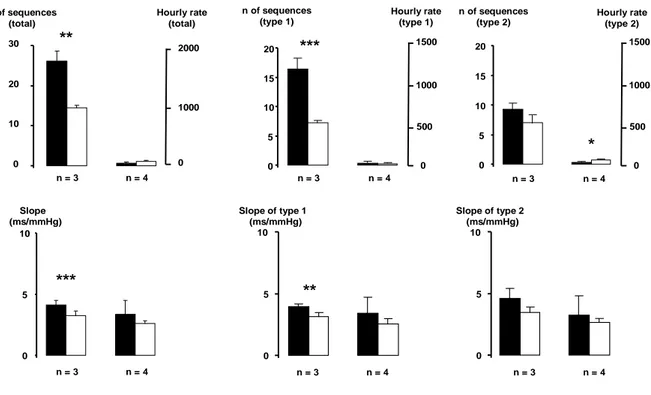
In the 51.2 s time series studied, several sequences of at least 3 beats were found. Fig. 1 shows that most sequences were made of 3 consecutive beats (25.7 ± 2.4 sequences, corresponding to 97.2 ± 0.67 % of the total number of sequences). Few sequences of 4 beats were observed (0.6 ± 0.2 sequences, corresponding to 2.4 ± 0.4 % of the total number of sequences). The number of sequences with 5 beats or more was negligible. For the sequences composed of 3 beats, the average number of sequences was 16.4 (hourly rate: 1153 sequences/hour) for the type 1 and 9.3 (hourly rate: 654 sequences/hour) for the type 2. Slopes obtained with both types of sequences were equivalent, with a mean slope of 4.1 ± 0.4 ms/mmHg.
Surrogate data showed a number of sequences of 3 beats of 14.2 ± 0.7 sequences (hourly rate: 998 sequences/hour). The total number of sequences of 3 beats found in the original data were significantly different from the number of sequences of 3 beats derived from the surrogate data (p<0.001).
The precision of the slope was expressed as its SD. For the sequences of 3 beats, the SD was 1.1 ms/mmHg, and for sequences of 4 beats, SD was 3.1 ms/mm Hg.
Effect of a delay between BP and PI.
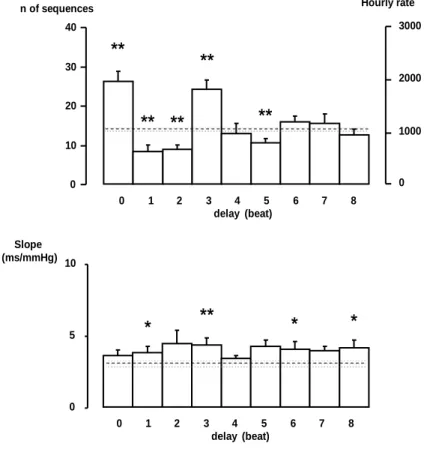
The number of sequences shows variation when a delay in PI was induced (Fig2). The number of sequences and gain vary cyclically with a period of 3 beats (about 0.44 s) and dampen with increased delays For the sequence method, randomized data showed a constant number of sequences (15.4 ± 0.26, hourly rate: 1082 ± 18.3 sequences/hour) with no effect of the delay and a constant slope of 3.3 ± 0.12 ms/mmHg. Original data exhibited a significantly higher number of sequences (P<0.01) for the delay of 0 and 3 beats, and a higher slope for the delay of 1 beat (P<0.05) and 3 beats (P<0.01), when compared to surrogate data.
Effect of thresholds in BP, PI and r
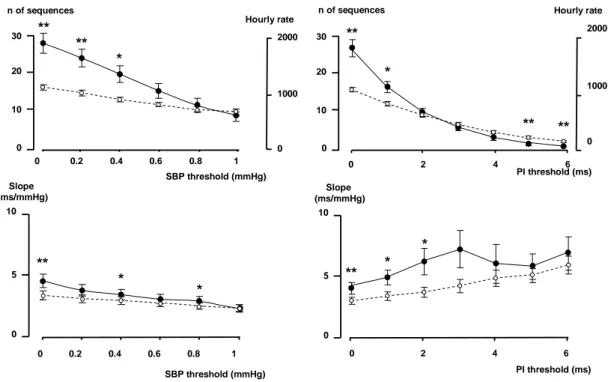
Thresholds from 0 to 1 mmHg, in steps of 0.2 mmHg were applied for each BP changes to validate a sequence. Thresholds in PI were also applied, from 0 to 6 ms in steps of 1 ms for each PI changes to validate a sequence. The number of sequences (or the hourly rate) dramatically decreased when a threshold in BP or PI was applied (Fig 3). The number of real sequences was no more greater than the number of surrogate sequences when the PI thresholds was > 1 ms or the SBP threshold > 0.4 mmHg.
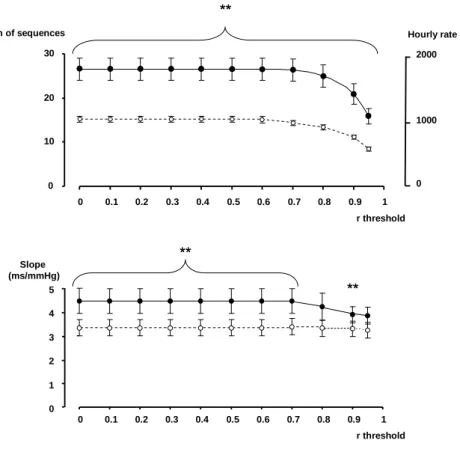
Thresholds for the correlation coefficient between BP and PI were applied, from 0 to 0.95, in steps of 0.05. The number of sequences, or the hourly rate and the slope remained stable with a r < 0.75, then a decrease in the number of sequences detected, and in the level of the slope appeared at values of r > 0.8.
Data Summary
Using the following parameters:
- sequences of 3 beats or more, sequences of type 1 and type 2 combined - no thresholds in SBP or PI,
- no thresholds in r, - delay in PI of 3 beats
the average number of sequences found in the 51.2 s time series (n=8) was: 26.5 ± 2.6, corresponding to an hourly rate of 1864 ± 181 sequences / hour, the average r was 0.93 ± 0.01 and the average slope was 4.4 ± 0.5 ms/mmHg. With these parameters, surrogate data showed a number of sequences of 15.2 ± 0.7, corresponding to an hourly rate of 1069 ± 49 sequences/hour, an average r of 0.92 ± 0.003, and an average slope of 3.3 ± 0.3 ms/mmHg.
Discrepancies between techniques used to quantify BRS in mice with the sequence method rendered necessary an extensive and systematic study of this method. This study illustrates the applicability of the sequence method used to estimate BRS in mice. The analysis of surrogate data indicated that the spontaneous interactions of SBP and PI are not just random interactions.
The telemetric procedure used allowed the recording of BP in freely moving animals. The telemetry permits long time BP measurements, and allows a recovery period of enough duration (2 weeks for this study). In those conditions, the animals were acclimatized to their housing conditions and recorded during a resting period. This is illustrated by a reduced heart rate of 418 beats/min (or a corresponding PI of 147 ms). These conditions favour an enhanced vagal activity, and a reduced sympathetic activity.
The major finding of this study was the optimization of the parameters of the sequence methods.
First, the sequence technique should be applied with a 3 beat delay between BP and PI. This delay, corresponding to 0.5 s, was close to the phase found with a cross spectral analysis [8]. This delay could correspond to the physiological time of the baroreflex loop to correct fluctuations in BP. It is noteworthy that a high number of sequences was also observed with a delay of 0 beat. Only the delays of 0 or 3 beats showed higher number of sequences than the surrogate data, and only the delay of 3 beats showed a higher slope than surrogate data. In this study, with a basal heart rate of 418 beats/min, the delay of 3 beats corresponded to a time delay of around 430 ms. This delay can correspond to a number of beats of 4 or 5 with a faster heart rate, such as the active state of the animals. A specific study during sympathetic activation should be made to calculate this delay in those specific conditions. As an alternative, it is possible to consider a 0 beat delay, leading also to a high number of
sequences with a similar slope. In this latter condition, there was no need to adapt the number of beats to the basal heart rate.
Second, sequences of three beats or more should be considered. Most of the sequences found in the time series were composed of three beats. (96 % of the total number of sequences). Only few longer sequences were found (2 % for sequences of 4 beats, 1 % for sequences of 5 beats or more). The slopes obtained with sequences of 3 or 4 beats were comparable and no benefit was demonstrated in the precision of the slope (illustrated by the SD of the slope) of the BRS. This is a key point as historical descriptions in cats and humans [2,5] suggested the use of sequences of 4 beats because the precision of the slope was better with this parameter. It seems from this present study that it was necessary in mice to include sequences of 3 beats (and more).
Third, no thresholds in minimal changes in BP or PI were necessary to validate a sequence. The use of thresholds in BP or PI led to dramatic decreases in the number of sequences detected, without benefits in the precision of the BRS. Also, the use of thresholds in the coefficient of correlation between SBP and PI in individual sequences was not necessary. Furthermore, it has been pointed out that the loss of a numerous number of sequences with the use of too strict parameters could limit the application of the sequence method especially when the baroreflex impairment reduce per se the number of sequences [9]. It is noticeable that surrogate data exhibited a non negligible number of sequences, with roughly the same slope as original data. This indicates that around half of the sequences may be due to random fluctuations. This should be take into account when other estimations of baroreflex are calculated, such as the baroreflex effectiveness index, which could overestimate the occurrence of random sequences not driven by the baroreflex [10].
The sequence method should be used in mice, considering sequences of 3 beats or more, with a delay of 0 or 3 beats. Thresholds for the coefficient of correlation, SBP or PI were unnecessary. These parameters should be applied for future studies in mice.
References
[1] M. Di Rienzo, G. Bertinieri, G. Mancia, A. Pedotti, “A new method for evaluating the baroreflex role by a joint pattern analysis of pulse interval and systolic blood pressure series,” Med. Biol. Eng. Comput., 23 (suppl. I), 313-314, 1985.
[2] G. Bertinieri, M. Di Rienzo, A. Cavallazzi, A. Ferrari, A. Pedotti, G. Mancia, “Evaluation of baroreceptor reflex by blood pressure monitoring in unasthetized cats,” Am.
J. Physiol. 254, H377-H383, 1988.
[3] H. M. Stauss, D.A. Morgan, K.E. Anderson, M.P. Massett, K.C. Kregel, “Modulation of barorefelx sensitivity and spectral power of blood pressure by heat stress and aging,” Am. J.
Physiol. Heart Circ. Physiol., 272 : H776-H784, 1997.
[4] D. Laude, J.-L. Elghozi, A. Girard, E. Bellard, M. Bouhaddi, P. Castiglioni, C. Cerutti, A. Cividjian, M. Di Rienzo, J.O. Fortrat, B. Janssen, J.M. Karemaker, G. Leftheriotis, G. Parati, P.B. Persson, A. Porta, L. Quintin, J. Regnard, H. Rudiger, H.M. Stauss, “Comparison of various techniques used to estimate spontaneous baroreflex sensitivity (the EuroBaVar study),” Am. J. Physiol. Regul. Integr. Comp. Physiol., 286: R226-R231, 2004.
[5] G. Parati, M. Di Rienzo, G. Mancia, “How to measure baroreflex sensitivity : from the cardiovascular laboratory to daily life,” J. Hyper, 18: 7-19, 2000.
[6] V. Gross, R. Plehm, J. Tank, J. Jordan, A. Diedrich, M. Obst, F. Luft, “Heart rate variability and baroreflex function in AT2 receptor-disrupted mice,” Hypertension, 40:207-213, 2002.
[7] V. Baudrie, D. Laude, J.-L. Elghozi, “Optimal frequency ranges for extracting
information on cardiovascular autonomic control from the blood pressure and pulse interval spectrograms in mice,” Am. J. Physiol. Regul. Integr. Comp. Physiol., 292: R904-R912, 2007.
[8] D. Laude, V. Baudrie, J.-L. Elghozi, “Applicability of recent methods used to estimate spontaneous baroreflex sensitivity to resting mice,” Am. J. Physiol. Regul. Integr. Comp.
Physiol., 294, R142-R150, 2008.
[9] D. Ziegler, D.Laude, F. Akila, J.-L. Elghozi, “Time- and frequency-domain estimation of early diabetic cardiovascular autonomic neuropathy,” Clin. Auton. Res., 11: 369-376, 2001.
[10] M. Di Rienzo, G. Parati, P. Castiglioni, R. Tordi, G. Mancia, A. Pedotti, “Baroreflex effectiveness index: an additional measure of baroreflex control of heart rate in daily life”,
Legends to figures
Figure 1
Composition of the sequences detected in a 51.2 s time series. Full histogram: original data. Open histogram: surrogate data. * p<0.05, ** p<0.01, *** p<0.001, , original data vs surrogate data.
Figure 2
Effects of introducing a delay between SBP and PI on the number of sequences detected and the slope. Dotted line represents the mean values, and the gray bar represents the mean value ± sem of the surrogate data. * p<0.05, **p<0.01, *** p<0.001, original data vs surrogate data.
Figure 3
Effects of introducing a threshold in SBP (left pannel) or in PI (right panel) on the number of sequences and the slope. Full dots: original data, open dots: surrogate data. *p<0.05, **p<0.01, ***p<0.001, original data vs surrogate data.
Figure 4
Effetcs of introducing a threshold in the correlation coefficient between SBP and PI. Full dots: original data, open dots: surrogate data. * p<0.05, **p<0.01, ***p<0.001, , original data vs surrogate data.
Figure 1 n = 3 n = 4 0 10 20 30 n of sequences (total) 0 1000 2000 Hourly rate (total) 0 5 10 15 20 n = 3 n = 4 0 1000 1500 500 n of sequences (type 1) Hourly rate (type 1) 0 5 10 15 20 n = 3 n = 4 0 1000 1500 500 n of sequences (type 2) Hourly rate (type 2) 0 5 10 Slope (ms/mmHg) n = 3 n = 4 0 5 10 Slope of type 1 (ms/mmHg) n = 3 n = 4 0 5 10 Slope of type 2 (ms/mmHg) n = 3 n = 4 ** *** *** ** *
Figure 2 0 10 20 30 40 n of sequences 0 1 2 3 4 5 6 7 8 delay (beat) 3000 0 1000 2000 Hourly rate 0 5 10 Slope (ms/mmHg) 0 1 2 3 4 5 6 7 8 delay (beat) ** ** ** ** ** ** * * *
Figure 3 SBP threshold (mmHg) 0 0.2 0.4 0.6 0.8 1 0 1000 2000 Hourly rate 0 0.2 0.4 0.6 0.8 1 SBP threshold (mmHg) Slope (ms/mmHg) n of sequences 0 2 4 6 0 1000 2000 Hourly rate n of sequences PI threshold (ms) 0 5 10 0 2 4 6 PI threshold (ms) Slope (ms/mmHg) ** ** * ** * ** ** ** * ** * * * 0 5 10 0 10 20 30 0 10 20 30
Figure 4 0 10 20 30 0 0.1 0.2 0.3 0.4 0.5 0.6 0.7 0.8 0.9 1 n of sequences r threshold 0 1000 2000 Hourly rate ** 0 1 2 3 4 5 0 0.1 0.2 0.3 0.4 0.5 0.6 0.7 0.8 0.9 1 r threshold Slope (ms/mmHg) ** **