Response of Sphagnum Peatland Testate Amoebae to a 1-Year
Transplantation Experiment Along an Artificial
Hydrological Gradient
Katarzyna Marcisz&Bertrand Fournier&Daniel Gilbert& Mariusz Lamentowicz&Edward A. D. Mitchell
Abstract Peatland testate amoebae (TA) are well-established bioindicators for depth to water table (DWT), but effects of hydrological changes on TA communities have never been tested experimentally. We tested this in a field experiment by placing Sphagnum carpets (15 cm diameter) collected in hum-mock, lawn and pool microsites (origin) at three local conditions (dry, moist and wet) using trenches dug in a peatland. One series of samples was seeded with microorgan-ism extract from all microsites. TA community were analysed at T0: 8–2008, T1: 5–2009 and T2: 8–2009. We analysed the data using conditional inference trees, principal response curves (PRC) and DWT inferred from TA communities using a transfer function used for paleoecological reconstruction. Density declined from T0 to T1 and then increased sharply by T2. Species richness, Simpson diversity and Simpson evenness were lower at T2 than at T0 and T1. Seeded com-munities had higher species richness in pool samples at T0.
Pool samples tended to have higher density, lower species richness, Simpson diversity and Simpson Evenness than hum-mock and/or lawn samples until T1. In the PRC, the effect of origin was significant at T0 and T1, but the effect faded away by T2. Seeding effect was strongest at T1 and lowest vanished by T2. Local condition effect was strong but not in line with the wetness gradient at T1 but started to reflect it by T2. Likewise, TA-inferred DWT started to match the experimental conditions by T2, but more so in hummock and lawn samples than in pool samples. This study confirmed that TA responds to hydrological changes over a 1-year period. However, sen-sitivity of TA to hydrological fluctuations, and thus the accu-racy of inferred DWT changes, was habitat specific, pool TA communities being least responsive to environmental changes. Lawns and hummocks may be thus better suited than pools for paleoecological reconstructions. This, however, contrasts with the higher prediction error and species’ tolerance for DWT with increasing dryness observed in transfer function models.
Introduction
Peatlands are key ecosystems in the global carbon cycle. Covering 3 % of world’s land area, they contain 30 % of all global soil carbon [1]. Northern Hemisphere Sphagnum-dom-inated peatlands cover vast surfaces of North America and Eurasia. They are nevertheless among the most vulnerable ecosystems to global warming [2]. Drought [3] can also potentially feedback positively to warming by causing losses of C as CO2 and CH4 [4, 5].
Understanding peatland response to ongoing climate change is therefore crucial for improving global climate projections. Moreover, by providing archives of past environmental and specially hydrological changes [6], peatlands represent key ecosystems to understand the long-term impact of climate change.
K. Marcisz (*)
:
M. LamentowiczDepartment of Biogeography and Palaeoecology, Adam Mickiewicz University in Poznań, Dzięgielowa 27, 61-680 Poznań, Poland e-mail: [email protected]
K. Marcisz
:
M. LamentowiczLaboratory of Wetland Ecology and Monitoring, Adam Mickiewicz University in Poznań, Dzięgielowa 27, 61-680 Poznań, Poland B. Fournier
:
E. A. D. MitchellLaboratory of Soil Biology, University of Neuchâtel, Rue Emile-Argand 11, 2000 Neuchâtel, Switzerland D. Gilbert
Laboratoire de Chrono-environment, UMR 6249 CNRS, Université de Franche-Comté, 16 route de Gray, 25030 Besancon Cedex, France
Testate amoebae (TA) are common protozoa in Sphagnum peatlands. As top predators within microbial food webs, they have a direct impact on the functioning of theses ecosystems [7]. Moreover, TA produce decay-resistant shells that are commonly used to reconstruct past peatland hydrology (usu-ally water table depth) [8–10], as well as trophic status [11]. These paleo-reconstructions include periods such as the me-dieval climate anomaly analogous to the current increase in extreme events [12] providing essential information about ecosystems’ response to global change. The use of TA in palaeoecology as well as biomonitoring [13–15] is, however, based solely on descriptive studies of current patterns of community composition along hydrological gradients from which transfer functions are developed and subsequently used for palaeoecological reconstructions.
Only few experimental studies have so far been done on TA. Lousier manipulated soil moisture in the Rocky Mountain aspen woodland and showed that increased soil moisture is significantly correlated with the total number of living TA individuals [16, 17]. Beyens and co-workers [18] assessed the response of testate amoebae to soil temperature and precipita-tion manipulations. Long-term field warming and precipita-tion manipulation experiments under sub-arctic conditions revealed stronger warming effects in the growing season than in winter [19, 20]. TA abundance and community structure were also shown to respond to peatland drainage [21, 22]. However, experimental approaches investigating the response of testate amoebae to changes in hydrological conditions are lacking.
The aim of the study was to assess the response of TA communities to changes in water table depth in a transplanta-tion experiment simulating hydrological changes. Moss patches collected in hummocks, lawns and pools (origin) were transplanted to wet, moist or dry position in a semi-controlled setting in a peatland in the French Jura Mountains. Pooled microbial communities extracted from the three original hab-itats (i.e. hummocks, lawns and pools) were added to a second set of samples to provide the full potential community. We hypothesised that (1) transplantation effects on TA community structure would be strongest in the most contrasted situations (i.e. transplanting mosses from pool to dry position and the other way around) and (2) the effect of the origin would fade away with time as the TA communities adapt to the experi-mental position; in parallel to this the DWT inferred from communities would initially match the origin position and would then gradually match the experimental position over time. With respect to seeding with mixed communities the two alternative hypotheses were that DWT inferred from seeded communities could change either faster or slower than non-seeded communities to match the conditions of the experi-mental position. A faster response would be predicted based on the fact that seeding provided dry as well as wet indicators. If species poorly adapted to the new conditions die rapidly
while the better-adapted ones develop faster, inferred DWT would more rapidly match the experimental conditions. Alternatively, according to the insurance hypothesis [23, 24], adding mixed communities may provide a much more diverse (taxonomically and functionally) community, which would adapt less rapidly to changing conditions.
Methods Study Site
Le Russey is a cutover oligotrophic bog, located in the French Jura Mountains at 820 m a.s.l. (coordinates: 47°10′43.65″ N; 6°47′24.71″ E, Fig. 1). The local climate is characterised by mountain, oceanic and continental influences [25]. The vege-tation is dominated by Sphagnum capillifolium, Sphagnum
fallax, Carex rostrata, Vaccinium uliginosum,
Vaccinium oxycoccos, Eriophorum angustifolium, Eriophorum vaginatum, Calluna vulgaris and Polytrichum strictum. T h i s site was intensively exploited for peat extraction between 1968 and 1984. Currently the bog covers approximately 27 ha [25]. The study was conducted in the western, formerly exploited, part of the peatland, where three trenches were dug out as a part of a former experiment [26].
Field Experiment
The experiment was conducted on three trenches (A–C; Fig. 1), which were dug out to create a gradient of hydrolog-ical conditions used in a former study [26]. In each trench, poly(vinyl chloride) collars about 15 cm diameter and 10 cm in length were placed at the surface of the trenches along three lines (referred to as “position”: dry, moist and wet), six collars on each line.
Fig. 1 Study site in Le Russey Bog, French Jura. The picture shows one of the three experimental trenches. Green collars contain the transplanted Sphagnum patches (shown in the inset) placed along lines corresponding to dry, moist and wet situation
Sphagnum plugs of the exact same size as the collars were collected on the same peatland from three habitats referred to as“origin”: pools (S. fallax; origin P), lawns (S. fallax; origin L) and hummocks (S. capillifolium; origin H), and placed in plastic collars in the trenches (two per origin per line, with randomised positions) (Fig. 1, inset). Pools were composed of S. fallax and C. rostrata. Lawns contained S. fallax, S. capillifolium (isolated individuals), V. oxycoccos, C. rostrata, and E. vaginatum. Hummocks were dominated by S. capillifolium, Polytrichum strictum, Calluna vulgaris and V. uliginosum. The average depth to water table was 34.4, 16.0 and 6.0 cm in the hummock, lawn and pool habitats, respec-tively, on the day the Sphagnum plugs were harvested. Two sets of collars were set up. One of these was “seeded” with pooled extract from the three same habitats in order to provide the full potential community from the onset of the experiment. This extract was obtained by washing hummock, lawn and pool Sphagnum in bog water in a large bucket. A 250-ml volume of this extract was slowly poured over each patch. The experiment thus consisted of 54 different Sphagnum plots (3 origins×3 local conditions×2 initial community manipu-lation (seeding)×3 replicates) (experimental trenches, see Supplementary Table 1 for details).
Moss samples were collected from the collars with transplanted Sphagnum three times over a 1-year period: in August 2008 (T0), May 2009 (T1) and August 2009 (T2). Sphagnum samples were placed in 4 % glutaraldehyde and stored at 4 °C in the dark to allow separating living and encysted from dead testate amoebae [27].
Depth to water table (DWT) was recorded at each sampling time in piezometers inserted at both ends of each line to determine the actual DWT influencing the communities in the moss carpets. As the height of the moss carpets changed over time due to moss growth and decomposition, we record-ed the difference between the top of the moss carpet and the peat to obtain an individual DWT value for each plot. The average DWT in the experimental plots over the three sam-pling periods was 31.8 cm in the dry position, 19.5 in the moist position and 9.0 in the wet position, thus approximately matching the contrasts of the habitats of origin.
Laboratory Analyses
Testate amoebae were extracted from Sphagnum following the method described by Booth et al. [28] and Jassey [29]. Coarse materials were removed using a 300-μm m e s h s i z e , a n d t h e filtrate analysed for TA. Lycopodium tablets were added to samples for density calculations [30]. Shells were counted at ×200 and ×400 magnification and identified at the highest taxonomic resolution using several keys and taxonomic monographs [31–35]. We recorded living (active+encysted) and dead amoebae separately, aiming for a total of 100 living individuals per sample. Only data on living individuals was
used in the analyses. The >300μm fraction of the Sphagnum samples were dried at 60 °C for 24 h and weighed to express density on a dry weight basis.
Numerical Analyses
We first assessed the impact of the treatments on testate amoeba total density, species richness, Simpson diversity (N2) and Evenness (E2) (Hill). We described the changes of these indices (1) between seeded and non-seeded plots, (2) among origins, (3) among position and (4) over time. Given the broad temporal window between two sampling sessions and the relative short generation time (about 1 week of TA [36]), we considered here time as a factor and analysed it alongside treatment variables. Conditional Inference Trees (CIT)—a method that uses binary recursive partitioning [37]—were constructed for each index in order to characterise the responses of TA diversity indices to the treatments (origin, position, and community manipulations) and to temporal changes. CIT allow identifying which descriptive variables contribute most to data structure through permutation-based significance tests.
We then assessed the impact over time of origin, commu-nity manipulation (seeding) and position (local condition) o n the structure of TA communities (percentage data) using prin-cipal response curves (PRC), a variant of redundancy analyses specially designed for repeated observation designs [38]. TA percentage community data was Hellinger transformed prior to analyses [39]. PRCs were computed separately for the different treatments (origin, community and position). This allowed us to assess the direction and magnitude of responses of TA species to each treatment.
We hypothesized that the DWT inferred from TA commu-nities should gradually fit the experimental conditions (local conditions) as the species adapt to the new situation. To test this, we calculated the DWT inferred from the TA communi-ties using an existing transfer function from the Swiss Alps [40]. We chose the transfer function from the Swiss Alps rather than a more local one from the Jura Mountains [41] a s the Alpine data set is larger. Model performance was assessed using root mean squared error of prediction, average bias, maximum bias, and the correlation between observed and predicted values as assessed by bootstrap cross-validation [42]. For the comparison of the best performing, weighted averaging model (WA) was used. DWT was inferred from TA communities of different origins (hummock, lawn and pool) placed at different positions (D, dry; M, moist; W, wet) sam-pled at T0 (August 2008), T1 (May 2009) and T2 (August 2009), and either seeded or not.
All analyses were done using R [43] and the packages “vegan” [44] a n d “party” [37], except for the transfer function calculations that were performed with the software C2 [45].
Results
Testate Amoeba Community Composition
We recorded 40 living testate amoeba taxa in the 162 samples (Supplementary Table 2). Overall, Archerella flavum and Hyalosphenia papilio dominated the community and together accounted for 58.4 % of the total TA community. Assulina seminulum, Assulina muscorum, Nebela tincta, Nebela militaris, Corythion dubium, Euglypha compressa, Euglypha tuberculata, and Hylosphenia elegans each contributed on average to >1 % and together accounted for an additional 34.1 % of the community. Overall, A. flavum and H. papilio were co-dominant at T0 in seeded and non-seeded plots, but seeding reduced the contribution of A. flavum to the commu-nity (seeded: A. flavum=19.5 % and H. papilio=34.2 %, non-seeded: 30 and 29.2 %, respectively). By T1 seeding effect on A. flavum reverted: its relative abundance declined to 15 % in non-seeded communities but increased slightly in seeded plots (22.9 %) while H. papilio remained dominant in both (32.9 and 29.2 % in seeded and non-seeded, respectively). By T2 communities shifted to a strong dominance of A. flavum (63.2 and 64.3 % in seeded and non-seeded, respectively), while H. papilio decreased sharply (5 and 4.1 %).
Testate Amoeba Density and Taxonomic Diversities
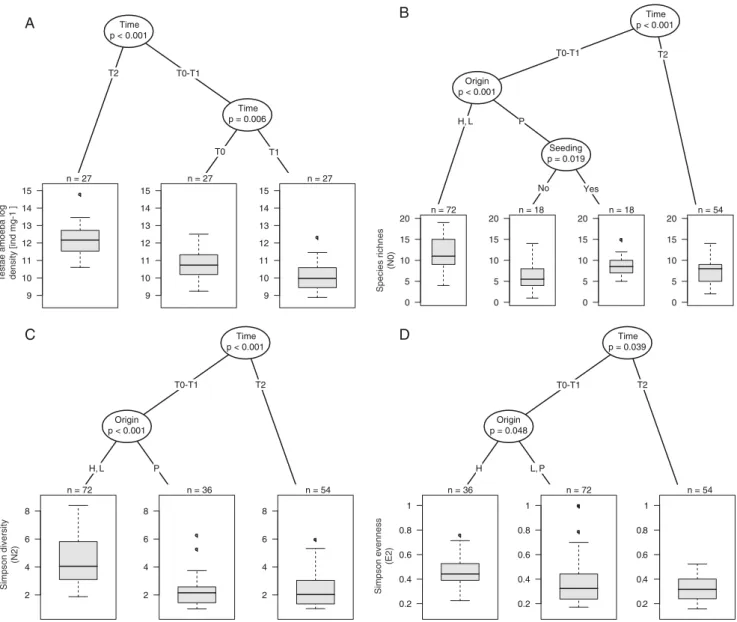
Total testate amoeba density ranged from 7.16 to 71.2 indi-v i d u a l s p e r m i l l i g r a m d r y w e i g h t o f S p h a g n u m (Supplementary Table 3). Density was significantly higher at T2 than at T0 and T1 and decreased between T0 and T1, regardless of community manipulation, origin or position (Fig. 2a). Species richness varied in relation to time with significant effects of origin and seeding at T0 and T1 (Fig. 2b). At T0 and T1 species richness was higher in samples from hummocks and lawns. In samples transplanted from pools, seeding resulted in a significant increase in species richness. Simpson diversity showed a similar pattern to spe-cies richness (Fig. 2c). However, seeding did not result in a significant increase in pools at T0. Simpson evenness also differed in relation to time and origin being higher at T0 and T1 than at T2 (Fig. 2d). At T0 and T1, samples originating from hummocks had significantly higher evenness values than samples from pools and lawns where the mixotrophic species H. papilio and A. flavum strongly dominated the community. Responses of Community Composition to Treatments and Inferred DWT Over Time
The three PRC models (Fig. 3) showed that origin and, to a lesser extent, community manipulations significantly impact-ed testate amoeba community composition (respectively 17 and 3 % of variance explained, p=0.005 and 0.044). Contrary
to expectation, both effects peaked at T1 rather than T0. However, in line with our hypothesis, the effects of commu-nity manipulation (seeding/non-seeding) and transplantation disappeared at T2. Although the communities in the wet position diverged from those in the other two situations from T1 onwards, the overall PRC model for local condition was not significant. However, individual RDA with measured DWT, origin and seeding as explanatory variables showed that the effect of local condition on the communities became significant by T2 (adjusted R2=8.4 %, p value for variable “DWT”=0.002; Supplementary Table 4).
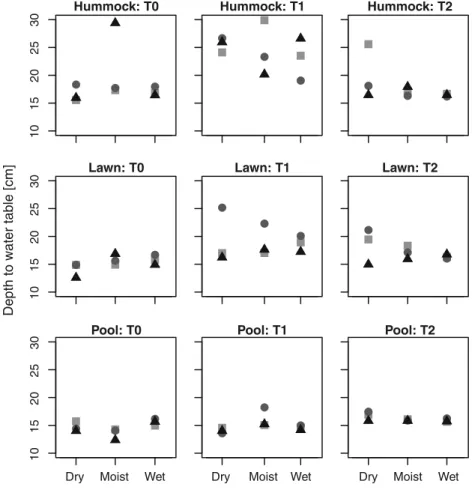
Inferred DWT values differed strongly from values mea-sured in the experimental trenches at T0 and increasingly fitted the local conditions over time for all transplanted sam-ples, in the seeded as well as non-seeded plots (Fig. 4, Supplementary Fig. 4). Inferred DWT increased between T0 and T1 and decreased between T1 and T2. These trends were clearest in samples collected in hummocks, relatively marked in samples from lawns and almost non-existent in pool sam-ples, and were more marked in non-seeded than in seeded plots. Inferred DWT was on average lower (i.e. wetter) in seeded plots at T0 and T1, indicating that seeding favoured “wet indicators”, and the range of inferred DWT was lower in seeded plots (13.5–25.5 cm in non-seeded vs. 12.2–19.4 cm in seeded plots).
Discussion
Effects of Hydrological Changes
This is the first experimental study testing the effect of hydro-logical changes on testate amoeba communities in Sphagnum peatlands. Given the well-established relationship between TA communities and DWT in peatlands and other experimen-tal evidence for rapid responses to moisture manipulation [16, 17], we expected to see a clear DWT effect on communities, which would also be reflected by clear shifts in TA-inferred DWT. We hypothesised that TA community structure would change most quickly and clearly in contrasted situations, that the effect of the origin would decline over time and that inferred DWT would gradually match that of the local condi-tions. Our results partly supported these hypotheses. Although TA community structure changed, these changes were not clearer in more contrasted transitions. An important result, however, is that hummock communities changed more than pool communities, suggesting that TA communities from dry microsites may be more sensitive to micro-environmental changes than pool communities, possibly because they con-tain a broader mix of dry and wet indicators than wetter microsites. This result could be seen as counter-intuitive given results from transfer-function models, which regularly show better predictive power at the wet end of the hydrological
gradient while DWT beyond about 30 cm cannot be reliably predicted [41, 46]. However, we tested the effect of increased wetness on hummock communities and not the effect of extreme drought; it is therefore likely that an extreme drought experiment would not reveal clear TA community changes. A recent experimental study simulating increased rainfall mag-nitude, intensity and frequency on Sphagnum fuscum-domi-nated vegetation at Abisko (Northern Sweden) also yielded unexpected results [47]. Contrary to expectation the density of hygrophilous taxa such as A. flavum and H. papilio decreased, possibly due to changes or fluctuation in water chemistry (the simulated rain was achieved using stream water with a near-neutral pH as opposed to the likely very acidic pH in the S. fuscum mosses) and/or prey or food items.
Effects of Origin and Seeding
Contrary to our expectation, the effect of origin remained significant until the end of the experiment. This suggests that the original community signature remained significant in our study despite the contrasted experimental water table positions imposed to the communities. This could suggest a tighter than expected relationship between TA communities and Sphagnum species (e.g. suggesting possibly chemical effects related to compounds released by the mosses) or the structure of the moss carpet (i.e. microclimatic effects overriding the DWT effect).
Seeding significantly affected community composition at T0 and even more so at T1, but this effect had disappeared by
Time p = 0.039 T2 Origin p = 0.048 H L, P n = 36 0.2 0.4 0.6 0.8 1 n = 72 0.2 0.4 0.6 0.8 1 n = 54 0.2 0.4 0.6 0.8 1 T0-T1 Simpson evenness (E2) Time p < 0.001 T0-T1 T2 Origin p < 0.001 H, L P n = 72 2 4 6 8 n = 36 2 4 6 8 n = 54 2 4 6 8 Simpson diversity (N2) Time p < 0.001 T2 Origin p < 0.001 H, L P n = 72 0 5 10 15 20 Seeding p = 0.019 No n = 18 0 5 10 15 20 n = 18 0 5 10 15 20 n = 54 0 5 10 15 20 T0-T1 Yes Species richnes (N0) Time p < 0.001 T0-T1 n = 27 9 10 11 12 13 14 15 Time p = 0.006 n = 27 9 10 11 12 13 14 15 n = 27 9 10 11 12 13 14 15 T2 T0 T1 T
estae amoeba log density [ind mg-1 ]
B A
D C
Fig. 2 Conditional inference trees assessing the impact of community manipulations (seeded vs. non-seeded; Seeding), transplantations from different habitats (hummocks, lawns and pools; Origin), to different local hydric conditions (dry, moist, wet; Local conditions) and seasonal chang-es (T0, August 2008; T1, May 2009; and T2, August 2009) on tchang-estate
amoeba density and diversity (i.e. species richness, Simpson diversity and evenness) in the experimental plots of Le Russey bog, French Jura. p values are given below variable names. Boxplots show the distribution of response variables per groups; n indicates the number of observations within each group
T2 (Figs. 3 and 4, S u p p l e m e n t a r y F i g . 4). This suggests that, although we had added a considerable amount of microorgan-isms in the seeded plots, this effect was not a lasting one. The effect of seeding brings partial support to both the hypothesis of a faster response of enhanced communities as well as the insurance hypothesis. Indeed in hummock and lawn samples seeding reduced the contrasts between dry and wet local position at T2, in agreement with the insurance hypothesis. However the opposite is true for pool samples. This suggests
that pool communities lacked dry indicators at T0 and there-fore that seeding allowed these communities to shift faster over time and to reflect the local hydrology.
General Stress Response
Species richness, Simpson diversity and evenness decreased over the course of the experiment (Supplementary Figs. 1–3). This suggests that, within the timeframe of the experiment, the
10 15 20 25 30 10 15 20 25 30 10 15 20 25 30
Depth to water table [cm]
Wet Moist
Dry Dry Moist Wet Dry Moist Wet
Hummock: T0 Hummock: T1 Hummock: T2
Lawn: T0 Lawn: T1 Lawn: T2
Pool: T0 Pool: T1 Pool: T2
Fig. 4 Depth to water table (DWT, in cm) inferred (using the transfer function model from Engadine [40]) from testate amoeba communities of different origins (hummock, lawn and pool) placed in different local conditions (D dry, M moist, W wet) and sampled at T0 (August 2008), T1 (May 2009) and T2 (August 2009) in the
experimental plots of Le Russey bog, French Jura. Average measured DWT was 31.8, 19.5 and 9.0 cm in the dry, moist and wet positions, respectively. Data from non-seeded communities (see Supplementary Figure 4 for corresponding figure showing seeded community data). The symbols represent the different replicates Relative Impact −0.2 0.0 0.2 0.4 0 .6
Community manipulations (seeded or not)
T0 T1 T2 Time EUGCIL EUGSTR NEBFLA NEBTINMAJ EUGSP NEBBOH EUGROT ARCROT CYCEUR DIFELE DIFSP CENAER ASSSEM ARCDIS SPHFIS HYAPAP ARCFLA Treatments: Non-seeded Seeded P-value = 0.044 R2 = 0.03 −0.5 0.0 0 .5 1.0
Origin (hummocks, lawns and pools)
ASSSEM EUGSTR ARCFLA SPHFIS EUGSP EUGROT NEBBOH CYCEUR DIFELE DIFSP ARCROT NEBTINMAJ CENAER NEBFLA EUGCIL ARCDIS HYAPAP Treatments: Hummocks Lawns Pools T0 T1 T2 Time P-value = 0.005 R2 = 0.17 −0.8 −0.6 −0.4 −0.2 0.0
Local hydric conditions (dry, moist, wet)
ARCFLA ASSSEM HYAPAP SPHFIS NEBFLA ARCROT CYCEUR DIFELE DIFSP EUGSTR CENAER EUGSP NEBBOH NEBTINMAJ ARCDIS EUGCIL EUGROT T0 T1 T2 Time Treatments: Dry Moist Wet Non-significant
Fig. 3 Principal response curves assessing the impact over time of habitat of origin (hummocks, lawns and pools; Origin), community manipulations (seeded vs. non-seeded; Seeding), local hydric conditions
(dry, moist, wet; Local conditions) on testate amoeba community struc-ture in the experimental plots of Le Russey bog, French Jura. Species scores are displayed on the right vertical axis
stress caused by the experiment (manipulation of the moss carpet and changes in DWT) could not be compensated by immigration of new species (potentially better adapted to the new conditions and absent from the original samples) and that the seeding effect did not last beyond T1 (i.e. May, end of winter—9 months after the beginning of the experiment). Our experimental setup might have caused too much stress on the moss and microbial communities to allow the expected chang-es to occur. Further experiments will be needed to better understand the precise mechanism influencing Sphagnum TA communities.
A somewhat striking and counter-intuitive pattern is the drier inferred conditions at T1 (i.e. higher DWT values), in non-seeded hummock plots. T1 corresponds to the spring sampling and thus reflects the treatment effects over the end of summer, autumn, winter and early spring. This counter-intuitive result may be explained by the capacity of hum-mock Sphagnum to retain relatively high moisture content thanks to the tight structure of the moss carpet and efficient capillarity. Under natural conditions, moisture conditions can indeed vary more in pools than in hummocks [48]. Thus although pools are generally wetter, in extreme dry periods they can dry out. By contrast Sphagnum species that build hummocks (e.g. S. fuscum, S. capillifolium) are able to main-tain stable moist conditions [49] even when the water table is low. We would therefore have expected lawn and pool com-munities to be more strongly affected by lowered water table. However, our results rather show that hummock communi-ties were more affected by the experimental manipulation than lawn and pool communities at T1. We interpret this as being due to the disruption of the tight hummock moss carpet structure. Indeed, although the size of the experimental plots were large by microbial standards (15 cm diameter and 10 cm high) and we sampled the plugs carefully to maintain the structure of the moss carpet, this size may not have been large enough to allow the mosses to maintain their moisture during dry periods. Indeed, we observed that the hummock moss carpets suffered from drought effects and their tight structure was lost over the course of the experiment. This result is in line with the lower density observed at T1 as compared to T0 and T2 (Fig. 2a). By T2, however, pool (seeded and non-seeded) and seeded lawn communities indi-cated significantly lower water table than at T0 but this was not the case for hummock communities and non-seeded lawn communities. This suggests that TA species indicative for wet conditions on average tolerated the experimental condi-tions less well than drier indicators. This interpretation there-fore suggests that hummock Sphagnum mosses are less tol-erant to disturbance and this in turn affects TA communities, while in the case of TA, lowest tolerance to disturbance is observed among pool species. These contradictory results would explain the lack of clear overall response to local hydrological conditions (Fig. 1c).
Implications for Bioindication and Paleoecology
Testate amoeba analysis is now a well-established tool for palaeo-hydrological reconstructions [40, 50, 51]. However, beyond major differences among micro-habitats (e.g. pool-hummock gradient), the spatial and seasonal patterns of TA density, diversity and community structure and their response to micro-environmental changes remain poorly understood. Our results suggest that DWT changes may not affect TA communities in the same way in hummocks than in lawns or pools. This is an important issue in case of the past water table depth reconstructions and interpretation of palaeo-hydrological changes, as when describing data obtained from peat cores, it is essential to apply reliable testing sets based on detailed infor-mation about species-environment relations. Our results sug-gest that lawns and hummocks are better suited than hollows and pools for palaeohydrological reconstruction. This contrasts with the higher prediction error and species’ tolerance for DWT with increasing dryness observed in transfer function models. However, the specific experimental conditions (e.g., disruption of the moss carpet structure) might have affected TA commu-nities. Further work is necessary to better interpret past changes in TA communities and thus to improve the accuracy of palaeo-environmental reconstruction. Such work is necessary to better interpret past changes in TA communities and thus to improve the accuracy of palaeo-environmental reconstruction.
Acknowledgements This project was supported by funding to EADM
by the Swiss NSF projects nos. 205321-109709/1 and 205321-109709/2, to ML by the Foundation for Polish Science (FNP) (Outgoing Fellowship KOLUMB) and grant no. PSPB-013/2010 from Switzerland through the Swiss Contribution to the enlarged European Union. We thank Andy Siegenthaler and Alexandre Buttler for their input to this experiment. Open Access This article is distributed under the terms of the Creative Commons Attribution License which permits any use, distribution, and reproduction in any medium, provided the original author(s) and the source are credited.
References
1. Parish F, Sirin A, Charman DJ, Joosten H, Minayeva T, Silvius M, Stringer L (2008) Assessment on peatlands, biodiversity and climate change: main report. Global Environment Centre, Kuala Lumpur and Wetlands International, Wageningen, 179 pp
2. Vasander H, Kettunen A (2006) Carbon in boreal peatlands. In: Wieder, RK, Vitt, DH (eds.) Boreal peatland ecosystems. Springer, pp. 165–194
3. Erwin KL (2009) Wetlands and global climate change: the role of wetland restoration in a changing world. Wetl Ecol Manag 17:71–84 4. Yu Z (2006) Holocene carbon accumulation of fen peatlands in boreal western Canada: a complex ecosystem response to climate variation
and disturbance. Ecosystems 9:1278–1288
5. Limpens J, Berendse F, Blodau C, Canadell JG, Freeman C, Holden J, Roulet N, Rydin H, Schaepman-Strub G (2008) Peatlands and the carbon cycle: from local processes to global implications—a synthe-sis. Biogeosci Discuss 5:1379–1419
6. Belyea LR, Malmer N (2004) Carbon sequestration in peatland: patterns and mechanisms of response to climate change. Glob
Chang Biol 10:1043–1052
7. Jassey VEJ, Chiapusio G, Binet P, Buttler A, Laggoun-Defarge F, Delarue F, Bernard N, Mitchell EAD, Toussaint M-L, Francez A-J, Gilbert D (2013) Above- and belowground linkages in Sphagnum peatland: climate warming affects plant–microbial interactions. Glob
Chang Biol 19:811–823
8. Hendon D, Charman DJ, Kent M (2001) Palaeohydrological records derived from testate amoebae analysis from peatlands in northern England: within-site variability, between-site comparability and palaeoclimatic implications. The Holocene 11:127–148
9. Mitchell EAD, Payne RJ, Lamentowicz M (2008) Potential implica-tions of differential preservation of testate amoebae shells for paleoenvironmental reconstruction in peatlands. J Paleolimnol 40: 603–618
10. Lamentowicz M, Cedro A, Gałka M, Goslar T, Miotk-Szpiganowicz G , M i t c h e l l E A D , P a w l y t a J ( 2 0 0 8 ) L a s t m i l l e n n i u m palaeoenvironmental changes from a Baltic bog (Poland) inferred from stable isotopes, pollen, plant macrofossils and testate amoebae. Palaeogeogr Palaeoclimatol Palaeoecol 265:93–106
11. Lamentowicz M, Lamentowicz L, Payne R (2013) Towards quanti-tative reconstruction of peatland nutrient status from fens. The Holocene 23:1659–1663
12. Booth RK, Jackson ST, Sousa VA, Sullivan ME, Minckley TA, Clifford MJ (2012) Multi-decadal drought and amplified moisture variability drove rapid forest community change in a humid region. Ecology 93:219–226
13. Laggoun-Défarge F, Mitchell E, Gilbert D, Disnar J-R, Comont L, Warner BG, Buttler A (2008) Cut-over peatland regeneration assess-ment using organic matter and microbial indicators (bacteria and testate amoebae). J Appl Ecol 45:716–727
14. Booth RK (2002) Testate amoebae as paleoindicators of surface-moisture changes on Michigan peatlands: modern ecology and hy-drological calibration. J Paleolimnol 28:329–348
15. Davis SR, Wilkinson DM (2004) The conservation management value of testate amoebae as‘restoration’ indicators: speculations based on two damaged raised mires in northwest England. The Holocene 14:135–143 16. Lousier JD (1974) Effects of experimental soil moisture fluctuations
on turnover rates of Testacea. Soil Biol Biochem 6:19–26
17. Lousier JD (1974) Response of soil Testacea to soil moisture fluctu-ations. Soil Biol Biochem 6:235–239
18. Beyens L, Ledeganck P, Graae BJ, Nijs I (2009) Are soil biota
buffered against climatic extremes? An experimental test on testate amoebae in arctic tundra (Qeqertarsuaq, West Greenland). Polar Biol 32:453–462. doi:10.1007/s00300-008-0540-y
19. Tsyganov AN, Aerts R, Nijs I, Cornelissen JHC, Beyens L (2012) Sphagnum-dwelling testate amoebae in subarctic bogs are more sensitive to soil warming in the growing season than in winter: the results of eight-year field climate manipulations. Protist 400–414 20. Tsyganov AN, Nijs I, Beyens L (2011) Does climate warming
stimulate or inhibit soil Protist communities? A test on testate amoe-bae in high-arctic tundra with free-air temperature increase. Protist
162:237–248
21. Warner BG, Chmielewski JG (1992) Testate amoebae (Protozoa) as indicators of drainage in a forested mire, Northern Ontario, Canada.
Arch Protistenkd 141:179–183
22. Talbot J, Richard PJH, Roulet NT, Booth RK (2010) Assessing long-term hydrological and ecological responses to drainage in a rised bog usin paleoecology and a hydrosequence. J Veg Sci 21:143–156 23. Naeem S, Li S (1997) Biodiversity enhances ecosystem reliability.
Nature 390:507–509
24. Yachi S, Loreau M (1999) Biodiversity and ecosystem productivity in a fluctuating environment: the insurance hypothesis. Proc Natl
Acad Sci 96:1463–1468
25. Comont L, Laggoun-Défarge F, Disnar JR (2006) Evolution of organic matter indicators in response to major environmental chang-es: the case of a formerly cut-over peat bog (Le Russey, Jura
Mountains, France). Org Geochem 37:1736–1751
26. Chapman S, Buttler A, Francez A-J, Laggoun-Défarge F, Vasander H, Schloter M, Combe J, Grosvernier P, Harms H, Epron D, Gilbert D, Mitchell EAD (2003) Commercial exploitation of peatlands and
maintenance of biodiversity – A conflict between economy and
ecology. Front Ecol Environ 1:525–532
27. Hebert PDN, Penton EH, Burns JM, Janzen DH, Hallwachs W (2004) The species in one: DNA barcoding reveals cryptic species in the neotropical skipper butterfly Astraptes flugerator. Proc Natl Acad Sci U S A 10:14812–14817
28. Booth RK, Sullivan ME, Sousa VA (2008) Ecology of testate
amoe-bae in a North Carolina pocosin and their potential use as environ-mental and paleoenvironmental indicators. Ecoscience 15:277–289. doi:10.2980/15-2-3111
29. Jassey VEJ, Chiapusio G, Mitchell EAD, Binet P, Toussaint ML, Gilbert D (2010) Fine-scale horizontal and vertical micro-distribution patterns of Testate amoebae along a narrow fen/bog gradient. Microb Ecol 62:374–385
30. Harper JT, Gile GH, James ER, Carpenter KJ, Keeling PJ (2009) The inadequacy of morphology for species and genus delineation in microbial eukaryotes: an example from the parabasalian termite symbiont Coronympha. PLoS ONE 4(8):e6577
31. Ogden CG (1980) Notes on some Difflugiidae from Norfolk (Rhizopodea, Protozoa). Bull Brit Mus (Nat Hist) Zool 39:125–138 32. Ogden CG, Hedley RH (1980) An atlas of freshwater testate amoe-bae. British Museum (Natural History) and Oxford University Press, London
33. Meisterfeld R (2001) Testate amoebae. In: Costello, MJ, Emblow, CS, White, R (eds) Patrimoines Naturels. Muséum National d’Histoire Naturelle—Institut d’Ecologie et de Gestion de la Biodiversité (I.E.G.B.)—Service du Patrimoine Naturel (S.P.N.), pp. 54–57
34. Clarke KJ (2003) Guide to identification of soil protozoa—Testate amoebae. Freshwater Biological Association, Ambleside
35. Mazei YA, Tsyganov AN, Bubnova OA (2007) Structure of a com-munity of testate amoebae in a Sphagnum dominated bog in upper sura flow (Middle Volga Territory). Biol Bull 34:382–394
36. Schönborn W (1986) Population dynamics and production biology of Testate amoebae (Rhizopoda, Testacea) in raw humus of two Coniferous Forest Soils1). Arch Protistenkd 132:325–342
37. Hothorn T, Hornik K, Zeileis A (2006) Unbiased recursive partitioning: a conditional inference framework. J Comput Graph Stat 15:651–674
38. Van Den Brink PJ, Ter Braak CJF (1999) Principal response curves: analysis of time-dependent multivariate responses of biological
com-munity stress. Environ Toxicol Chem 18:138–148
39. Legendre P, Gallagher ED (2001) Ecologically meaningful transfor-mations for ordination of species data. Oecologia 129:271–280 40. Lamentowicz M, Van der Knaap WO, Lamentowicz L, Van Leeuwen
JFN, Mitchell EAD, Goslar T, Kamenik C (2010) A near-annual palaeohydrological study based on testate amoebae from a sub-alpine mire: surface wetness and the role of climate during the instrumental period. J Quat Sci 25:190–202
41. Mitchell EAD, Buttler AJ, Warner BG, Gobat JM (1999) Ecology of testate amoebae (Protozoa : Rhizopoda) in Sphagnum peatlands in the Jura mountains, Switzerland and France. Ecoscience 6:565–576 42. Crowley PH (1992) Resampling methods for data analysis in
computation-intensive ecology and evolution. Annu Rev Ecol Syst
23:405–447
43. R Development Core Team (2006) R: a language and environment
for statistical computing. R Foundation for Statistical Computing, Vienna. http://www.R-project.org
44. Oksanen J, Blanchet FG, Kindt R, Legendre P, O’Hara RG, Simpson GL, Solymos P, Stevens MHH, Wagner H (2010) vegan: Community Ecology Package
45. Juggins S (2003) C2 User guide. Software for ecological and palaeoecological data analysis and visualisation. University of Newcastle, Newcastle upon Tyne
46. Lamentowicz M, Mitchell EAD (2005) The ecology of testate amoe-bae (Protists) in Sphagnum in north-western Poland in relation to peatland ecology. Microb Ecol 50:48–63
47. Tsyganov AN, Keuper F, Aerts R, Beyens L (2013) Flourish or flush:
effects of simulated extreme rainfall events on sphagnum-dwelling testate amoebae in a Subarctic Bog (Abisko, Sweden). Microb Ecol 65:101–110. doi:10.1007/s00248-012-0115-x
48. Vitt DH, Weider K (2008) The structure and function of bryophyte-dominated peatlands. In: Goffinet B, Shaw AJ (eds) Bryophyte
biol-ogy, 2nd edn. Cambridge University Press, Cambridge, pp 357–391
49. Rydin H (1985) Effect of water level on desiccation of Sphagnum in relation to surrounding Sphagna. Oikos 45:374–379
50. Swindles GT, Plunkett G, Roe HM (2007) A multiproxy climate record from a raised bog in County Fermanagh, Northern Ireland: a critical examination of the link between
bog surface wetness and solar variability. J Quat Sci 22:667–
679
51. Mitchell EAD, Charman DJ, Warner BG (2008) Testate amoebae analysis in ecological and paleoecological studies of wetlands: past, present and future. Biodivers Conserv 17
![Fig. 1), which were dug out to create a gradient of hydrolog-ical conditions used in a former study [26]](https://thumb-eu.123doks.com/thumbv2/123doknet/15024315.684605/2.892.459.816.770.1007/fig-create-gradient-hydrolog-ical-conditions-used-study.webp)