HAL Id: hal-03101805
https://hal.archives-ouvertes.fr/hal-03101805
Submitted on 11 Jan 2021
HAL is a multi-disciplinary open access
archive for the deposit and dissemination of
sci-entific research documents, whether they are
pub-lished or not. The documents may come from
teaching and research institutions in France or
abroad, or from public or private research centers.
L’archive ouverte pluridisciplinaire HAL, est
destinée au dépôt et à la diffusion de documents
scientifiques de niveau recherche, publiés ou non,
émanant des établissements d’enseignement et de
recherche français ou étrangers, des laboratoires
publics ou privés.
Distributed under a Creative Commons Attribution| 4.0 International License
replication origin activity
Paulina Prorok, Marie Artufel, Antoine Aze, Philippe Coulombe, Isabelle
Peiffer, Laurent Lacroix, Aurore Guédin, Jean-Louis Mergny, Julia
Damaschke, Aloys Schepers, et al.
To cite this version:
Paulina Prorok, Marie Artufel, Antoine Aze, Philippe Coulombe, Isabelle Peiffer, et al.. Involvement
of G-quadruplex regions in mammalian replication origin activity. Nature Communications, Nature
Publishing Group, 2019, 10 (1), pp.3274. �10.1038/s41467-019-11104-0�. �hal-03101805�
Involvement of G-quadruplex regions in
mammalian replication origin activity
Paulina Prorok
1
, Marie Artufel
2,10
, Antoine Aze
1,10
, Philippe Coulombe
1,10
, Isabelle Peiffer
1
, Laurent Lacroix
3
,
Aurore Guédin
4
, Jean-Louis Mergny
4,5
, Julia Damaschke
6
, Aloys Schepers
6,7
, Christelle Cayrou
1,9
,
Marie-Paule Teulade-Fichou
8
, Benoit Ballester
2
& Marcel Méchali
1
Genome-wide studies of DNA replication origins revealed that origins preferentially associate
with an Origin G-rich Repeated Element (OGRE), potentially forming G-quadruplexes (G4).
Here, we functionally address their requirements for DNA replication initiation in a series
of independent approaches. Deletion of the OGRE/G4 sequence strongly decreased the
corresponding origin activity. Conversely, the insertion of an OGRE/G4 element created a
new replication origin. This element also promoted replication of episomal EBV vectors
lacking the viral origin, but not if the OGRE/G4 sequence was deleted. A potent G4 ligand,
PhenDC3, stabilized G4s but did not alter the global origin activity. However, a set of new,
G4-associated origins was created, whereas suppressed origins were largely G4-free. In vitro
Xenopus laevis replication systems showed that OGRE/G4 sequences are involved in the
activation of DNA replication, but not in the pre-replication complex formation. Altogether,
these results converge to the functional importance of OGRE/G4 elements in DNA
replication initiation.
https://doi.org/10.1038/s41467-019-11104-0
OPEN
1Institute of Human Genetics, CNRS-University of Montpellier, 141 rue de la Cardonille, 34396 Montpellier, France.2Aix Marseille Univ, INSERM, TAGC,
Marseille, France.3Balasubramanian group, Department of Chemistry, University of Cambridge, Lensfield Road, Cambridge CB2 1EW, UK.4ARNA Laboratory, Université de Bordeaux, Inserm U1212, CNRS UMR5320, Institut Européen de Chimie Biologie (IECB), Pessac 33607, France.5Institut Curie,
CNRS UMR9187, Inserm U1196, Universite Paris Saclay, Orsay, France.6Research Unit Gene Vectors, Helmholtz Zentrum München (GmbH), German Research Center for Environmental Health, Marchioninistraße 25, 81377 Munich, Germany.7Monoclonal Antibody Core Facility & Research Group, Institute for Diabetes and Obesity, Helmholtz Zentrum München, Ingolstädter Landstrasse, 85764 Neuherberg, Germany.8CMIB Laboratory, Institut Curie, Campus
Universitaire, Bat 110, 91405 Orsay, France.9Present address: Centre de Recherche en Cancérologie de Marseille 27 Boulevard Lei Roure, 13273 Marseille,
France.10These authors contributed equally: Marie Artufel, Antoine Aze, Philippe Coulombe. Correspondence and requests for materials should be addressed
to B.B. (email:benoit.ballester@inserm.fr) or to M.M. (email:marcel.mechali@igh.cnrs.fr)
123456789
I
n mammals, around 100,000 potential DNA replication
ori-gins (oriori-gins throughout the text) are distributed along
chro-mosomes. However, only about 30% is activated in a cell, in an
apparent stochastic way. This
flexibility in origin choice is
con-sidered an important feature for the robustness of DNA
repli-cation, and for the adaptation to DNA replication stress and cell
fates (for a review)
1. The second main feature of metazoan origins
is their sequence plasticity. Indeed, differently from
Sacchar-omyces cerevisiae origins, metazoan origins do not have a unique
conserved consensus element. Some genetic and epigenetic
characteristics have been identified in the vicinity of origins, but
none can be considered to be a universal feature of metazoan
origins. Among these features, the Origin G-rich Repeated
Element (OGRE) is present in more than 60% of origins, in
fly,
mouse, and human cells
2–6. This element can potentially form a
G quadruplex (G4) structure (thereafter, such sequence elements
are defined as OGRE/G4), and it is upstream of the initiation site
(IS) of DNA synthesis, at an average distance of 250–300 bp.
This localization could be compatible with the position of the
pre-replication complex (pre-RC), and is associated with a
nucleosome-free region
4. The presence of similar elements at
human origins has been detected using a different method than
those used for mouse
2,6and chicken cells
7, and it was shown that
proteins involved in DNA synthesis initiation, ORC
8, MTBP
9and
MCM2–7
10are also associated to such elements. A functional
evidence for the use of this element was reported in chicken cells
in a 1.1 kb fragment of the
β-globin replication origin flanked by
an HS4 insulator included close to a blasticidin resistance
transgene under the control of the strong actin promoter
7.
However, it is unclear whether this result can be translated to
other model systems, and no analysis has been done so far on a
natural replication origin, at its original site or at an ectopic
position.
Here we used various experimental approaches to determine
whether OGRE/G4 is a functional element at metazoan origins.
First, using an in vivo genetic approach at an endogenous locus,
we showed that deletion of this motif strongly reduced origin
activity in mouse cells. Moreover, an OGRE/G4-containig
sequence introduced in an ectopic origin-free region promoted
the establishment of a new functional origin. Second, we showed
that a plasmid containing an origin with an OGRE/G4 element
can replicate in HEK293 cells that express EBNA1 almost as
efficiently as plasmids containing the Epstein-Barr virus (EBV)
origin OriP, and that deletion of the OGRE/G4 element strongly
reduces its replication efficiency. Third, we analyzed the influence
of PhenDC3, a known G4 ligand, on origin
firing efficiency
genome-wide. Fourth, we performed competition experiments in
in vitro systems of DNA replication derived from Xenopus laevis
eggs, and found that G4-forming sequences are competitors that
strongly affect DNA replication initiation.
Altogether, all our results converge to the conclusion that
G-rich elements, including the OGRE/G4 motif, are functionally
important for origin activity.
Results
OGRE/G4 elements can form G4 in vitro. We
first asked
whe-ther the OGRE/G4 motif could form G4 in vitro. Origins were
identified from which cells by purification of Short RNA-primed
Nascent Strands (SNS), a procedure that we and others repeatedly
found to be accurate for origin analysis in Drosophila
melano-gaster
5, mouse
2–4Arabidopsis thaliana
11, Caenorhabditis
ele-gans
12, chicken
7, and human cells
13–15, and the results of which
were confirmed by different approaches
6,10,14,15. Supplementary
Fig. 1 summarizes this procedure (detailed in
“Methods” section),
and shows the controls used for this analysis.
We tested the capacity of G4 formation by sequences found in
the origin vicinity using isothermal difference spectra (IDS)
and circular dichroism (CD). To test their propensity to form a
G4-structure, we selected origins in different chromatin domains,
transcription status and replication activity. Because each
sequence needed to be individually synthesized and tested by
CD and IDS, we did a selection of 7 origins. The bioinformatics
prediction for a potential of G4-structure was
first tested at the
bioinformatical level, using the G4H algorithm (similar results
were obtained with the Quadparser software), and indicated a
high capacity for G4-formation for all tested sequenced (Fig.
1
a
and Supplementary Table 1). Circular dichroism (CD) is a highly
sensitive assay, which can determine the conformational state of
quadruplex structures
16. Isothermal differential spectra (IDS) are
obtained using a method derived from that for thermal
denaturation spectra
17; they provide information on the nature
of the folded structure. Both assays showed that all these
sequences exhibited hallmarks of quadruplex formation, as shown
by the strong negative peak around 295 nm and the two positive
peaks around 240 and 273 nm for IDS (Fig.
1
a, left panel), and the
strong positive peak around 260 nm with CD (Fig.
1
a, right
panel). Such data suggested a predominantly parallel quadruplex
conformation for all sequences and confirmed G4 formation by
these sequences.
OGRE/G4 elements confer replication origin activity. We then
selected a strong and reproducible origin that was present in all
our
five independent experimental replicates (Ori 1,
Supple-mentary Table 1; SuppleSupple-mentary Fig. 2A shows the raw data in
our replicates). The replication origin positions were defined in a
genome-wide manner using MACS2 and SICER peaks calling
softwares, as previously described
4. The origin initiation site is the
highest NS-enrichment score over the initiation region. The
OGRE/G4 motif was located 240 nt upstream of the IS (Fig.
1
b
and Supplementary Fig. 2A), in agreement with previous results
in mouse cells
4. After insertion of a 1907 bp fragment that
included the OGRE/G4-containing Ori1 into a large region
devoid of replication or transcription activity (Fig.
1
b,
Supple-mentary Fig. 2A–C and “Methods” section), we tested replication
activity by SNS purification followed by qPCR with primers for
the inserted origin sequence (Supplementary Table 2 and
“Methods” section). The replication profiles showed that Ori1
was active at the ectopic position (Fig.
1
c). As the inserted
sequence was identical to the original sequence, the origin activity
observed after the insertion was around twice the activity
mea-sured in parental cells. Conversely, the activity of another origin
on chromosome 11 (external origin, Ori2) did not change
(Fig.
1
c).
To functionally assess the importance of the OGRE/G4 motif,
we also used another experimental system based on the
replication of episomal DNA in mammalian cells. This
episomal plasmid harbors the EBV origin OriP that is
recognized by the viral protein EBNA1
18. OriP is a bipartite
element consisting of the family of repeats (FR) and the dyad
symmetry (DS) element. Both are recognized by EBNA1,
favoring the mitotic segregation of the episome and DNA
replication during S phase respectively
19. Interestingly,
replica-tion occurs ORC dependently once per cell cycle in synchrony
with chromosome replication
20–22.
After transient transfection of different episomal plasmids
(Fig.
1
d, left panel) in HEK293 cells that stably express EBNA1,
we analyzed episomal DNA replication by DpnI digestion/
transformation (Fig.
1
d and
“Methods” section). DS deletion
(deltaOriP) strongly inhibited episomal DNA replication,
show-ing the requirement of an active origin in this system (Fig.
1
d,
right panel). Insertion of a 500 bp mouse OGRE/G4-containing
origin (Ori2; Supplementary Table 1) at the place of OriP
(Fig.
1
d) also promoted episomal DNA replication almost as
efficiently as the viral origin. As previously shown, the OGRE/G4
presence is orientated relative to the initiation site, as initiation
occurs always downstream to the OGRE/G4
3,4. So, when the
antisense sequence is used, the initiation site will be in the other
direction. In this orientation the origin is still active, as expected,
although slightly less possibly because of a different chromatin
environment in the reverse direction.
From these results, obtained in two different in vivo systems
and using different methods to analyze origin activity, we
concluded that an OGRE/G4-containing origin can function
ectopically in the genome and also in episomal plasmids.
+0.15 +0.10 +0.05 0 –0.05 –0.10 220 240 260 280 300 320 Wavelength (nm) CD [mdeg] Δ AbsorbanceIDS K+ Ori ins A
Ori ins B Ori ins C Ori ins D Ori ins E Ori ins F Ori ins G Ori ins A Ori ins B Ori ins C Ori ins D Ori ins E Ori ins F Ori ins G 1907 bp 80 60 40 20 0 20 40 220 240 260 280 300 320 Wavelength (nm) CD K+ Donor plasmid OGRE/G4 Ori1
Initiation site (I.S.)
Ori1 Initiation site
Chr.11 Chr.11
Chr.11
Origin free zone 10 kb
HR (CRISPR/Cas9)
PJ5’ P1 P2 P3 PJ3’
PJ5’ P1 P2 P3 PJ3’
New inserted ori
Ori2
Origin zone control
1000 900 800 700 600 500 400 300 200 100 15 Nascent DNA str and enr ichment ns ns ns
Parental cell line Insertion ori1 G4 Bcgd1 Bcgd2 Ori2 HEK 293:EBNA1 Transfection Episome recovery (Hirt lysis) Dpnl pBS – + + Hygromycin selection Dpnl sensitivity assay pcDNA3-ori pcDNA3-ori Orip Delta OriP OGRE/G4 sense OGRE/G4 antisense Replication efficiency by colony counting.
Replication efficiency related to
the vir a l or igin 100% 80% 60% 40% 20% 0% Or iP delta Or iP OGRE/G4 sense OGRE/G4 antisense ns
a
b
c
d
Deletion of the OGRE/G4 inhibits replication origin activity.
To further confirm that the potential formation of a G4 is
important for the origin functionality, we deleted the endogenous
OGRE/G4 sequence in Ori1. Co-expression of the Cas9 nickase
and two gRNAs targeting this sequence led to the formation of a
double-strand break and the subsequent deletion of the targeted
sequence (Fig.
2
a,
“Methods” section and Supplementary
Fig. 3A). The strong peak (G4H score > 2) observed in the wild
type sequence with G4-Hunter (a tool to predict the propensity of
a sequence to form G4) disappeared for both mutated alleles (no
signal above 1), strongly suggesting that our targeted deletion
removed the putative G4-forming sequence at this locus (Fig.
2
b).
In order to confirm these predictions, we analysed the circular
dichroism (CD) (Supplementary Fig. 3B, left panel) and
iso-thermal differential spectra (IDS) (Supplementary Fig. 3B, right
panel) of Ori1 wt sequence and 2 mutated alleles of Ori1. The
results indicated a strong capacity of G4-formation by the wt
sequence with a strong positive peak around 260 nm on CD
spectrum, and a strong negative peak around 295 nm and the two
typical positive peaks around 240 and 273 nm on IDS spectrum.
In agreement with the bioinformatics predictions these hallmarks
of G4-formation are lost in mutated Ori1 alleles. It is noteworthy
that the bioinformatics predictions gave a very accurate
predic-tion of G4-forming potential that was confirmed by in vitro CD
and IDS spectra analysis for all tested sequences (Fig.
1
a,
Sup-plementary Fig. 3B, C).
Quantification of the origin activity by SNS purification and
qPCR analysis showed that in mutant cells, Ori1 replication activity
was decreased by 85%, but not that of an external origin (Ori2),
also located on chromosome 11 (Fig.
2
c). The transcription levels of
the Rai1 gene, associated with Ori1, and of the Actb (actin) and
Gapdh controls were only slightly affected (Fig.
2
d), making
unlikely an indirect effect due to a transcriptional activity change.
Similarly, deletion of the OGRE/G4 sequence in the episomal
vector strongly inhibited episomal DNA replication (Fig.
2
e).
Randomization of the OGRE/G4 sequence also decreased origin
efficiency, suggesting that, at least for Ori2, G-richness per se is
not sufficient and that G4 formation is an important feature
(Fig.
2
e). Additionaly, to confim the capacity of G4-formation by
Ori2 and its absence in Randomised Ori2 we analysed the circular
dichroism (CD) (Supplementary Fig. 3C, left panel) and
isothermal differential spectra (IDS) (Supplementary Fig. 3C,
right panel) of Ori2 wt sequence and Randomised Ori2. The
results unambiguously showed a strong G4-forming potential in
the wt sequence that was completely lost in Random mutant.
Altogether, these functional studies indicate that the OGRE/G4
element located upstream of Ori1 is functionally active and
positively contributes to origin activity.
G4-stabilization increases G4-associated origins
firing. To
better understand the importance of OGRE/G4 elements, we
investigated genome-wide whether G4 stabilization could affect
origin activity in mouse embryonic stem (ES) cells. We used
PhenDC3 (Fig.
3
a), a bisquinolinium compound that has high
affinity for G4 and that shows an exceptional selectivity for
G-quadruplexes
23,24compared with duplexes, as indicated by the
increase in melting temperature (ΔT
1/2; stabilization) of seven
different quadruplexes, but not for the control duplex (FdxT)
(Supplementary Fig. 4A, and Supplementary Table 3).
Compared with control ES cells, incubation with 10
μM
PhenDC3 for 48 h, as previously described
25, did not affect the
cell cycle profile (Supplementary Fig. 4B), and the expression and
phosphorylation of CHK1, a kinase involved in cell cycle
progression and in the DNA damage checkpoint (Supplementary
Fig. 4C). Conversely, CHK1 phosphorylation was induced by the
genotoxic agents camptothecin (Cpt) and etoposide (Eto). The
expression of OCT4, a pluripotency marker, also was not
modified by PhenDC3 (Supplementary Fig. 4C).
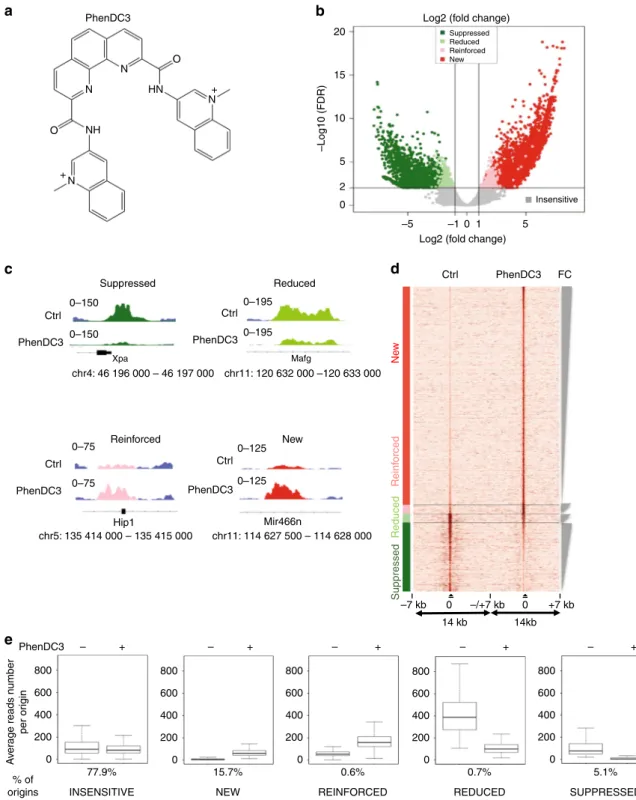
We used a Volcano plot to identify statistically significant
changes in replication origin activity (Fig.
3
b). A Volcano plot
visualizes the biological effect on the x-axis (Log2(fold change,
FC)) and the statistical significance on the y-axis (−log10(false
discovery rate, FDR)). This analysis allowed to define five origin
classes according to their activity in response to PhenDC3:
insensitive, new, reinforced, reduced or suppressed (Fig.
3
b–e and
Supplementary Table 4). Examples of origins belonging to these
classes are shown in Fig.
3
c, while the fold change in origin
activity for each class is depicted in Supplementary Fig. 4D.
Overall, we did not observe a substantial increase of origins in the
presence of PhenDC3 (Supplementary Table 4). The heatmap
(Fig.
3
d) showing read density in the vicinity (±7 kb) of origins
indicated that reduced and suppressed origins were situated in an
origin-dense environment as opposed to reinforced and new
origins. Origins that remained at the same position and with a
similar activity (PhenDC3 insensitive) represented 77.9% of all
origins (Fig.
3
e). One possible hypothesis could be that formation
of a G4 is not essential for the activity of most origins, but this is
in contradiction with our functional analyses showing the
requirement of the OGRE/G4 element for origin activity (Figs.
1
and
2
). A second possibility is that most G4 were normally
formed during origin assembly or activation with no need of
further stabilization by PhenDC3. It was nevertheless plausible
that the genetic, chromatin and transcriptional landscape also
influence the activity of G4 origins (see later).
Incubation with PhenDC3 also led to a set of new origins
(15.7% of all origins) with a level of activity comparable to that of
insensitive origins (Fig.
3
e). Two smaller origin classes were
Fig. 1 Creation of an ectopic DNA replication origin. a Isothermal differential spectra (IDS; left panel) and circular dichroism spectra (CD; right panel) of potential OGRE/G4 sequences fond in the vicinity of replication origins. All tested sequences form G4 structures, as indicated by the strong negative peak around 295 nm and the two positive peaks around 240 and 273 nm (for IDS), and the strong positive peak around 260 nm (CD). The sequences are provided in Supplementary Table 1.b Ori1 that contains an OGRE/G4 element 240 bp upstream of the DNA replication initiation site (IS) was inserted by Cas9-stimulated homologous recombination into an origin-free region on chromosome 11 in NIH 3T3 mouse cells. The insertion of the 1907 bp fragment (marked in violet) occurred thanks to the two 500 bp homology arms (orange and green) present on the insertion template. The position of the primers (P) (sequences in Supplementary Table 2) used for the analysis of origin activity is also shown.c Ori1 activity in parental (control in black) and recombinant NIH 3T3 cells (in grey). As expected, a two-fold increase in DNA replication activity was detected in recombinant cells compared with parental cells, whereas the external origin Ori2 exhibited the same replication activity in both cell lines. Note that SNS activity was also detected at the 5′ and 3′ junctions of the insertion site, but not in the corresponding control regions. The background control regions Bcgd1 and 2 are located in origin-free regions; results are the mean ± SD of 3 independent experiments; p values were obtained using the two-tailed Student’s t test; *p ≤ 0.05, p > 0.05. d Analysis of DNA replication, using the DpnI digestion method and colony counting (“Methods” section), in an EBV episomal plasmid transfected in HEK293 cells that express EBNA1. DNA replication activity was assayed using EBV episomal plasmids that carry or not (Delta) the OriP origin, or a 500 bp fragment of Ori2 containing an OGRE/G4 element in the sense or antisense orientation. Results are the mean ± SD of 3–7 independent experiments; p values were obtained using the two-tailed Student’s t test; *p ≤ 0.05; ns not significant, p > 0.05
represented by reinforced and reduced origins (0.6 and 0.7%,
respectively). Origins reduced by PhenDC3 were initially
particu-larly strong, among the top 10% of strongest origins (Fig.
3
e).
Overall, we observed that the ligand-mediated G4 stabilization led
to a more uniform activity of all origins (Fig.
3
e).
We used the RSAT peak-motifs program (see
“Methods”
section) to
find a specific motif in these origin classes. This led to
the de novo identification of a G-rich motif upstream the IS,
similar to the OGRE/G4 element
2,4, in all origin classes but for
the suppressed class (Fig.
4
a and Supplementary Fig. 5A).
Suppressed origins were G4-poor, and preferentially contained a
GC-rich motif (Supplementary Fig. 5A), possibility reflecting the
enrichment of these origins in GCI promoters and a link with
transcription (see below). In reduced origins, the OGRE/G4
element was at almost 400 bp upstream of the IS (Fig.
4
b). This
could be a consequence of their localization close to a promoter.
We concluded that G4 stabilization by PhenDC3 did not reveal
any new motif in the replication origin repertoire, but led to the
Chr. 11 Initiation site Chr.11 Initiation site
P1 P2 P3 P1 P2 P3 Ori1 CRISPR/Cas9 Ori deleted G4 4 2 0 –2 –4 G4H score Ori1 Ori1 allele1 Ori1 allele2 Chr.11 Ori2
Origin zone control
60139850 60139800 60139750 ns ns ns Wt Ori1 Delta G4 Ori1 180 160 140 120 100 80 60 40 20 0 Bcgd1 P1 P2 P3 Bcgd2 Ori2 Nascent DNA str and enr ichment pCDNA3-ori OriP Delta OriP OGRE/G4 scrambled OGRE/G4 delta OGRE/G4 ns ns ns ns 140 120 100 80 60 40 20 0 T ranscr iption le v el of Δ G4 m utant relativ e to WT cells (%)
actin 1 actin 2 Rai1 a Rai1 b GAPDH
Replication efficiency related to
the vir al or igin (Or iP) 100% 80% 60% 40% 20% 0%
OriP delta OriP OGRE/ G4 scrambled OGRE/G4 delta OGRE/G4 ns
a
b
c
d
e
suppression of a discrete origin population that lack the
OGRE/G4 sequence. These origins were in origin-dense regions,
and their suppression might compensate the appearance of
new OGRE/G4-containing origins, favored by their
PhenDC3-mediated stabilization.
We experimentally tested G4 formation in vitro in a subset of
new origins using CD and IDS, as previously described (Fig.
1
a
and Supplementary Table 1 for the full list of tested sequences).
All these sequences exhibited the hallmarks of quadruplex
formation (Fig.
4
c). The presence of a minor peak around 295
nm may indicated the formation of alternative folds (possibly
anti-parallel G4 structures) for some sequences.
We then asked whether the
five origin classes correlated with
putative G4 predicted by the G4-Hunter (G4H)
26and
Quadpar-ser (QP) algorithms
27(Fig.
4
d and Supplementary Table 4). The
bioinformatics analysis gave highly accurate predictions of
G4-forming potential that was confirmed by CD and IDS analysis for
several wt and mutant sequences (Fig.
1
a, Supplementary Fig. 3B,
C). Using stringent parameters, 490,971 G4 were predicted by
Quadparser (G-track size min
= 3; parameters loop size min = 1,
max
= 7, Gs permitted in the loop), and 568,806 by G4-Hunter
(threshold
= 2, window size = 25). Analysis of G4 distribution
in each origin class gave similar results with both software
programs. This analysis showed no difference in G4 score
distribution among classes (Supplementary Fig. 5B; for simplicity,
only the results with G4-Hunter are shown), which indicates that
G4 strength does not explain our observations.
Moreover, we did not
find any significant correlation between
the length of the OGRE/G4 sequence and the different origin
classes (Supplementary Fig. 5A, C), but we detected a slight global
effect of the number of OGRE/G4 motifs present close to the IS
(Supplementary Fig. 5D).
Finally, to confirm the functional link between PhenDC3 effect
and the OGRE/G4 motifs, we used an indirect FRET melting
competition assays with OGRE/G4 oligonucleotide sequences
from the insensitive class (which were the same as tested for
G4-formation using CD et IDS) and new origin classes as well
as unlabeled positive (G4) and negative controls (single- or
double-strand oligonucleotides) (Supplementary Table 1). These
sequences were added to a mixture containing a
double-fluorescently labeled G4 forming sequence (F21T) corresponding
to the human telomeric motif, in the presence or absence
of PhenDC3. PhenDC3 bound to F21T and increased its
melting temperature in a concentration-dependent manner
(ΔTm = +29 °C at 1 µM and ≈ +18 °C at 0.5 µM; Fig.
4
e) when
no competitor was present. Negative control competitors, unable
to bind to PhenDC3 (dT30 and DS26; single- and double-strands,
respectively) did not affect this stabilization, as expected given the
high specificity of PhenDC3 for G4 structures. Conversely, the
strong decrease in stabilization observed after addition of origin
sequences confirmed the recognition by PhenDC3 of the OGRE/
G4 motifs in these origins that acted as strong competitors for
PhenDC3 (Fig.
4
e). We concluded that PhenDC3 displays high
affinity for both insensitive and new origins, confirming the
functional link between PhenDC3 incubation and the observed
changes in replication activity.
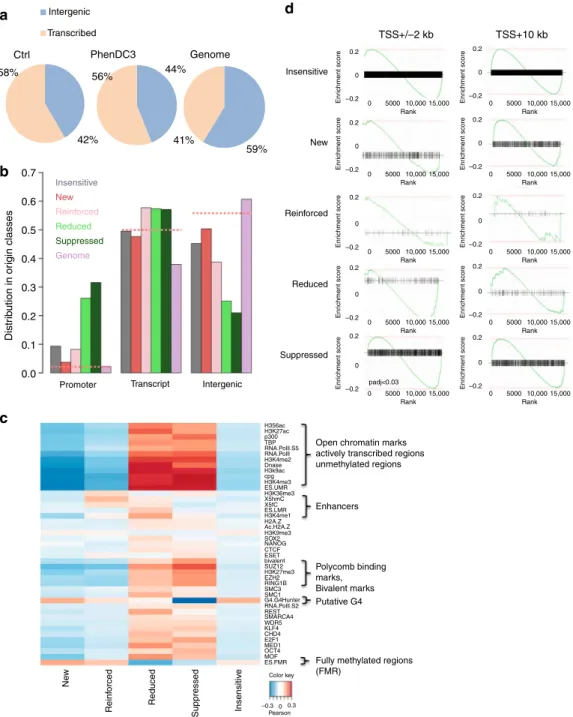
Transcription and not G4 govern replication at promoters.
Analysis of the genomic location showed that overall, origins
were enriched at gene regions, compared with intergenic regions
(Fig.
5
a), as previously widely observed
28and references herein).
Remarkably, suppressed and reduced origins were highly enriched
at promoter regions, whereas the other origin classes were mostly
absent from promoters and evenly distributed between
tran-scribed and intragenic regions (Fig.
5
b, random origins as dotted
lines, and control in Supplementary Fig. 6A), confirming our
previous results. Next, we asked whether the
five origin classes
defined in this study were associated with specific chromatin
signatures. Pearson correlation analysis using BEDTools
29(see
“Methods” section) revealed that suppressed and reduced origins
were strongly correlated with chromatin marks associated with
active transcription and with bivalent epigenetic marks (Fig.
5
c,
control randomized regions in Supplementary Fig. 6B, and
reference data in Supplementary Table 5). Suppressed and reduced
origins were also associated with several transcription factors,
further confirming the promoter location of these origins. This
result also explains why origins from the reduced class exhibited
stronger replication activity before G4-stabilisation. These origins
were quite strong because of the presence of both G4 and active
transcription. The decreased transcription activity at these origins
upon G4 stabilisation decreased the stimulating effect of
tran-scription of these origins. Reinforced origins were only slightly
correlated with enhancer marks (Fig.
5
c). Moreover, we observed
a strong link between the formation of new origins and regions
poor in epigenetic marks, but enriched in G4-forming fully
methylated sequences (Fig.
5
c).
To further interpret these results, we analyzed the
transcrip-tional output associated with each origin class by RNA-seq
analysis of control and PhenDC3-treated ES cell samples
(“Methods” section) followed by identification of genes that
were differentially expressed in each class using the DESeq2
algorithm (see
“Methods” section). We computed the
enrich-ment set using the genes associated with each origin class and
by considering the origin localization at the promoter (TSS ± 2
kb, left panel) or within the transcribed regions (TSS
+ 10 kb).
We
found
that
origin
activity
tended
to
follow
the
Fig. 2 OGRE/G4 deletion strongly decreases the DNA replication activity of an endogenous origin. a The OGRE/G4 sequence of an endogenous origin (Ori1) was deleted and the deletion was confirmed using a restriction site close to the targeted sequence (see “Methods” section). b G4 formation propensity profiling of the Ori1 sequence targeted for deletion. The Ori1 sequence is located on chromosome 11 and presents a strong peak in the G4-Hunter score profile (red line). Such peak is not present upon OGRE/G4 deletion (alleles 1 and 2, blue and green dotted lines, respectively), and no point above 1 or below−1 is observed. This argues against the probability of G4 formation at this mutated locus. The striped lines on the top indicate the extent of the deletion in allele 1 (red and blue) and allele 2 (green and blue).c Nascent strand enrichment of Ori1 in parental NIH 3T3 cell line (black) and in mutant clones with the deletion (grey). Replication activity was strongly decreased after deletion of the OGRE/G4 sequence, whereas the activity of the external origin (Ori 2) did not vary. The background control regions Bcgd1 and 2 are located in origin-free regions. Results are the mean ± SD of 3 independent experiments; p values were obtained using the two-tailed Student’s t test; *p ≤ 0.05; **p ≤ 0.01; ***p ≤ 0.001, p > 0.05. d Deletion of the OGRE/G4 did not affect the transcription level of the Rai1 gene, associated with Ori1. As a control, the housekeeping genes Actb and Gapdh were used. Results are the mean ± SD of 3 independent experiments; p values were obtained using the two-tailed Student’s t test; p > 0.05. Primer sequences are in Supplementary Table 2.e DNA replication activity was assessed as in Fig.1c with the EBV origin, or with the 500 bp OGRE/G4 element of Ori2, or after scrambling or deletion of the same OGRE/G4 sequence. Results are the mean ± SD of 4–5 independent experiments; p values were obtained using the two-tailed Student’s t test; *p ≤ 0.05; **p ≤ 0.01; p > 0.05. Note that data presented for episome containing delta oriP and OGRE/G4-containing origin were performed independently from results presented in the Fig.1; ns not significant: p > 0.05
chr11: 120 632 000 –120 633 000
PhenDC3 Log2 (fold change)
N N HN NH O N+ O N + 20 15 10 5 2 0 –5 –1 0 1 5 Insensitive
Log2 (fold change)
–Log10 (FDR) Suppressed 0–150 0–150 Ctrl PhenDC3 Ctrl PhenDC3 Ctrl PhenDC3 Ctrl PhenDC3 chr4: 46 196 000 – 46 197 000 Xpa 0–195 0–195 Mafg 0–75 0–75 Reinforced 0–125 0–125 New Mir466n Hip1 chr5: 135 414 000 – 135 415 000 chr11: 114 627 500 – 114 628 000 Ne w Reinf o rced Reduced Suppressed –7 kb 0 –/+7 kb 0 +7 kb 14 kb 14kb PhenDC3 – + – + – + – + – + A v er age reads n umber per or igin 800 600 400 200 0 800 600 400 200 0 800 600 400 200 0 800 600 400 200 0 800 600 400 200 0 77.9% 15.7% % of origins in class INSENSITIVE NEW 0.6% REINFORCED 0.7% 5.1% REDUCED SUPPRESSED Reduced Ctrl PhenDC3 FC Suppressed Reduced Reinforced New
a
b
c
d
e
Fig. 3 Changes in the replication origin repertoire upon G4 stabilization by PhenDC3. a PhenDC3 formula. b Volcano plot of origins affected by incubation of mouse ES cells with PhenDC3. After identification of the bound sites in all SNS-seq samples, differential binding analysis was performed. For each origin, the corrected p values (false discovery rates, −log10(FDR)) and the log2 fold change (FC) of control and PhenDC3-treated samples were plotted. The horizontal and vertical lines correspond to the thresholds for detecting differential origins. On the basis of the FC and peak reproducibility, origins were classified in five different classes, according to PhenDC3 effect (suppressed, reduced, reinforced, new, and insensitive), as described in “Methods” section.c Examples of the activity of origins in the indicated classes after incubation with PhenDC3 or in control cells. The corresponding genomic region is indicated and the origin color is according to the corresponding class in the Volcano plot.d Heatmap showing the read densities in origins affected by G4 stabilization (PhenDC3-treated vs. Control). The heatmap indicates the signal strength (number of reads) and density around each origin and was performed on 7 kb regions on each side of origins, as previously described4. The intensity (brown) is proportional to the read counts per 100 bp bins.
Origins were sorted on the basis of the FC in signal strength.e Activity of origins (reads number) in each class in control (−) and PhenDC3-treated (+) cells
transcriptional output. For instance, suppressed origins found at
promoters were significantly associated with gene repression
(Fig.
5
d), as well as reduced origins. Conversely, new and
reinforced origins found at promoters tended to be associated
with upregulated genes. This is also in agreement with the
observation that origins close to TSS are usually highly active,
and are downregulated when transcription decreases
1,28,30. We
did not detect any correlation between replication and
2 1 0 Bits 5′1 2 3 4 5 6 7 8 9 10 11 12 13 14 15 16 17 18 19 20 21 22 23 243′ F raction of G4-f or ming sequence 0.12 0.08 0.04 0.00 –1000 –500 IS 500 1000 Distance from the IS (bp)F raction of G4-f or ming sequence 0.12 0.08 0.04 0.00 –1000 –500 IS 500 1000 Distance from the IS (bp)
F raction of G4-f or ming sequence 0.12 0.08 0.04 0.00 –1000 –500 IS 500 1000 Distance from the IS (bp)
F raction of G4-f or ming sequence 0.12 0.08 0.04 0.00 –1000 –500 IS 500 1000 Distance from the IS (bp)
F raction of G4-f or ming sequence 0.12 0.08 0.04 0.00 –1000 –500 IS 500 1000 Distance from the IS (bp)
New CD K+ +0.2 +0.15 +0.1 +0.05 –0.05 –0.1 –0.15 0 220 240 260 280 300 320 Wavelength (nm) 220 240 260 280 300 320 Wavelength (nm) Ori new A Ori new B Ori new C Ori new D Ori new E Ori new F Ori new G Ori new H Ori new I Ori new A Ori new B Ori new C Ori new D Ori new E Ori new F Ori new G Ori new H Ori new I IDS K+ 60 40 20 0 –20 –40 Distr ib ution in or igin classes (%) 100% 80% 60% 40% 20% 0% Total Insensitiv e New Reinf orced Reduced Suppressed No competitor 3 μM competitor 10 μM competitor
No competitor 3 μM competitor 10 μM competitor
Δ T1/2 , in °C 25 20 15 10 5 0 –5 Δ T1/2 , in °C 25 20 15 10 5 –5 0 Or i ins A Or i ins B Or i ins C Or i ins F Or i ins G Or i ins H Or i ins D or I
H2O 22ag ds26 1XA
V dT30 Or i ne w A Or i ne w B Or i ne w C Or i ne w D Or i ne w E Or i ne w F Or i ne w G Or i ne w H Or i ne w I Δ Absorbance CD [mdeg] Insensitive Shuffled New Shuffled Reinforced Shuffled Reduced Shuffled Suppressed Shuffled
b
a
G4– G4+c
d
e
transcription changes for origins situated in transcribed regions
(Fig.
5
d, right panel).
We concluded that i) replication origins are enriched in
transcribed regions, including promoter; and ii) origins situated
at promoters are often devoid of OGRE/G4 sequences, and their
firing activity strongly depends on the transcription level.
Conversely, G4 stabilization might facilitate origin
firing in
non-genic regions that are less prone to chromatin opening, or
spontaneous G4-formation, such as fully methylated regions. In
these regions, OGRE/G4 might help replication origin activity
through its two main features: the presence of single-stranded
DNA in the strand opposite to the G4, and its ability to exclude
nucleosomes, and to favor a less energetically demanding origin
activity in transcriptionally silent regions.
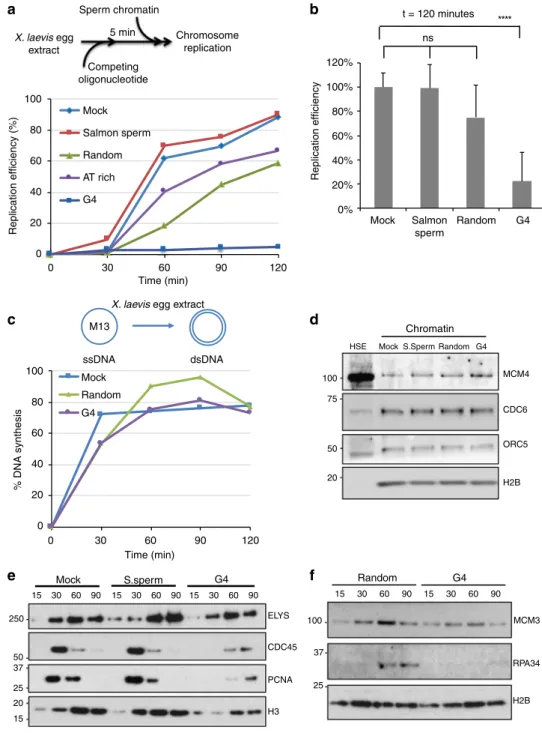
G4-forming oligonucleotides compete for replication factors.
Initiation of DNA replication is a two-step process. First (i.e.,
replication licensing), pre-RCs are assembled at origins and this
includes the binding of ORC, CDC6, CDT1 and the MCM
helicase. Then, the MCM helicase is activated and allows the
recruitment of the DNA polymerase machinery. To determine
whether OGRE/G4 elements could be potential binding sites for
proteins involved in these steps, we performed classical
oligo-nucleotide competition experiments in Xenopus laevis low-speed
egg extracts (LSE). Xenopus LSE is a well defined cell-free
sys-tem that faithfully reproduce DNA replication in vitro
31. This
reaction is entirely transcription-independent, thus excluding
any influence by the transcription process on the assay.
Oligo-nucleotides similar to the endogenous target DNA sequence
should compete for the replication activity as opposed to
oli-gonucleotides which are not related to the target sequence. To
test whether OGRE/G4 oligonucleotide templates compete for
factors involved in DNA synthesis on sperm nuclear chromatin
(Fig.
6
a), we incubated X. laevis LSEs with 80-mer
oligonu-cleotides that contained an OGRE/G4 sequence (from Ori1 used
in the CRISPR/Cas9 experiments), or a sequence with the
same G content but randomized (random oligonucleotide), or
an AT-rich sequence (Supplementary Table 6), or water (mock),
or sonicated salmon sperm DNA. The kinetics of nuclear DNA
replication (oligonucleotides do not replicate in the extract)
were comparable in mock-treated extracts and after addition of
sonicated salmon sperm DNA. DNA replication was slightly
delayed by incubation with random and AT-rich
oligonucleo-tides, whereas it was nearly abolished by OGRE/G4
oligonu-cleotides (Fig.
6
a, and quantification in Fig.
6
b). Differently from
LSEs, X. laevis high-speed egg extracts (HSE), in which nuclear
membranes have been removed, cannot initiate dsDNA
repli-cation. However, they can perform all the reactions occurring
during complementary DNA strand synthesis, as tested with
ssM13 DNA as template
32including RNA priming, elongation
and ligation of Okazaki fragments, and chromatin assembly
coupled to DNA synthesis. In these extracts, DNA synthesis was
not affected by pre-incubation with OGRE/G4 or random
oli-gonucleotides (Fig.
6
c). We concluded that OGRE/G4
oligonu-cleotides compete specifically with replication initiation, and
have little or no effect on the subsequent steps.
G4 are involved in replication origin
firing step. It is unlikely
that OGRE/G4 oligonucleotides inhibit DNA replication through
checkpoint activation because the DNA damage checkpoint is
deficient in X. laevis early embryos
33,34. In agreement, OGRE/G4
oligonucleotides did not induce CHK1 phosphorylation in our
in vitro conditions (Supplementary Fig. 7A), differently from
incubation with pApT at a concentration that mimics
post-midblastula transition conditions known to induce the
check-point, while pCpG do not
35(Supplementary Fig. 7A, lane 5).
Moreover, caffeine, a checkpoint inhibitor, did not rescue the
inhibition of DNA replication by OGRE/G4 oligonucleotides
(Supplementary Fig. 7B), whereas it did it in a control experiment
where DNA replication was inhibited by aphidicolin
(Supple-mentary Fig. 7C). Altogether, these
findings show that checkpoint
activation does not explain the inhibition of DNA replication by
OGRE/G4 oligonucleotides.
We then investigated which replication initiation step was
inhibited by exogenous G4 oligonucleotides. Pre-RC formation
can be analyzed in X. laevis HSEs that allow this reaction, but not
DNA synthesis initiation. Factors involved in origin recognition
(ORC5), the recruitment of the MCM helicase onto DNA,
(CDC6), and the MCM complex (MCM4) were similarly loaded
on chromatin in mock-treated HSEs and in samples incubated
with salmon sperm DNA, random oligonucleotides, or OGRE/
G4 oligonucleotides (Fig.
6
d). Formation of the nuclear
membrane also was not affected, as shown by the chromatin
recruitment of ELYS, a protein required for the formation of a
functional nuclear membrane
35,36(Fig.
6
e). Conversely, the
recruitment of CDC45, which is needed for DNA synthesis
activation
37, and of factors required for DNA synthesis initiation
and for DNA strand elongation (RPA, and PCNA) was strongly
decreased (Fig.
6
e–f). These results suggest that OGRE/G4
oligonucleotides do not disturb the licensing step of DNA
replication, but rather affect the conversion of the pre-RC into
the DNA synthesis elongation complex. This result is in
agreement with the recent
finding that origin firing activity by
Mdm2-binding protein (MTBP) in X. laevis and human cells is
dependent on its G4-binding motif
9.
Fig. 4 Nature of the OGRE/G4 in the different origin classes. a De novo motif found as the most representative in the new origin class using the RSAT suite60. For motifs found in the other classes see Supplementary Fig. 5A.b Fraction of OGRE/G4 sequences in function of the distance from the IS. The
OGRE/G4 motif forms a relatively sharp peak upstream the IS at an average distance of 250 bp in all origin classes, but for the suppressed class. The CL95% is shown in pink. The fraction of OGRE/G4 sequences in shuffled regions and their CL 95% is shown in yellow and light yellow, respectively. c Isothermal differential spectra (IDS; upper panel) and circular dichroism spectra (CD; lower panel) of potential OGRE/G4 sequences associated with the new class of replication origins. All tested sequences form G4 structures, as indicated by the strong negative peak around 295 nm and the two positive peaks around 240 and 273 nm (for IDS, top panel), and the strong positive peak around 260 nm by CD (bottom panel). The IDS suggest that the tested sequences form predominantly G4 in parallel conformation. The possibility to adopt alternative folds, such as anti-parallel G4 structures, for some sequences is indicated by a minor peak around 295 nm. The sequences are provided in Supplementary Table 1.d Association of origins with OGRE/G4 motifs in the different classes. Insensitive, new, enforced and reduced origins are mainly G4-associated, but not suppressed origins.e FRET competition assays in which stabilization (ΔT1/2, in °C) of the human telomeric quadruplex F21T by 0.5 µM PhenDC3 was analyzed in the absence (black bars), or in the presence of G-rich sequences from insensitive (upper panel) and new (lower panel) origins (3 or 10µM strand concentration; dark green and light green bars, respectively), of positive (22Ag, 1XAV, both forming G4 structures), and negative (ds26 and dT30 are double- and single-stranded controls, respectively) control sequences. The means were obtained in independent expreiments ± SD. Efficient competition by quadruplex-forming oligonucleotides is evidenced by a sharp drop in stabilization. The origin oligonucleotide sequences are provided in Supplementary Table 1
Discussion
Genome-wide analyses of replication initiation profiles first
highlighted that metazoan origins were enriched near CpG
islands
2,28,38,39. Then, the G-rich OGRE motif that could
potentially form G4 was identified in the mouse and fly
genomes
3,4and subsequently also in mouse
4, chicken
7,
fly
5, and
human cells
14,40. This element was discovered using the SNS
purification system coupled with high-throughput sequencing
(SNS-seq), which has currently the best resolution to map
repli-cation origins
41. Moreover, G4 presence was detected also using
λ
Intergenic Ctrl PhenDC3 Genomea
b
d
c
56% 58% 0.7 Insensitive Reduced Genome SuppressedPromoter Transcript Intergenic Reinforced New Insensitive TSS+/–2 kb –0.2 Enr ichment score 0.2 0 0 5000 Rank 10,000 15,000 –0.2 Enr ichment score 0.2 0 0 5000 Rank 10,000 15,000 –0.2 Enr ichment score 0.2 0 0 5000 Rank 10,000 15,000 –0.2 Enr ichment score 0.2 0 0 5000 Rank 10,000 15,000 –0.2 Enr ichment score 0.2 0 0 5000 Rank 10,000 15,000 –0.2 Enr ichment score 0.2 0 0 5000 Rank 10,000 15,000 –0.2 Enr ichment score 0.2 0 0 5000 Rank 10,000 15,000 –0.2 Enr ichment score 0.2 0 0 5000 Rank 10,000 15,000 –0.2 Enr ichment score 0.2 0 0 5000 padj<0.03 Rank 10,000 15,000 –0.2 Enr ichment score 0.2 0 0 5000 Rank 10,000 15,000 TSS+10 kb Reduced Suppressed
Open chromatin marks actively transcribed regions unmethylated regions Enhancers Putative G4 Polycomb binding marks, Bivalent marks
Fully methylated regions (FMR) Reinforced New Insensitiv e Color key ES.FMR 0 0.3 –0.3 Pearson correlations Reduced Suppressed Reinf orced Ne w 0.6 0.5 0.4 Distr ib ution in or igin classes 0.3 0.2 0.1 0.0 42% 44% 41% 59% Transcribed H356ac H3K27ac H3k9ac cpg ES.UMR ES.LMR X5hmC X5fC H3K4me2 H3K4me3 H2A.Z H3K4me1 H3K9me3 H3K27me3 EZH2 RING1B SMC3 SMC1 G4.G4Hunter RNA.Polll.S2 REST SMARCA4 WDR5 KLF4 CHD4 MOF E2F1 MED1 OCT4 SOX2 Ac.H2A.Z NANOG CTCF ESET bivalent SUZ12 H3K36me3 Dnase p300 TBP RNA.Polll.S5 RNA.Polll
Fig. 5 Transcription and epigenetic landscape in the different origin classes. a Venn diagrams showing the origin distribution between transcribed and intergenic regions in Control and PhenDC3-treated mES cells, and random distribution (Genome). Replication initiation sites are enriched in gene regions. b Genomic localization of the different classes of origins relative to transcription. Downregulated origins (suppressed and reduced) are mainly located at promoters. Random origins (dotted lines) are equally distributed in transcription-related regions.c Epigenetic marks associated with the different origin classes. All tested open chromatin marks were enriched around reduced and suppressed origins. New and reinforced origins were located mainly in highly methylated regions.d GSEA analysis of origins situated at promoters (TSS ± 2 kb, left panels) or in transcribed regions (TSS+ 10 kb, right panels) for each class. A plot is drawn for each gene set. The x-axis of each plot represents differentially expressed genes ranked from upregulated (on the left) to downregulated (on the right). The enrichment score is indicated on the y-axis. The black horizontal bar indicates the genes present in the gene set. The highest enrichment score indicates the enrichment. If this score is on the left, the enrichment is higher for upregulated genes; if it is on the right, the enrichment is higher for the downregulated genes. Origins associated with the TSS follow the transcription changes upon G4 stabilization, whereas origins located in transcribed regions are insensitive to changes in transcription levels. At gene promoters, GSEA results show a significant association of downregulated genes with the suppressed origin class (after multi-testing correction using the Benjamini–Hochberg method, adjusted p < 0.03). The other origin classes show a similar trend, without reaching significance
exonuclease-independent conditions
6,15,40, and by genome-wide
profiling of human replication origins after pulse labeling of SNS
(Ini-Seq)
6,14.
We used several complementary approaches to address the
involvement of G-rich repeated elements and their potential to
form G4 structures in the activity of DNA replication origins. Our
data confirm that such sequence elements are associated with the
majority of active origins, and are localized just upstream of the
initiation site. In vivo deletion or insertion of an
OGRE/G4-containing wild type origin showed that the OGRE/G4 motif is
Sperm chromatin 5 min 0 0 30 60 Time (min) 90 120 0 30 15 30 60 90 15 30 60 90 15 30 60 90 15 30 100 37 25 20 50 75 100 H3 H2B H2B RPA34 MCM3 MCM4 PCNA ELYS CDC45 CDC6 ORC5 250 50 37 20 15 25 60 90 15 30 60 90 60 Time (min) 90 120 20 40 60 80 100
c
d
a
b
e
f
0 20 40 60 80 100 0% 20% 40% 60% 80% 100% 120% ns t = 120 minutes Mock Mock Salmon sperm Salmon sperm S.sperm Random Random AT rich G4 Mock ssDNA M13 dsDNA Mock Random Random Random G4 HSE G4 G4 Chromatin Mock S.Sperm G4 G4 Chromosome replication Competing oligonucleotide Replication efficiency (%) % DNA synthesis Replication efficiency X. laevis egg extractX. laevis egg extract
Fig. 6 At the activation step of DNA replication, OGRE/G4 elements compete for dsDNA but not for ssDNA replication. a Schematic representation of the replication kinetics of sperm nuclei in X. laevis low-speed egg extracts (LSE) in the presence of competing double-stranded (ds) oligonucleotides. LSEs were pre-incubated with competing oligonucleotides, sonicated salmon sperm DNA, or ultrapure H2O (mock) at 22 °C for 5 min.b Average DNA replication efficiency (mean + SD) of LSEs pre-incubated with competing oligonucleotides or controls (n = 6 for mock/salmon sperm DNA pre-incubated extracts, n = 3 for mock/random oligonucleotides). Total incubation time was 2 h. P values were obtained using the two-tailed Student’s t test; ****p < 0.0001, p > 0.05.c Replication kinetics of ssM13 complementary DNA strand synthesis in X. laevis high-speed egg extracts (HSE) pre-incubated with the indicated competing oligonucleotides or H2O (mock).d Competition by OGRE/G4 oligonucleotides does not affect pre-RC formation. Sperm nuclei were added to HSEs incubated with H2O (mock), sonicated salmon sperm DNA (S.Sperm), or the indicated oligonucleotides. Chromatin was isolated and immunoblotted with the indicated antibodies. Histone H2B level was used as loading control.e, f Competition by OGRE/G4 oligonucleotides affects DNA replication activation. Time-course analysis of replication initiation factor recruitment to chromatin after addition of sperm nuclei to LSEs pre-incubated with H2O (mock), sonicated salmon sperm DNA (S. sperm), or competing oligonucleotides. At the indicated time points, chromatin was isolated and immunoblotted with the indicated antibodies; ns not significant
functionally active. This result was obtained using origins that are
present in the mouse genome, as well as using recombinant
episomal DNA.
In our ectopic assay, an OGRE/G4-containing fragment from
an origin inserted in a region completely devoid of both DNA
replication, transcription activity and G4-forming sequences led
to the creation of a functional origin. Deletion of the OGRE/G4
element strongly decreased the activity of the origin. However, we
cannot rule out that in other genomic regions, other features
might stimulate or repress origin activity. Finally, we found that
transcription activity of the gene associated with the origin
remained unchanged upon origin deletion, indicating that the
link between origin activity and transcription activity is not
functionally compulsory. Moreover, our G4-stabilization assay
suggests that this link is mostly limited to promoter regions.
OGRE/G4 elements exclude nucleosomes at mouse replication
origins
4. Nucleosome-free regions were also observed in S.
cere-visiae origins
42–45, although an AT-rich element characterizes
their consensus origin-specific ARS element and also plays a role
of nucleosome exclusion. OGRE/G4 elements might have a
similar function in metazoans. Another possibility is that this
sequence is the binding site for a replication initiation factor. In
agreement with this hypothesis, recombinant ORC preferentially
binds to G4-containing oligonucleotides
8, as well as MTBP,
partner of Treslin, that is involved in activation of origins of
replication
9. RIF1, a protein that regulates the timing of origin
activation, also binds to putative G4-forming sequences
46.
Puta-tive G4-forming sequences have also been observed at viral
replication origins, such as the Kaposi sarcoma associated virus
(KSHV) origin. This origin contains several G4 sequences and
allows the stable maintenance of the viral episome in cells, and
associates with ORC and MCM proteins
47. Putative G4-forming
sequences are also present at the EBV replication origin, to which
EBNA1, the viral protein involved in origin recognition, binds
48.
We used PhenDC3 as a binding tool to reveal new
G4-related features linked to replication origin activity. Incubation
with PhenDC3 did not affect the activity of most origins, despite
the presence of putative G4 sequences, suggesting that most
origins do not need further stabilization by PhenDC3 for their
activity. However, G4 stabilization increased the predisposition to
become a replication origin for a subset of OGRE/G4-containing
origins. These origins are mainly localized in non-coding regions
that are poor in epigenetic marks and enriched in fully
methy-lated regions. We propose that PhenDC3 might facilitate the
formation of G4 structures in fully methylated regions that are
less favorable to their formation
49,50. The influence of DNA
methylation status on G4-folding capacities has been very
recently provided
51using a G4-recognizing antibody which
detected folded G4 structures in hypomethylated regions that
overlap with DNMT1 binding sites. DNMT1 is a DNA methyl
transferase that restores the DNA methylation pattern just after
DNA replication. It has affinity for G4 structures, but surprisingly
these structures inhibit its catalytic activity. In this way, DNMT1
can be concentrated in the vicinity of replication start sites and
could immediately act on newly synthetized DNA after origin
activation. Alternatively, PhenDC3 might facilitate the formation
of G4 in heterochromatin structures, and therefore facilitate
nucleosome exclusion and the formation of replication initiation
complexes.
PhenDC3 incubation also led to the suppression of some
ori-gins that lack the OGRE/G4 element. These oriori-gins are found in
promoters and are significantly associated with gene repression.
We suggest that the replication activity of suppressed origins is
mainly guided by transcription, and is not OGRE/G4-dependent.
Transcription increases the activity of all origins close to a TSS
when gene transcription is upregulated and decreases their
activity when transcription is downregulated. DNA replication
can benefit from the open chromatin structure at gene promoters.
However, the influence of transcription activity was limited to
promoters, and transcription changes did not affect the activity of
origins localized in gene bodies. This is in agreement with the
observation that transcriptional silencing of the X chromosome
does not induce changes in the strength or localization of the
tested origins situated in gene bodies
52. Finally, PhenDC3
incu-bation reduced the efficiency of a small fraction of origins (0.7%).
These few origins were among the strongest ones in control cells,
and were mostly associated with promoters. It is possible that the
appearance of new origins upon incubation with PhenDC3
reduced the need of very strong origins.
New origins represented 71% of all origins affected by
PhenDC3-mediated G4 stabilization, and showed a level of
activity similar to that of insensitive origins. The appearance of
these new OGRE/G4-containing origins might compensate the
suppression of origins that lack OGRE/G4.
Examination of specific loci during X. laevis early development
has shown that initiation of DNA replication did not require
specific sites
53,54, in contrast with late development, when
site-specific initiation of DNA replication correlates with
transcrip-tion onset in the embryo
55. This regulation was explained by the
huge excess of replication factors in X. laevis eggs, and by
the short cell cycle (30 min) without G1 and G2 phases during the
first 12 cell cycles after fertilization. Here, we found that OGRE/
G4 oligonucleotides, but not random or AT-rich oligonucleotides,
are strong competitors for replication origin activity in this
sys-tem. We showed that this competition is at the level of DNA
replication initiation and not at the level of complementary DNA
strand synthesis. The pre-incubation with OGRE/G4
oligonu-cleotides did not affect pre-RC formation on origins, but only
DNA synthesis activation. This suggests that some factors
involved in this process are sequestered by the competing OGRE/
G4 oligonucleotides. Our results might suggest a new explanation
to the rapid replication cycles of Xenopus early embryos. Indeed,
it is now recognized that potential origins are in large excess
relative to those effectively activated in a given cell. The
inter-origin spacing in a somatic cell is around 100 kb. If all inter-origins
were to be activated in a given cell, this spacing would be less than
10 kb. A full usage of specific origins would be therefore
com-patible with the speed of DNA replication in X. laevis early
development.
How could G4 structures be involved in DNA replication
initiation? From E. coli to higher eukaryotes, origins usually
contain an origin recognition site, where the pre-RC is assembled,
upstream of the initiation site of DNA synthesis, where nascent
DNA strands are initiated by the DNA polymerase machinery.
The origin recognition site may play a regulatory role, similar to
transcription promoters that are localized 50 to 300 bp upstream
of the TSS. An important feature of the OGRE/G4 element is its
localization not at the initiation site of DNA synthesis, but 250 bp
upstream of it
2–4, suggesting an interaction with factors involved
in the pre-RC. Figure
7
illustrate this position and show that our
present data also confirm this position. This localization would fit
with the site of assembly of the preRC, in agreement with the
observation that recombinant ORC preferentially binds to
G4 sequences
8. However, alternatively OGRE/G4 elements could
be part of sequences that regulate DNA synthesis initiation,
possibly explaining the present discrepancy between its role in
origin recognition and its replication fork stalling activity
56. It is
worth noting that our oligonucleotide experiments in Xenopus
egg extracts point out to a role in the activation of DNA
repli-cation origins rather than in the assembly of the preRC. Known
factors involved in this activation step are the kinase activity
(DDK) which phosphorylates MCMs subunits and a complex
reaction engaging sevral activating factors factors such as Sld2,
Sld3 and GINS, cdc 45, Dbp11. OGRE/G4 elements could play a
role in this activation step by helping the recruitment of these
factors. G4 sequences can adopt several different G4 structures,
which possibly may have different roles in the processing of the
preRC to the activation step. Another important feature of
OGRE/G4 element is that they are nucleosome-free, in contrast to
the initiation site itself which contains a positioned nucleosome
4.
In such, OGRE/G4 may also recruit factors involved in the
removal of the positioned nucleosome during the activation step
of DNA replication, therefore facilitating the recruitment of the
DNA polymerase machinery and its associated factors. From an
evolutionary point of view, the use of structural elements, such as
a G4-forming sequence, to set the replication program might be
advantageous because it is not dependent on strict sequence
specificity. As these elements are widely present in the genome,
their function could be less affected by potential point mutations
than strict consensus sequences.
Methods
Cell culture. CGR8 mouse ES cells cells (obtained from Austin Smith’s laboratory, Department of Biochemistry University of Cambridge, UK) were cultured on gelatin-coated dishes (feeder-free, to avoid DNA contamination by mouse embryonicfibroblasts) in Glasgow Minimum Essential Medium (GMEM) sup-plemented with 2 mM glutamine, 0.05 mM 2-mercaptoethanol, 1000 units/ml Leukemia Inhibitory Factor (LIF) and 10% Fetal Bovine Serum (FBS). To study the effect of G4 stabilization on originfiring, cells were grown in the presence of 0.5% DMSO or 10μM PhenDC3 (in 0.5% DMSO). NIH3T3 cells (NIH/3T3 (ATCC CRL-1658) were grown in Dulbecco’s modified Eagle’s minimal (DMEM) medium supplemented with 10% FBS.
Genetic modification using the CRISP/Cas9 technology
Surveyor assay. The gRNAs for targeted Cas9-driven genetic modifications were designed using the ZiFiT Targeter Software Version 4.2 (http://zifit.partners.org/
ZettoniFiT/Disclaimer.aspx). The specificity of the designed gRNAs was tested in
the Surveyor assay using the T7 endonuclease (ref NEB #E3321) with the primers SURV_C_S697, SURV_C_AS697 (for sequences see Supplementary Table 2). Successful modification of the chosen region was confirmed by gel electrophoresis of the obtained products (Supplementary Fig. 2B).
Ectopic origin creation and deletion experiments. Ectopic origin creation in mouse NIH 3T3 cells was obtained by lipofectamine (Invitrogen, ref. 18324–012) trans-fection of the MLM3639 plasmid expressing the Cas9 endonuclease (https://www.
addgene.org/42252/), MLM3639 plasmid expressing a gRNA specific to the
tar-geted region (gRNA insertion F, gRNA insertion R) (https://www.addgene.org/
43860/), linearized pBluescript plasmid bearing the template for homologous
recombination, and pBABE-puro vector encoding the puromycin resistance gene
(https://www.addgene.org/34589/). Cells were selected in medium containing 2.5
μg/ml puromycin. The insertion presence was confirmed using the C3 AS1, ori1 G1, A5 S2, and ori1 C1 primers (Supplementary Table 2), and the absence of random insertions of the linearized pBluescript plasmid using the primers pBS1529S and pBS1726AS (Supplementary Table 2). Clones positive for homo-logous recombination were amplified for nascent strand purification.
OGRE/G4 deletion from an endogenous origin. Deletion of an OGRE/G4 from an endogenous replication origin was obtained by transfection of the MLM3639 plasmid expressing the Cas9 nickase (hCas9_D10A) (https://www.addgene.org/
41816/), two different MLM3639 plasmids to express gRNAs specific to the
tar-geted regions (gRNA Ori1 delG4 1 F, gRNA Ori1 delG4 1 R, gRNA Ori1 delG4 2 F, gRNA Ori1 delG4 2 R; for sequences see Supplementary Table 2), and the pBABE-puro vector encoding the pBABE-puromycin resistance gene. After pBABE-puromycin selection, cells were cloned and checked for the presence of mutations using the MslI restrictase that recognizes a specific sequence in the vicinity of the targeted region (for experimental outcome see Supplementary Fig. 3A). The region of interest was amplified from clones bearing mutations using the primers Ori1 742 F and Ori1 742 R (Supplementary Table 2) and subcloned in pBluescript for precise mutation mapping by sequencing.
RNA-primed short nascent strand (SNS) DNA strand isolation. SNS were purified as described in4and in Supplementary Methods. The Illumina TruSeq
ChIP Sample Prep Set A (ref 15034288) was used for preparation of sequencing libraries. Samples were sequenced using the Illumina HiSeq 2000 at the MGX GenomiX facility (Montpellier). To perform local origin mapping, purified nascent strand samples were amplified by qPCR using the specific primers listed in Sup-plementary Table 2 with the LightCycler 480 SYBR Green Master mix (Roche, ref. 04887352001) on a LightCycler 480 II apparatus (Roche). The nascent strand enrichment was calculated as the ratio of the signal scored at origin-specific and background regions. If not otherwise specified, the statistical analysis was per-formed with the two-tailed, unpaired t test and the enrichment detected in 3 independent experiments. Differences with p values≤ 0.05 were considered as statistically significant. OGRE OGRE + – + – G4 3.0 2.5 2.0 1.5 Mean read co v e rage 1.0 0.5 0.0 –2000 –1000 0 1000 2000
Distance from G4 3′end
–2000 –1000 0 1000 2000
Distance from G4 3′end 3.0 2.5 2.0 1.5 Mean read co v e rage 1.0 0.5 0.0 G4
Fig. 7 G4 function in the DNA replication initiation. Based of the position of the OGRE/G4 that we already reported2and the corresponding model3, we
know that the OGRE/G4 element is always upstream of the initiation site itself, either on the+ or the − DNA strand (left and right upper panels). In the corresponding lower panels, based on our present data, we confirm again the position of the G4 element relative to the initiation site. The position of the G4 mightfit with the position of the preRC, but this does not obligatory imply it will recruit some factors to the pre-RC. First, G4 can adopt several types of structure which themselves might regulate the folding or the replication origin region. Second, G4 might play a role in the removal of the nucleosome positioned at the initiation site itself, a process necessary to load the replication machinery, and therefore regulate activation of DNA replication. Third, because G4 are themselves nucleosome-free regions, they could facilitate DNA helix opening at the initiation site