HAL Id: hal-03011656
https://hal.archives-ouvertes.fr/hal-03011656
Submitted on 18 Nov 2020
HAL is a multi-disciplinary open access
archive for the deposit and dissemination of
sci-entific research documents, whether they are
pub-lished or not. The documents may come from
teaching and research institutions in France or
abroad, or from public or private research centers.
L’archive ouverte pluridisciplinaire HAL, est
destinée au dépôt et à la diffusion de documents
scientifiques de niveau recherche, publiés ou non,
émanant des établissements d’enseignement et de
recherche français ou étrangers, des laboratoires
publics ou privés.
PiB- derivative metal complexes with amyloid peptides
Aβ and amylin
Saida Majdoub, Zoltán Garda, Alexandre Oliveira, Inga Relich, Agnes Pallier,
Sara Lacerda, Christelle Hureau, Carlos F.G.C. Geraldes, Jean-François
Morfin, Éva Tóth
To cite this version:
Saida Majdoub, Zoltán Garda, Alexandre Oliveira, Inga Relich, Agnes Pallier, et al..
Concentration-dependent interactions of amphiphilic PiB- derivative metal complexes with amyloid peptides
Aβ and amylin. Chemistry - A European Journal, Wiley-VCH Verlag, 2021, 27, pp.2009-2020.
�10.1002/chem.202004000�. �hal-03011656�
PAPER
1
Concentration-dependent interactions of amphiphilic PiB-
derivative metal complexes with amyloid peptides A
and
amylin
Saida Majdoub,
[a]Zoltán Garda,
[b]Alexandre C. Oliveira,
[c]Inga Relich,
[d]Agnès Pallier,
[a]Sara Lacerda,
[a]Christelle Hureau,
[d]Carlos F.G.C. Geraldes,
[c,e,f]Jean-François Morfin*
[a]and Éva Tóth*
[a][a] S. Majdoub, A. Pallier, Dr. S. Lacerda, Dr. J.-F. Morfin, Dr. É. Tóth Centre de Biophysique Moléculaire, CNRS UPR 4301, Université d’Orléans rue Charles Sadron, 45071 Orléans, France
E-mail: eva.jakabtoth@cnrs-orleans.fr [b] Dr. Z. Garda
Dept. of Physical Chemistry, Faculty of Science and Technology, University of Debrecen, Egyetem tér 1, H-4032 Debrecen, Hungary. E-mail:
[c] A. C. Oliveira, Dr. C.F.G.C. Geraldes
University of Coimbra, Coimbra Chemistry Centre (CQC), Department of Chemistry, 3004-535 Coimbra, Portugal. [d] Dr. I. Relich, Dr. C. Hureau
LCC-CNRS, Université de Toulouse, CNRS, Toulouse, France [e] Dr. C.F.G.C. Geraldes
University of Coimbra, Department of Life Sciences, Calçada Martim de Freitas, 3000‑393 Coimbra, Portugal [f] Dr. C.F.G.C. Geraldes
CIBIT/ICNAS - Instituto de Ciências Nucleares Aplicadas à Saúde, Pólo das Ciências da Saúde, Azinhaga de Santa Comba, 3000-548 Coimbra, Portugal
Supporting information for this article is given via a link at the end of the document.
Abstract: Metal chelates targeted to amyloid peptides are widely
explored as diagnostic tools or therapeutic agents. The attachment of a metal complex to amyloid recognition units typically leads to a decrease in peptide affinity. We show here that by separating a macrocyclic GdL chelate and a PiB targeting unit with a long hydrophobic C10 linker, it is possible to attain nanomolar affinities for both A1-40 (Kd = 4.4 nM) and amylin (Kd =
4.5 nM), implicated respectively in Alzheimer’s disease and diabetes. The Scatchard analysis of surface plasmon resonance data obtained for a series of amphiphilic, PiB derivative GdL complexes indicate that their A1-40 or amylin binding affinity
varies with their concentration, thus micellar aggregation state. The GdL chelates also affect peptide aggregation kinetics, as probed by thioflavin-T fluorescence assays. A 2D NMR study allowed identifying that the hydrophilic region of A1-40 is involved
in the interaction between the monomer peptide and the Gd3+
complex. Finally, ex vivo biodistribution experiments were conducted in healthy mice by using 111In labelled analogues. Their
pancreatic uptake, ~3 %ID/g, is promising to envisage amylin imaging in diabetic animals.
Introduction
Correct folding is essential for proteins in order to maintain long-term stability and biological function.[1] Today, a wide range of
pathologies are known to be directly linked to protein misfolding and amyloidogenesis, including prion disease, amyotrophic
lateral sclerosis, cerebral amyloid angiopathy, type II diabetes and Parkinson’s, Huntington’s and Alzheimer’s diseases.[2]
Amyloidogenesis involves a cascade of processes that start with the unfolding or misfolding of originally folded globular proteins and lead to the formation of soluble and insoluble toxic oligomer/polymer cross-β-sheet fibrillary aggregates, referred to as amyloids.[3] Cytotoxicity is increased by the concomitant
generation of reactive oxygen species during amyloidogenesis. Metal ions, typically Cu2+, Zn2+ and Fe3+, are also implicated in the
aggregation processes and metal ion coordination to the amyloid peptide plays a further role in inducing oxidative stress.[4]
It was evidenced early on that amyloidogenesis occurs well before the earliest clinical symptoms of the diseases. Consequently, amyloid peptide deposits have been long considered as relevant biomarkers for diagnostic molecular imaging.[5] Beyond diagnostic
purposes, the visualization of amyloid proteins is also important for a better delineation of the molecular mechanisms underlying the diseases or for monitoring potential therapeutic approaches. The greatest progress, attaining clinical applications, has been achieved in the context of Alzheimer’s disease (AD). Today several 18F labelled Positron Emission Tomography (PET) tracers
(florbetapir, flutemetamol and florbetaben) are clinically available to detect the presence of senile amyloid A plaques in the brain.[6]
These molecular imaging probes have the advantage of possessing blood brain barrier (BBB) permeability, which, together with the low quantities required for PET detection, largely facilitated their translation into clinical application.
2
Metal complexes provide great versatility for the development of molecular imaging agents in general, including various imaging modalities such as magnetic resonance imaging (paramagnetic Gd3+ or Mn2+ chelates), nuclear (PET or SPECT with complexes
of + or -emitting metal isotopes, respectively) or optical
techniques (luminescent metal complexes). However, the typically larger size and more hydrophilic character of metal complexes, as compared to the previously mentioned small fluorinated PET tracers, severely limit their brain penetration, thus their utility for imaging in Alzheimer’s disease. The problem is further complicated for the low sensitivity MRI detection which requires large quantities of the imaging probe.[7] Consequently, in
Alzheimer’s disease, only few successful examples of in vivo visualization of brain A are known using metal-based imaging agents, and these are mainly restricted to nuclear imaging.[5a]
Less effort has been dedicated to the imaging of other types of amyloid peptides relevant to diseases other than AD. Not all amyloid pathologies concern the central nervous system, and in these cases, reaching the target can be easier for the imaging agent, even in larger quantities such as required for MRI. For instance, Cerebral Amyloid Angiopathy (CAA) is characterized by amyloid deposition in the walls of cerebral vasculature, and low brain uptake of the imaging probe is even important to differentiate CAA from AD. 99mTc-hydroxamamide complexes of
multivalent ligands bearing stilbene and benzothiazole amyloid recognition units were used to highlight amyloid in CAA.[8]
Another example concerns SPECT detection of amylin in the pancreas with a 99mTc complex.[9] Amyloid deposits in pancreatic
islets appear in >90% of type 2 diabetes mellitus (T2DM) patients and their quantity has been recognized as a direct indicator of disease severity. Amylin or islet amyloid polypeptide (IAPP) is a 37-amino-acid peptide co-secreted with insulin by β-cells. The inhibition of amylin aggregation contributed to better glucose homeostasis in animal model studies.[10] Moreover, recent studies
evidence a crosstalk between AD and diabetes via the implication of amyloid peptides.[11]
Metal complexes have been also widely explored for therapeutic purposes, mostly in relation to Alzheimer’s disease. The interaction of metal chelates with the A peptide is able to influence the aggregation pathway, modulate oxidative stress and toxicity. Despite the difficulties associated with the lack of sufficient BBB permeability, complexes of many transition metal ions, including V(V), Mn(II), Re(I), Re(V), Fe(II), Fe(III), Ru(II), Co(III), Rh(III), Ir(IIII), Pt(II) have been studied in this context.[12]
In the past, we described a series of DOTA or DOTA-monoamide ligands bearing a PiB unit as A-targeting vector. These macrocyclic scaffolds form stable complexes with a variety of metals, including Gd3+, 111In3+ or 68Ga3+, which were proposed
respectively as potential agents to detect A amyloid peptide in MRI, SPECT or PET imaging.[13] These studies revealed that the
conjugation of a metal complex to the PiB unit leads to a significant affinity decrease towards A. BBB permeability of the chelates was limited, similarly to analogous Gd3+ complexes
reported by Bort et al.[14] Brain penetration could be slightly
improved through non-covalent attachment of the complexes to carbon nanotubes.[15]
In general, most of the metal complexes proposed either for imaging or for therapeutic purposes are amphiphilic, composed of a rather hydrophilic metal-coordinating unit and a hydrophobic amyloid-targeting moiety. Depending on the concentration and the surrounding medium, such amphiphilic molecules tend to form
micelle-like aggregates, in which the peptide-recognition moiety can be more or less shielded, thereby likely impacting the interaction with the amyloid peptide. Despite the abundant literature on amyloid-binding metal chelates, this aspect has not been so far addressed.
The present study had three major goals. On a long-term perspective, we aim to propose potential MRI probes for the detection of islet amyloid polypeptide in the context of type 2 diabetes. In contrast to the constraints in brain delivery, the pancreas can be more easily accessible for large quantities of Gd3+ complexes. Thanks to its excellent resolution and
non-invasiveness, MRI could be then the imaging modality of choice to better understand the set-in of diabetes and to monitor its early stage evolution. However, no amylin-targeted small Gd3+
complexes have been so far reported, and while several organic molecules have been compared with respect to their affinity to amylin and A, no data exist for Gd3+ complexes. The second
objective was to approach nanomolar affinity of metal complexes by further optimizing their chemical structure by elongating the linker between the DOTA and the biovector. Finally, in a more general consideration, we wanted to assess how micellar aggregation promoted by the amphiphilic nature of amyloid-targeted metal complexes influences their interaction with amyloid peptides.
In these objectives, we have investigated three Gd3+ chelates
bearing a PiB unit, attached via either an amide or an ether oxygen to an alkyl (C5, C6 or C10) linker (Figure 1). Ligands L1[13e]
and L2[15] have been previously described, while L3 was
specifically designed here to space the PiB at a further distance from the macrocycle and increase affinity. We have assessed micellar aggregation of the Gd3+ complexes by relaxometry (when
possible) and UV-Vis spectroscopy. By using surface plasmon resonance, we have quantitatively characterized the affinity of the chelates to A and amylin present in a controlled aggregated form, as well as to human serum albumin. The interactions were further assessed by fluorescence and relaxometric studies and by high resolution NMR. Finally, ex vivo biodistribution data have been acquired in mice to assess the biological fate of these complexes.
While these studies evidence first of all the large complexity of the systems, they also indicate that careful molecular design allows for very high peptide affinities. In a more general perspective, they point out that concentration-dependent aggregation phenomena should not be neglected when considering the interaction of biomolecules with amphiphilic metal complexes.
3
Results and Discussion
Synthesis. The synthesis of DO3A-PiB,[13c] L1[13d] and L2[15] have
previously been described and L3 has been prepared as shown in Scheme 1.
Compound 1 is obtained following the procedures described in the literature.[15] Then, the C10 linker is introduced by O-alkylation
of N-(10-Bromodec-1-yl)phthalimide, giving compound 2, and the phtalimide protecting group is quantitatively removed with hydrazine hydrate. Acylation of amine 3 is performed with chloroacetyl chloride and the product 4 obtained is engaged in a nucleophilic substitution reaction with commercial DO3A-tBu to afford the protected ligand 5. L3 is finally obtained after the removal of the tert-butyl protecting groups in acidic conditions. Gadolinium complexes are prepared by adding GdCl3 at a
controlled pH of 5.5.
Scheme 1. Synthesis of L3. Reagents and conditions were as follows: a)
N-(10-Bromodec-1-yl)phthalimide, K2CO3, acetone, reflux, 72h, 77%; b) NH2NH2,
reflux, 2h, 95%; c) chloroacetyl chloride, NEt3, THF, 0°C, 3h, 85%; d)
DO3A-tBu, K2CO3, CH3CN, reflux, 16h, 72%; e) HCl, 1,4-dioxane, RT, 3h, 67%;
Lipophilicity of the complexes. Lipophilicity, typically
characterized by the water–octanol partition coefficient, logPoct/water, is an important parameter to predict the capability of
molecules to cross biological membranes, including the BBB. A certain lipophilicity is also important for amyloid peptide affinity; though obviously it is not the only determinant.[16] LogP
oct/water
values were measured by the “shake flask” method for GdL2 and GdL3, as it was previously done for GdL1.[13d] They increase in
the order of GdL1, GdL2 and GdL3 (0.03, 0.63 and 1.46, respectively). Between GdL2 and GdL3, the strong lipophilicity increase reflects the elongation of the alkyl chain from C6 to C10. GdL1 and GdL2 differ first of all in the orientation of the PiB, which by itself, does not affect lipophilicity as it was evidenced for Re complexes.[16] Therefore, the lower logP
oct/water determined for
GdL1 with respect to GdL2 is mainly the consequence of the hydrophilicity of the amide function linking the PiB to the C5 chain. In overall, these values fall in the range reported for metal complexes appended with a PiB or other recognition units for amyloid peptides.[13e, 17]
Micellar aggregation of the metal chelates. In aqueous
solutions of amphiphilic metal chelates such as GdL1, GdL2 and GdL3, micellar aggregates can form when the concentration exceeds a threshold, commonly called the critical micellar concentration (cmc). However, premicellar aggregates can exist
already at 2-3 orders of magnitude lower concentrations, often called critical premicellar concentration.[18] Such premicelle
formation has been observed in solution of amphiphilic Gd3+
complexes.[19] Premicelle formation as well as the transition
between premicelles and micelles affect many physical-chemical properties (conductivity, optical parameters, etc) which can be used to determine the critical premicellar or micellar concentration. For paramagnetic complexes, the water proton relaxation rate is an additional parameter that can be exploited to assess the cmc.[20] The relaxation rate is linked to the motional
dynamics of the system, thus showing an important change from a monomeric to a micellar state of the complex. By plotting the paramagnetic relaxation rates vs. the concentration, a break in the curve is observed at the cmc. By this relaxometric method,
cmc = 1.0 mM was previously determined for GdL1.[13d] When we
performed the same experiment for GdL2 and GdL3, we did not observe any break in the concentration range accessible for relaxation rate measurements (> 0.1 mM; below the measurements are not reliable), indicating that the cmc for these systems is below 0.1 mM and its determination is not possible by relaxometry.
Therefore, we took advantage of the optical properties of the PiB unit in the complexes to assess micellar aggregation. Concentration-dependent UV-Vis absorption spectra have been recorded for the three Gd3+ complexes. (Figures S1-S3 in ESI).
The absorption band centred at ~350 nm undergoes a hypsochromic shift of ~12 nm upon increasing the concentration, a change that we can ascribe to the aggregation process. The plot of the relative absorbances at two wavelengths, characteristic of this hypsochomic shift, allowed determining cmc values, which are 15, 30 and 5 M for GdL1, GdL2 and GdL3, respectively. The
cmc previously obtained for GdL1 from relaxometry (1 mM) is well
above the one determined by UV-Vis. The two techniques give access to concentration ranges which do not overlap, thus they allow assessing different aggregation steps. Therefore, the combined UV-Vis and relaxometric results suggest that, as a function of the concentration, different micellization regimes exist in GdL1 solution. They can be likely associated to premicellar aggregation and micelle formation, each characterized by a “threshold” concentration which we denote as cmc. Analogously to GdL1, a UV-Vis study performed on the La(DO3A-PiB) complex (Fig. S4) yielded a cmc of 53 M, while another cmc of 1.5 mM was previously obtained by relaxometry.[13c]
Particle size has been measured by dynamic light scattering as well as particle charge assessed at different concentrations. The charge measurements confirm the neutrality of the particles, as expected. On the other hand, light scattering data indicate extremely polydisperse systems for the three compounds and under all conditions, with some proportion of very large aggregates even at low concentrations (Table S1 and S2).
Interaction of the Gd3+ complexes with A
amylin and human serum albumin
Surface plasmon resonance. A number of experimental
techniques, including thioflavin T fluorescence assay, NMR and EPR spectroscopy, mass spectrometry, circular dichroism spectroscopy, etc. have been reported to investigate interactions between metal complexes and amyloid peptides, mostly A.[12]
Radioactive competition experiments and surface plasmon resonance (SPR) are also widely used for quantitative
4
assessment. One advantage of SPR is that the peptides can be immobilized on the sensorchip in a controlled aggregation state. For this, we have followed a recent protocol established by Lee et al.[21] based on ultrasound treatment-driven decomposition of the
amyloid into shorter fibrils, which are then conjugated to the sensorchip, followed by reconstruction to mature fibrils by successive monomer addition and heating. Two different immobilization levels (~4000 RU and ~9000 RU) have been tested. Typically, low immobilization is interesting to prevent steric effects and non-specific interactions. On the other hand, given the relatively small molecular weight of our complexes with respect to the peptides, higher immobilization levels can allow for better sensitivity and for the assessment of interactions at very low GdL concentrations.
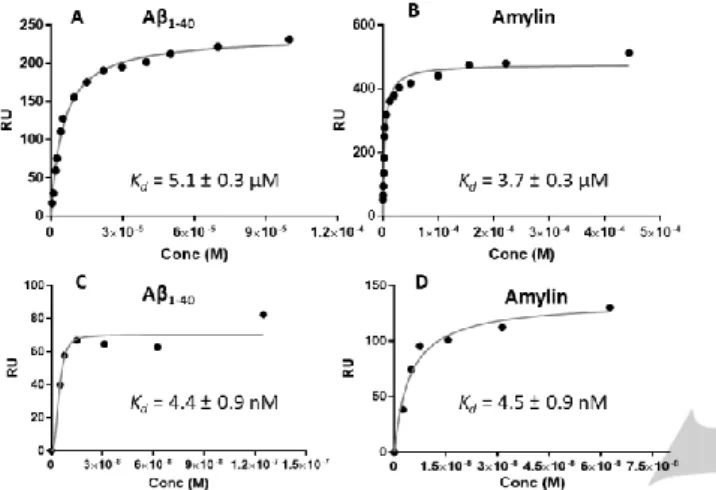
Figure 2. SPR binding plots fitted as Langmuir isotherm functions for the
interaction of GdL3 with A1-40 (A and C) and amylin (B and D). Peptide
immobilization was 4000 RU (A, B) and 9000 RU (C, D). For C and D, points recorded only at low concentrations are represented.
The SPR data have been analyzed according to a 1:1 Langmuir model to yield dissociation constants, Kd, for the interactions of all
three complexes with aggregated A1-40 and amylin, as well as
with human serum albumin (HSA). In the case of GdL1 and GdL2 with both A1-40 and amylin, similar results were obtained
independently of the immobilization level on the chip (Fig. S5, S6 in ESI). In contrast, for GdL3, the higher immobilization revealed an additional interaction in the nanomolar concentration range, with a Kd of 4.4 nM and 4.5 nM for A1-40 and amylin, respectively
(Fig. 2). All dissociation constants are listed in Table 1.
The dissociation constants of GdL1, GdL2 and GdL3, calculated from the entire concentration range used in the SPR experiments, are all in the M range, varying little from one complex to the other; though GdL3 has slightly better affinities. The chelates do not show selectivity for any of the peptides, the Kd values are
practically identical for A1-40 and amylin in the case of GdL2 and
GdL3. This holds also true for Gd(DO3A-PiB) for which the amylin binding has been now assessed as well to complete the previous study with A1-40 (Table 1). GdL1 has a tenfold higher affinity for
amylin than for A1-40; the reason for this is difficult to identify at
this point. The dissociation constants of GdL1, GdL2 and GdL3 are lower than those we previously reported for analogous PiB-derivative lanthanide complexes with A1-40 (67-160 M).[13e] The
reason is likely the lack of control of the A1-40 aggregation state
in those previous experiments.
Table 1. Dissociation constants, Kd, determined by fitting the SPR data to 1:1
Langmuir isotherms.
Kd A1-40 amylin HSA
GdL1 71±9 µM 8.3±0.9 µM 1700±300 µM GdL2 16±2 µM 17.2±0.7 µM 300±8 µM L2- 68±5 µM 30±3 µM - GdL3a 5±0.2 µM 3±0.9 µM 36±7 µM GdL3b 4.4±0.9 nM (only from data between 0 and 125 nM) 4.5±0.9 nM (only from data between 0 and 62.5 nM) - Gd(DO3A-PiB) 170 µM(c] 154±10 µM 1100 µM[d]
[a] immobilization: ~4000 RU. [b] immobilization: ~9000 RU. [c] measured for La(DO3A-PiB), ref. [13e], [d] measured by relaxometric titration, ref. [13a].
Importantly, the very high peptide immobilization level allowed revealing an additional interaction in the nanomolar range between GdL3 and both amyloid peptides. This affinity, similar to that of the PiB itself (Ki = 4.7 nM obtained from radiocompetition
experiments),[22] is particularly remarkable, and shows the
importance of very long and hydrophobic spacers between the targeting unit and the metal complex to retain high affinity. We should note that non-specific interactions between the complexes and the peptides can be likely neglected. Indeed, SPR experiments performed with a GdDO3A-monoamide chelate bearing a C12 alkyl chain did not show any interaction with the amyloid peptides.
Bort et al. have reported a series of DOTA- and PCTA-complexes with 2-arylbenzothiazole, 2-arylbenzoxazole or stilbene functions.[14] They determined K
i values for A1-42 interactions by
radiocompetition experiments with the radiolabelled molecule [125I]IMPY ([125
I]6-iodo-2-(40-dimethylamino)-phenyl-imidazo[1,2-a]pyridine). This technique also allows for accessing to a very low concentration range, thus potentially very high affinities. Nevertheless, the Ki values obtained for the complexes were
between 220 nM and >1000 nM, corresponding to considerably lower affinities than those attained by GdL3. This difference can be likely attributed to the much shorter and more hydrophilic spacers used by them, which do not keep sufficiently far from the amyloid recognition the metal chelate moiety.
Concerning the interaction between metal complexes and amylin, less data are available. Yoshimura et al. reported 99mTc
complexes bearing a pyridyl-benzofurane (PBF) attached via a triethylene glycol spacer.[9] The best affinity, determined by
radiocompetition, was Ki = 146 nM, two orders of magnitude
below the Ki of the 125I-labelled PBF (2.66 nM), indicating a strong
affinity loss induced by the Tc complex. Here the spacer (9 atoms) was almost as long as in our GdL3 (10 atoms), however the hydrophilicity of the PEG seems to limit peptide binding. HSA is the most abundant plasma protein, capable of binding molecules of very different structures. HSA-binding can hence modulate their pharmacokinetics. The affinity of our complexes to HSA is strongly increasing in the order of GdL1, GdL2 and GdL3, but it is always 1-2 orders of magnitude lower than the affinity to the amyloid peptide aggregates (Fig. S7 and Table 1). Such
5
moderate HSA affinity can be interesting in order to extend the blood circulation time of the complexes and to facilitate for them to reach the target.
The case of GdL3, where a very high affinity interaction could be also identified at low concentrations, revealed the limits of a simple Langmuir model to describe the SPR data in the entire concentration range. Scatchard linearization is often used to identify multiple binding. For this, the maximum SPR response divided by the concentration (RUmax/c) is plotted as a function of
RUmax and gives a straight line with a slope of -1/Kd. We have
re-analysed all the SPR data (the interaction of the three complexes with A1-40, amylin and HSA). Interestingly, most of the Scatchard
plots show more than one regimes, each characterized by well-defined straight lines (Figure 3).
Our complexes, as previously shown, form micellar aggregates at higher concentrations. An inspection of the Scatchard plots shows that the breakpoints correspond to GdL concentrations which, for a given chelate, are independent of the nature of the peptide (A 1-40 or amylin). More interestingly, these concentrations are in the
same order of magnitude as those identified as cmc values (Table 2). The GdL1-A1-40 system does not show any breakpoint; and
indeed, we note that the concentration range used for SPR (30 µM - 1 mM) does not include the cmc values for GdL1 (13 M and 1 mM). We have also analysed the SPR data for previously studied complexes, including Gd(DO3A-PiB)[13e] or the
tetraacetate derivative Gd(DOTAGA-PiB).[13a] Again, the
Scatchard plots present two straight lines with a breakpoint corresponding to the cmc value of the complexes (Fig. S8 and Table 2). All these findings seem to indicate that the different aggregated forms of the GdL complexes interact differently with the amyloid peptides and with HSA (see Fig. S9 for HSA plots). We should note that in general, a break in the Scatchard plot indicates multiple binding. This could be a potential explanation for our systems as well. Nevertheless, the fact that the breakpoint concentrations are more characteristic of the GdL complex itself than of the amyloid peptide, and their similarity with the cmc strongly suggest that these breaks are related to the transition to a differently aggregated state of GdL. These differently aggregated micellar states seem to have different peptide affinities.
In principle, the slope of the Scatchard plots provides a Kd value.
Nevertheless, in this kind of analysis, the low concentration points are overweighed, which can lead to inaccurate Kd. Further, it is
obvious that our systems are complex, with potentially different aggregated forms of GdL, and therefore the determination of an individual dissociation constant for each regime would be physically meaningless. We prefer to interpret the “effective” dissociation constants presented in Table 1.
At pH 7.4, the GdL1, GdL2 and GdL3 complexes are neutral, while A1-40 is negatively (PI = 5.3) and amylin is positively
charged (PI = 8.9). In order to gain insight into the role of the charge in the interaction, we have carried out SPR experiments with the non-complexed ligand L2. At neutral pH, the ligand alone has a negative overall charge, as a result of the three
deprotonated carboxylate and two protonated macrocyclic amine functions. For amylin, there is less influence of the charge (Kd
values 30 and 17 M for L2 and GdL2, respectively), while with A1-40, the affinity is slightly decreased for the negatively charged
L2 (Kd = 68 vs. 20 M for GdL2).
In overall, these SPR studies and in particular the Scatchard analysis revealed a large complexity of the systems, which should be always kept in mind when interactions between amphiphilic metal complexes and amyloid peptides are considered.
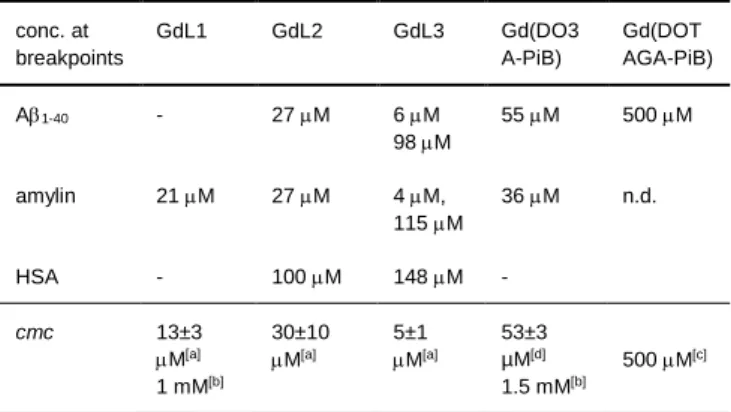
Table 2. Concentrations corresponding to the breakpoints of the Scatchard
plots for the different GdL-peptide interactions and cmc values of the GdL complexes conc. at breakpoints GdL1 GdL2 GdL3 Gd(DO3 A-PiB) Gd(DOT AGA-PiB) A1-40 - 27 M 6 M 98M 55 M 500 M amylin 21 M 27 M 4 M, 115 M 36 M n.d. HSA - 100 M 148 M - cmc 13±3 M[a] 1 mM[b] 30±10 M[a] 5±1 M[a] 53±3 µM[d] 1.5 mM[b] 500 M[c] Figure 3: Scatchard linearization of SPR experiments for the interaction between GdL complexes and A1-40 or amylin. The complex concentrations corresponding to each
6
a
from UV-Vis b
from relaxometric data, ref.[13c]c
from relaxometric data, ref. [13a] d
from UV-Vis, determined for the La(DO3A-PiB).
Thioflavin-T fluorescence assays
To further probe the interaction of GdL1, GdL2 and GdL3 with the peptides, their impact on the aggregation kinetics of A1-40 was
investigated by Thioflavin-T (ThT) fluorescence measurements (Figure 4). This gold standard technique relies on the use of a fluorescent probe that turns-on upon intercalation in β-sheets, the main constituent of amyloid fibrils. The kinetic curve is then described by an s-shape curve according to:
𝐹(𝑡) = 𝐹0+
𝐹𝑚𝑎𝑥−𝐹0
1+𝑒−𝑘(𝑡−𝑡1/2) (1)
where F(t) is the ThT fluorescence intensity at a given time, F0
and Fmax are the starting and final intensity values of the ThT
fluorescence, respectively, k is the elongation rate and t1/2
corresponds to the time where the ThT fluorescence intensity equals half of the (maximum – initial) ThT fluorescence intensity.[23] The curve is split into three parts (i) the lag phase
during which nuclei are formed, (ii) the growth phase corresponding to the elongation of fibrillary species from the nuclei and (iii) the plateau phase when the β-sheet content of the mixture is stable.
The effect of the compounds was investigated at 20 µM A1-40
concentration and at various stoichiometries (0.1-2.0 equivalents) of GdL. The A1-40 aggregation is consistent with previous
reports[24] characterized in our experimental conditions by a t 1/2 of
about 15 hours. With respect to their impact on A1-40 aggregation,
GdL1 behaves differently from GdL2 and GdL3. GdL1 accelerates the aggregation process, translated by a shorter t1/2, and
enhances the β-sheet content in line with a higher maximum ThT fluorescence. In contrast, both GdL2 and GdL3 induce an increase in t1/2 and a decrease in the maximum fluorescence
(Table 3). It is worth noting here that such a decrease in ThT intensity may originate from a competition between ThT and the GdL2 or GdL3 complex for a possibly common binding site. For all compounds, the effects observed on t1/2 and on the
maximum fluorescence intensity increase with stoichiometry, although they are observable from 0.1 equiv. of GdL1 and GdL3 and 1.0 equiv. of GdL2 (Figure 4). In addition, it is observed that GdL3 is more potent than GdL2 in delaying the aggregation process and in diminishing ThT fluorescence intensity.
From these experiments, it thus appears that GdL1 has a different and a much less pronounced effect on peptide aggregation as compared to GdL2 and GdL3. This is likely related to the different orientation of the 2-aryl-benzothiazole moiety with respect to the Gd3+ containing macrocycle. This might indicate that during the
aggregation process the interaction with the β-sheets is enhanced by the dimethyl aniline part of the 2-aryl-benzothiazole moiety. In addition, in line with the order of affinity for pre-formed peptide fibrils as evaluated above by SPR, GdL3 has a higher impact on the aggregation kinetics as compared to GdL2. This is particularly obvious at the sub-stoichiometric ratio (Table 3 and Figure 4).
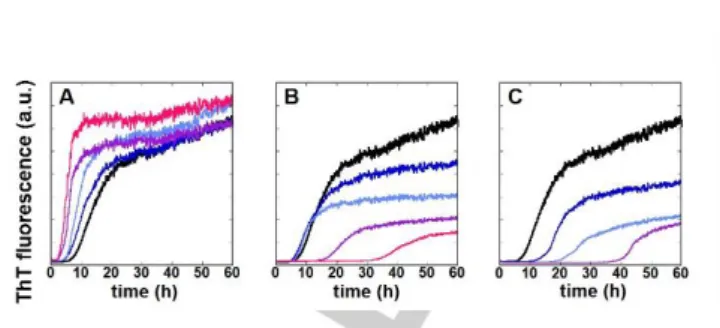
Figure 4. Average of representative kinetic experiments of A1-40 aggregation
as monitored by ThT fluorescence in the presence of GdL1 (A), GdL2 (B) and GdL3 (C) as a function of the GdL:peptide stoichiometry (black = apo peptide; blue = 0.1 equiv. of GdL ; light blue = 0.5 equiv. of GdL ; purple = 1.0 equiv. of GdL and pink = 2.0 equiv. of GdL). [A1-40] = 20 µM, [Hepes] = 20 mM, pH = 7.4.
[ThT] = 10 µM.
Table 3. Key kinetic parameters describing the aggregation of A1-40 in the
presence of GdL1, GdL2 and GdL3. The values represent the average of at least two independent experiments with data recorded in quadruplicate.
t1/2 [a] (hours) Fmax-F0 [a]
equiv. GdL 0.1 0.5 1.0 2.0 0.1 0.5 1.0 2.0 GdL1 0.86 0.61 0.48 0.43 1.05 1.20 1.04 1.21 GdL2 1.0 0.8 1.2 2.1 0.90 0.67 0.51 0.26 GdL3 1.3 1.5 1.6 1.9 0.77 0.51 0.41 0.33
[a]
Values are normalized with respect to value of the peptide alone.
Relaxometric studies. The efficacy of a paramagnetic complex
to act as an MRI contrast agent is related to its capacity to enhance the nuclear relaxation of surrounding water protons. Proton relaxivity, r1, is defined as the increase of the longitudinal
water proton relaxation rate induced by the Gd3+ chelate referred
to 1 mM concentration. Relaxivity depends on different dynamic and structural features of the complex, such as the number of water molecules directly coordinated to the metal ion, their exchange rate with bulk water, and the rotational dynamics of the molecule. When the complexes bind to amyloid peptides or to other proteins, their rotational motion becomes slower, and consequently, their proton relaxivity increases. As predicted by the Solomon-Bloembergen-Morgan (SBM) theory of paramagnetic relaxation, this effect is strongly dependent on the magnetic field, being the most important at “intermediate” fields (0.5-1.5 T, corresponding to ~20-60 MHz proton Larmor frequency). Relaxation rate measurements are commonly used to study the binding of paramagnetic complexes to macromolecules, such as proteins.
We have recorded Nuclear Magnetic Relaxation Dispersion (NMRD) profiles, which represent relaxivity as a function of the proton Larmor frequency, for GdL2 and GdL3 (Figures S10 and S11), data on GdL1 were previously reported.[13d] Both complexes
show a relaxivity hump centred at 20 MHz with a maximum of r1
= 12.5 and 12.3 mM-1s-1, respectively (37°C). This is characteristic
of slowly tumbling systems and results from micellar aggregation in the samples (cGdL = 0.2 mM). The relaxivities are practically
constant between 25°C and 37 °C. Given the complexity of the systems, the fitting of the NMRD curves to the SBM theory seems difficult. Nevertheless, the temperature invariance indicates that,
7
upon temperature increase, the effect of a faster water exchange rate is counterbalanced by the effect of faster rotation.
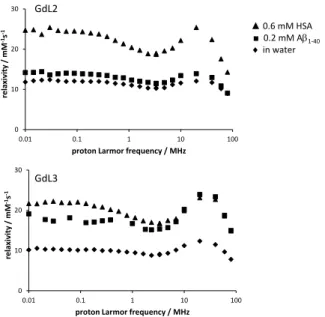
Figure 5. Proton NMRD profiles of GdL2 (top) and GdL3 (bottom) at 37 °C in
water (), in the presence of 0.2 mM A1-40 (■) or 0.6 mM HSA (▲). cGd = 0.2
mM
In the presence of equimolar concentration of A1-40, the profile of
GdL2 remains very similar (Figure 5). Under these conditions and based on Kd = 16 M, ~75 % of the complex is bound to the
peptide. Thus, the similar relaxivities measured in the presence of A1-40 suggest that the rotational dynamics of GdL2 (more
precisely the Gd-water proton vector) is not significantly different between the micellar and the peptide-bound state. In contrast, the high field relaxivities of GdL3 double in the presence of A1-40,
indicating an important immobilization of the complex in the peptide-bound state (present in 86 % according to Kd = 5 M) with
respect to the micellar form (Figure 5). This also seems to be in accordance with the stronger affinity of GdL3 to A1-40, even if it is
not straightforward to directly relate the restriction in motional mobility of the chelates, as represented by the relaxivity increase, to their peptide affinity.
Unfortunately, it was impossible to investigate the effect of amylin binding, since solutions containing amylin and the complexes in concentrations high enough for relaxometric measurements are prone to precipitation during the relaxometric measurement time. In the presence of physiological concentrations of HSA (0.6 mM), the relaxivity of both GdL2 and GdL3 increases (Figure 5), indicating protein binding, as it has been previously observed for GdL1.[13d]
NMR studies
NMR was used to study the interaction of GdL2 with the 15
N-labeled Aβ1–40 peptide in the monomer state and to identify the
peptide regions involved in this interaction. For that purpose, the
changes in the 1D 1H and 2D 1H-15N-HSQC spectra of 100 µM 15N-Aβ
1-40 were followed upon addition of increasing amounts of
GdL2.[13a, 13e] These experiments were performed at low
temperature (5 °C) to minimize NMR signal loss due to amide hydrogen exchange with water and the broadening effect resulting from peptide self-association. This peptide has a predominant random coil structure with two residue segments prone to adopt a β sheet conformation (segments 16-24 and 31-36), two regions prone to adopt a poly-proline type II helix (PII- helix, residues 1-4 and 11-15), and two regions without ordered structure but with high mobility connecting these two structural elements (residues 5-10 and 25-30) (Figure S12).[25]
The 2D 1H-15N-HSQC spectrum of 15N-Aβ
1-40 in water is shown in
Figure 6B, expanded in the region of the 1H-15N of the peptide
backbone and excluding the 1H-15N amide signal of the side chain
of the residues Q15 and N27 and the 1H-15Nɛ signal of the R5 side
chain. All the cross-peaks from the backbone HN groups appear in this expanded spectrum, except the solvent exchange broadened resonances from D1, A2, H6 and H14.[26] Even though
there is some peak overlap, the peak assignments (Figure 6B) correspond to previous reports.[13a, 13e, 25, 27] Addition of 0.5 and 1
equivalents of GdL2 to the 15N-Aβ
1-40 peptide caused only slight
signal broadening with no shifts in the 1D and 2D spectra of 15
N-Aβ1-40 (Figures 6A and S2). Figure 6C shows the superposition of
the 2D 1H-15N HSQC spectra of the peptide alone and in the
presence of one equivalent of GdL2, showing that there are no significant changes in the spectrum. However, in the presence of 2 and 4 equivalents of GdL2, a selective broadening of some signals is observed (Figure 6A, D and S13).
In the presence of 4 equivalents of GdL2, these broadening effects became drastic, causing the disappearance of some of the signals. (Figure 6D). These signals correspond to residues concentrated in the hydrophilic F4-F20 region of the peptide (highlighted in Figure S12), and the signals from some residues outside this region (E22 and G25) are also broadened to a lesser extent. However, the G29-V40 hydrophobic region is not affected. These selective signal broadening effects result from specific interactions of the paramagnetic GdL2 NMR relaxation probe (present in solution predominantly in micellar form) with the monomeric peptide, which is strongly dependent on the distance between the Gd3+ ion and the peptide 15N-1H nuclei (r-6). The
interaction with GdL2 could induce conformational changes in the peptide occurring in the μs-ms time scale, producing signal broadening, as noted before for the interaction of Aβ1-40 with
diamagnetic surfactants such as sodium dodecyl sulfate,[28] congo
red[29] and hydrophobic molecules like lacmoid,[27] where the
signal loss was interpreted by the formation of heterogeneous aggregates able to interconvert in the NMR time scale. In our case, the large broadening observed at higher GdL2 excess are more likely dominated by paramagnetic relaxation effects. These data evidence a relatively strong interaction (Kd estimated in the
few hundred μM range) of GdL2 with the hydrophilic F4-F20 region of the monomeric Aβ1-40. Similar interaction with the
hydrophilic region of the peptide has been observed previously with the negatively charged Gd(DOTAGA-PiB),[13a] while the
interaction was weaker for the neutral Gd(DO3A-PiB), where the Gd3+-chelate is very close to the PiB moiety.[13e] Therefore, the
interaction of the Gd3+-PiB conjugates with the Aβ1–40 monomer
does not seem to depend on the charge or on the length and the nature of the spacer, as opposed to specific effects observed for their interaction with Aβ1–40 aggregates.
0 10 20 30 0.01 0.1 1 10 100 rel axi vity / mM -1s -1
proton Larmor frequency / MHz
GdL2 0 10 20 30 0.01 0.1 1 10 100 rela xi vit y / mM -1s -1
proton Larmor frequency / MHz
GdL3
▲ 0.6 mM HSA ■ 0.2 mM A1-40
8
Biodistribution studies
To evaluate the biological behavior of these potential imaging probes, their Indium-111 analogues were synthesized and an ex
vivo biodistribution study was performed in healthy wild-type
(C57BL6) mice. L2 and L3 were labelled by reacting ligand solutions with 111InCl
3 for 1h at 50°C and pH 7, and the complexes
were obtained with >98% radiochemical yield. Mice (n=3) were injected intravenously in the tail vein (≈2.5 MBq/mouse) and sacrificed at 2 and 30 min post injection (p.i.), the organs of interest were collected, weighted and their activity measured. The biodistribution data, expressed in percentage of injected dose per gram of tissue (%ID/g ± SD), are presented in Figure 7 and Table S3. Table 4 shows the uptake in the most relevant organs. The radiocomplexes studied show fast clearance and no specific organ retention, as expected for small molecular weight complexes in healthy mice. This is important for a potential detection of amyloid peptides in diseased mice. 111InL2 displays
mainly renal elimination, with kidney retention of 17.9±1.8 %ID/g at 2 min which decreases over time, while 111InL3 shows both
kidney uptake (15.1±1.2%ID/g at 2 min) as well as liver accumulation which increases over time (11.4±1.3 and 21.7±2.5 %ID/g at 2 and 30 min, respectively). In contrast to
11InL2, an uptake is observed for 11InL3 in the liver, spleen and
the intestines, which also increases with time. This indicates rather hepatobiliary/intestinal elimination for 111InL3, in
accordance with the more lipophilic character of trivalent L3 complexes (LogP = 1.46) compared to L2 analogues (LogP = 0.63). The low bone and muscle uptake reveals good in vivo stability for both complexes and excludes potential transmetalation. “Free” 111In is indeed retained by bone and
muscle, with reported values 4-20-fold higher than those of
111InL2 and 111InL3, respectively, even at 6h post injection.[30]
Regarding the pancreas, an accumulation of 2.9±0.4 %ID/g and 3.7±0.6 %ID/g was obtained at 2 min p.i. for 111InL2 and 111InL3,
respectively. These uptake values are promising and allow for envisaging the potential detection of amylin when overexpressed in diabetic animals.
A previous biodistribution study of 111InL2[15] yielded a rather
different biodistribution profile, with uptakes that were higher in the liver, kidney and lung, while lower in the brain. Between the present and the former study, the labelling conditions and the concentration of the samples injected were different; we used micromolar instead of the previous millimolar concentrations. Given the concentration dependence of the micellar aggregation, the concentration difference can likely account for the different biodistribution. A similar effect on the biodistribution has been already observed for amphiphilic complexes.[19]
Concerning PiB-derivative small chelates, previous studies involved ex vivo biodistribution of 111In(DOTA-PiB) in wild type Figure 6. Interaction of GdL2 with 100 µM 15N-Aβ
1-40 in water studied by NMR. A) 1D 1H spectra of the Aβ1-40 peptide (black line), with addition of 0.5
equivalents (blue line), 1 equivalent (green line), 2 equivalents (orange line) and 4 equivalents (red line) of GdL2; 2D 1H-15N HSQC spectra of 15N-Aβ 1-40 B)
alone with the signal assignment based on previous publications, and overlap of this spectrum with that in the presence of C) 1 equivalent (green) and D) 4 equivalents of GdL2.
9
mice[13c], and in vivo PET biodistribution of 68Ga(DOTA-PiB) and 68GaL1 in control mice as well in a transgenic AD murine
model.[13b] 111In(DOTA-PiB) had fast global elimination, while 68GaL1 had slower clearance from highly vascularized
organs/tissues, in agreement with the hydropholic/lipophilic character and HSA affinity of the complexes. The brain uptake is similar for 111In(DOTA-PiB) and 111InL2/L3 (0.36 vs. 0.3 %ID/g at
2 minutes p.i.). This seems to indicate that the increased lipophilicity of 111InL2 and 111InL3 is counterbalanced by their
higher molecular weight to determine brain uptake. 68GaL1
accumulated more in the brain of diseased mice with a compromised BBB than in healthy brain (1.3 vs. 0.5 % injected dose per volume).
For amylin-imaging, two 99mTc-labeled pyridyl-benzofuran
derivatives have been recently proposed and their biodistribution was assessed in normal mice as well as in a mouse model with human amylin transplanted in the pancreas.[9] In normal mice,
both complexes had low pancreatic uptake (0.74%ID/g and 1.37%ID/g at 2 min p.i.), which increased by ~50 % in the disease model mice, but remained still at a much lower level than 111InL2
and 111InL3.
Table 4. Ex vivo uptake of 111In complexes of L2 and L3 in most relevant organs
(%ID/g ± SD).
111InL2 111InL3
2 min 30 min 2 min 30 min Brain 0.3±0.1 0.14±0.02 0.31±0.04 0.21±0.01 Pancreas 2.9±0.4 1.0±0.3 3.7±0.6 1.8±0.2 Kidneys 17.9±1.8 7.4±1.5 15.1±1.2 10.5±1.1 Liver 3.6±0.3 2.8±0.2 11.4±1.3 21.7±2.5 Intestines 2.15±0.05 1.1±0.1 3.0±0.1 5.4±0.7 Lungs 8.0±0.8 3.2±0.2 10.7±1.6 5.0±2.2 Bone 2.3±0.1 0.9±0.1 2.0±0.4 1.8±0.2
Conclusion
We have investigated a series of macrocyclic Gd3+ complexes
conjugated to the amyloid targeting PiB unit via different linkers. Depending on the concentration, these amphiphilic complexes form different micellar aggregates. Surface plasmon resonance studies evidence that nanomolar binding affinities, unprecedented for a metal chelate, are possible to attain with both A1-40 and
amylin when the amyloid recognition unit is separated from the chelate by a long, hydrophobic C10 spacer. The Scatchard analysis of the SPR data indicate different affinity regimes as a function of GdL concentration, which could be related to the presence of different micellar aggregates. The large complexity of
these systems prevents from finely characterizing the aggregated GdL micellar structures and attributing individual affinity constants to them. It is very likely that the monomeric form of the chelates has the highest affinity. Further, each of the different premicellar and micellar aggregates can be characterized by a different affinity. In overall, these studies are important as they clearly indicate that micellar aggregation of metal chelates in general should always be kept in mind when interactions between amphiphilic metal complexes and amyloid peptides are considered. In the future, it would be interesting to extend these studies to other amyloidogenic proteins such as Tau, α-synuclein, PrP or insulin fibrils.
The effect of the chelates on the amyloid peptide aggregation kinetics has been also investigated by Thioflavin-T fluorescence assays. The GdL complexes can either accelerate or slow down the aggregation of A1-40 and this effect seems to depend on the
orientation of the 2-aryl-benzothiazole moiety with respect to the Gd3+ containing macrocycle. Further, a 2D 1H-15N-HSQC study
helped identify that the hydrophilic peptide region is primarily involved in the interaction between GdL2 and monomeric A1-40.
Finally, L2 and L3 have been labelled with 111In and an ex vivo
biodistribution study has been carried out in healthy mice. The radiocomplexes have fast clearance and no specific organ retention, but their uptake in the pancreas looks sufficiently high to envisage amylin detection in diabetic animals.
Figure 7. Ex vivo biodistribution profiles of 111InL2 (a) and 111InL3 in healthy
mice (n=3) at 2 (black) and 30 min (gray) post intravenous injection. Values are presented in % ID/g ± SD. bra in he art live r inte sti ne s mu sc les bo ne pa nc rea s lun gs sp lee n kid ne ys 0 .0 0 .5 1 .0 1 .5 1 0 2 0 3 0 % I D / g 2 m in 3 0 m in bra in he art liv er inte sti ne s mu sc les bo ne pa nc rea s lun gs sp lee n kid ne ys blo od 0 1 2 1 0 2 0 3 0 % I D / g 111
InL2
111InL3
10
Experimental Section
Synthesis. The synthesis of ligand L3 is described in the supporting
information.
Complex preparation. The purity of the ligands was assessed by adding
an excess of ZnCl2 solution to a ligand solution, followed by
complexometric titration of the non-complexed Zn2+ with EDTA. GdL
complexes were prepared by mixing equimolar quantities of a GdCl3 and
ligand solutions under continuous pH adjustment to 5.5. The absence of
free Gd3+ was checked by the xylenol orange test. Gd3+ concentration was
checked by ICP-OES or BMS (Bulk Magnetic Susceptibility) measurements.
LogP determination. The shake flask technique was used. Octanol and
water were respectively saturated with the other solvent. Concentrations were determined by UV-vis spectrophotometry (using the absorption of the benzothiazol ring at 330nm).
Critical micellar concentration. For cmc determination, UV-visible
absorption spectra were recorded on a PerkinElmer Lambda 19 spectrometer at 25 °C, 1 cm quartz cells.
Dynamic light scattering measurements were performed on a Zetasizer
Nano Series ZS (Malvern) instrument with temperature control (37°C). Each sample was measured in quintuple; each measurement is the average of 20 data sets acquired for 10 s. Hydrodynamic diameters have been calculated using the internal software analysis from the DLS intensity-weighted particle size distribution.
Surface plasmon resonance measurements. A Biacore 3000
instrument (Biacore Life Science/GE Healthcare Uppsala, Sweden) was
used for real time studies to assess the binding of the Gd3+ complexes to
immobilized peptides. The immobilization was done on CM5 sensor chips. N-hydroxysuccinimide (NHS) and N-ethyl-N’-[(dimethylamino)propyl]-carbodiimide (EDC) were used for the activation of carboxylate functions. Ethanolamine, HCl, vials for samples and caps were purchased from GE Healthcare. HBS-EP (pH 7.4) which is composed of 0.01 M HEPES, 0.15 M NaCl, 3 mM EDTA and P20 surfactant (0.0005%) was used as running
buffer. Aβ1-40 and amylin were dissolved in acetate buffer pH 5 (0.2mg of
peptide in 500μL) and left at 37°C overnight to form aggregates. The immobilization followed standard amine coupling conditions. Activation of the carboxymethyl dextran matrix on the CM5 chips was realized with the injection, during 420s, of 70μL of the mixture EDC/NHS (200μL of 0.05M NHS and 50μL of 0.2M EDC). After sonication, 50μL of the peptide solution was injected into the activated flow cell with a flow of 10μL /min with 300s of contact time. Unreacted NHS ester is used to grab the peptide to the activated carboxylate groups for the amine coupling reaction. The second step of the immobilization is the elongation phase, consisting of injecting ten times a volume of 400μl of the monomeric peptide with a flow rate of 20μl /min leading to a contact time of 1200s. The unreacted NHS esters were capped with 70μL ethanolamine to result in a surface with a final change in resonance units (RU) equal to 9126.4RU. Knowing that 1.0
pgmm-2 of bound ligand results in 1000RU, it means that the total
immobilized mass of Aβ1-40 is 9.1264 pg.mm-2.
To maximize the contact time, the flow rate was kept at 30μL /min. GdL1, GdL2 and GdL3 solutions were prepared at a concentration of 500μM with the running buffer. 150μL of these solutions was injected with an association and dissociation time equal to 300s each. This procedure was repeated for every complex and every concentration studied. For the
regeneration of the surface, a solution of 100mM glycine –HCl in 10mM
Tris (tris(hydroxymethyl)aminomethane) buffer at pH 9 was used with a contact time of 18s and a flow rate of 100μL /min. Then the flow rate is reduced to 30μL/min, the regeneration solution is re-injected if necessary and the flow cell is washed with the running buffer for 5min before the next injection.
The injection system was checked with every new chip, and primed to change the buffer when necessary. Biacore 3000 control software (version 4.1) was used to record the time dependence of the RUs. The response at equilibrium was plotted versus concentrations. The Langmuir binding isotherm was used to fit the binding plots and obtain the dissociation
constant (Kd), with GraphPad Prism 7 software.
Aggregation kinetics. ThT fluorescence assays for A1-40 aggregation
were performed on a ClarioStar microplate reader system (BMG Labtech)
at 37°C. Thioflavin-T (ThT) was used to probe β-sheet structure
formation[31] (fluorescence measured at 490 nm upon excitation at 440
nm). ThT fluorescence was measured every 5 min for about 100 hours, after 15 s of shaking at 200 rpm. 384-well microplates were used with a total volume of 100 µL for each sample. Different equivalents of GdL
compounds (1 equiv. corresponds to 20 µM solution for A1-40) were added
to the peptide in the presence of 10 µM of ThT in 20 mM HEPES buffer (pH 7.4) and placed in a 384-well microplate.
Note that the experiments were performed 2-5 times (depending on the stoichiometry conditions) on 3 different batches of peptide, by 3 persons, and that in each experiment each condition was recorded at least in quadruplicate. The effects observed always followed the same trend.
Purification of A1-40 for aggregation experiments. The A1-40 synthetic
peptide was bought from GeneCust (Dudelange, Luxembourg), with purity
grade > 95%. Stock solutions of the A1-40 (sequence
DAEFRHDSGYEVHHQKLVFFAEDVGSNKGAIIGLMVGGVV) were
prepared by dissolving the powder (~ 3 mg) in 500 µL of Tris-HCl (0.1 M) with Guanidinium chloride (6 M). The solutions were incubated at 20°C overnight and purified by Fast Protein Liquid Chromatography (FPLC) (column Superdex 75, elution solvent NaOH 15 mM with NaCl 150 mM, flow rate 0.5 mL/min). The peptide concentration in the recovered fractions (500 µL) was then determined by UV-visible absorption of Tyr10
considered as free tyrosine (at pH 12, (ε293-ε360) = 2400 M-1cm-1).
1H NMRD. NMRD profiles of GdL2 (0.2 mM, pH 7) and GdL3 (0.25 mM pH
7) were recorded on a Stelar SMARTracer Fast Field Cycling relaxometer (0.01-10 MHz) and a Bruker WP80 NMR electromagnet adapted to variable field measurements (20-80 MHz) and controlled by a SMARTracer PC-NMR console. The temperature was monitored by a VTC91 temperature control unit and maintained by a gas flow.
NMR studies. NMR spectra for characterizing the interaction of GdL2 with
the Aβ1–40 peptide were recorded on a Bruker Avance III spectrometer
operating at 14.09 T 600.13 MHz for 1H), equipped with a cryoprobe with
three channels (1H, 13C e 15N) and z-gradients. The 15N-labeled A 1–40
peptide, purchased from AlexoTech (Umeå, Sweden), was stored in solid
form at -20ºC and warmed to room temperature before use. 15N-Aβ
1–40 was
initially dissolved as a concentrated 1 mM stock solution in DMSO-d6
(Aldrich), and was diluted 10-fold into a buffer containing 10 mM K2HPO4
and 10 % D2O (99.9%, Cambridge Isotope Labs, UK). The initial pH of the
solution was about 8.2 and it was carefully adjusted to 7.2 by adding very
small amounts of deuterated acetic acid (Aldrich). The final Aβ1–40
concentration was about 100 μM. During sample preparation, the peptide
and the solvents were kept on ice. 1D 1H (16 scans per spectrum) and 2D
1H-15N HSQC[32] spectra (matrix = 1024 for the 1H dimension and 128 for
the 15N dimension, number of scans = 8, sweep width = 10 ppm for 1H and
23 ppm for 15N) were registered at 5 °C. A gradient-based Watergate
module for solvent suppression was employed for the 1D spectrum and no solvent suppression was done for the 2D HSQC experiments. Spectra
were Fourier transformed and analyzed using Topspin 2.1. The 1H shifts
were referenced to DMSO, and the 15N chemical shift was referenced
indirectly to the DMSO derived 1H signal based on the relative
gyromagnetic ratios of these nuclei.[33]
Synthesis of 111In complexes. 111InCl
3 was purchased from
Mallinckrodt/Curiumpharma (Le Petten, Netherlands). The pH of 150 µL
aliquots of 111InCl
3 (112 - 130 MBq) were adjusted to 7 by addition of
freshly prepared NaOH solution. Radiolabelling of L2 and L3 was performed as follows: a) 1 µL of a 1.54 mM solution of L2 was mixed with
150 µL of 111InCl
3 (133 MBq) giving a 13 µM final concentration; b) 50 µL
of an aqueous 1.29 mM solution of L3 was mixed with 150 µL of 111InCl3
(112 MBq) giving a 323 µM final concentration. After readjusting the pH to 7 (with NaOH), the solution was stirred for 1h at 50°C. A radiochemical yield > 98% was obtained and no further purification was performed. Labelling efficiency was followed by ascending silica gel ITLC (Polygram,
Macherey–Nagel) developed with the mobile phase MeOH:H2O:NH4OH
(2:4:0.2). The TLCs were exposed by impregnation on a multisensitive phosphor screen (Packard, Perkin Elmer, Meriden, USA, and revealed on a Cyclone Storage phosphor system Packard, Perkin Elmer, Shelton,
11
111InCl
3 remains at the origin. Prior to injection, the radiocomplex solutions
were diluted with a PBS/saline buffer yielding a final concentration of 1.9 µM for L2 (26.0 MBq) and 39.5 µM for L3 (19.7 MBq).
Biodistribution studies. 8-weeks-old C57BL/6JRj wild type males were
purchased from Janvier Labs (Le Genes Saint Isle, France). All animal experiments were carried out in accordance with the guidelines for animal experiments and under permission number 19861, from the French “Ministère de l’Enseignement Supérieur, de la Recherche et de l’Innovation”. A group of six mice per ligand (25.5±3.3 g and 27.1±2.3 g for
111InL2 and 111InL3 respectively) were injected intravenously (tail vein) with
2.08±0.15 MBq of 111InL2 and 3.10±0.07 MBq of 111InL3 (in 200µL) and an
ex vivo biodistribution study was performed at 2 and 30 min post-injection. After 2 and 30 min, mice were sacrificed by cervical dislocation and the organs of interest (pancreas, brain, kidneys, lungs, heart, liver, spleen, intestine, muscle and bone (femur)) were harvested, weighted and their activity measured using a Carpintec gamma counter as well as a NaI based γ-camera (the acquired spectra are treated with WinTMCA program). Calibration of both equipment was done by measuring a set of 9 solutions with activities between 0 and 2 MBq in both equipment, under the same conditions of the organs’ measurements (distance and time and energy range of measurement acquisition), yielding a good correlation: y
= 3.943x10⁶ ꭓ, R2 = 0.9999. All data were corrected for the activity decay,
bringing the activity to the injection time of each animal, as well as converted to MBq (Carpintec) using the calibration curve obtained. Biodistribution data are presented as % of injected dose per weight of organ (% ID/g) ± standard deviation (n=3).
Acknowledgements
The authors thank the French National Research Agency (grant DIVA ANR-16-CE18-0022-01) for funding. We thank Stéphanie Lerondel and Julien Sobilo, Centre of Small Animal Imaging (CIPA), Orléans, for the biodistribution studies. CH and IR thank Xudong Lin and Lucie de Cremoux for their participation to the aggregation experiments and Dr. Béatrice Mestre-Voëgtlé for her involvement in the DIVA project. CH also acknowledges ERC StG 638712 for funding research on A1-40 aggregation. ACO and
CFGCG thank the Fundação para a Ciência e a Tecnologia (FCT), Portugal, for funding of the Coimbra Chemistry Centre through the programmes UIDB/00313/2020 and UIDP/00313/2020, also co-funded by FEDER/COMPETE 2020-EU. ACO thanks the FCT for the PhD grant SFRH/BD/120934/2016 and PTNMR and Dr. Eurico Cabrita for access to the Bruker Avance III 600 NMR spectrometer.
Keywords: amyloid peptide • A • amylin • metal complex •
micellar aggregation
[1] C. M. Dobson, Nature 2003, 426, 884-890.
[2] C. Giacomelli, S. Daniele, C. Martini, Biochem. Pharmacol. 2017, 131, 1-15.
[3] T. Vajda, A. Perczel, J. Pep. Sci. 2014, 20, 747-759. [4] K. Reybier, S. Ayala, B. Alies, J. V. Rodrigues, S. Bustos
Rodriguez, G. La Penna, F. Collin, C. M. Gomes, C. Hureau, P. Faller, Angew. Chem. Int. Ed. 2016, 55, 1085-1089.
[5] a) S. Lacerda, J. F. Morfin, C. F. G. C. Geraldes, É. Tóth, Dalton Trans. 2017, 46, 14461-14474; b) A. Kaur, E. J. New, M. Sunde, ACS Sens. 2020, 5, 2268-2282.
[6] F. M. Elahi, B. L. Miller, Nat. Rev. Neurol. 2017, 13, 457-476. [7] M. Salerno, D. S. D. Porqueras, Coord. Chem. Rev. 2016,
327-328, 27-34.
[8] S. Iikuni, M. Ono, H. Watanabe, K. Matsumura, M. Yoshimura, H. Kimura, H. Ishibashi-Ueda, Y. Okamoto, M. Ihara, H. Saji, Scientific Reports 2016, 6.
[9] M. Yoshimura, M. Ono, H. Watanabe, H. Kimura, H. Saji, Bioconjugate Chem. 2016, 27, 1532-1539.
[10] N. Wijesekara, R. Ahrens, L. Wu, K. Ha, Y. Liu, M. B. Wheeler, P. E. Fraser, Diabetes Obesity & Metabolism 2015, 17.
[11] P. Bharadwaj, N. Wijesekara, M. Liyanapathirana, P. Newsholme, L. Ittner, P. Fraser, G. Verdile, J. Alzheimer's Dis. 2017, 59, 421-432.
[12] L. M. F. Gomes, J. C. Bataglioli, T. Storr, Coord. Chem. Rev. 2020, 412, 213255.
[13] a) A. F. Martins, A. C. Oliveira, J. F. Morfin, D. V. Laurents, E. Toth, C. F. G. C. Geraldes, J. Biol. Inorg. Chem. 2016, 21, 83-99; b) D. Cressier, M. Dhilly, T. T. C. Pham, F. Fillesoye, F. Gourand, A. Maiza, A. F. Martins, J. F. Morfin, C. Geraldes, E. Toth, L. Barre, Mol. Imaging Biol. 2016, 18, 334-343; c) A. F. Martins, J.-F. Morfin, A. Kubickova, V. Kubicek, F. Buron, F. Suzenet, M. Salerno, A. N. Lazar, C. Duyckaerts, N. Arlicot, D. Guilloteau, C. F. G. C. Geraldes, E. Toth, ACS Med. Chem. Lett. 2013, 4, 436-440; d) A. F. Martins, J.-F. Morfin, C. F. G. C. Geraldes, E. Toth, J. Biol. Inorg. Chem. 2014, 19, 281-295; e) A. F. Martins, D. M. Dias, J. F. Morfin, S. Lacerda, D. V. Laurents, E. Toth, C. F. G. C. Geraldes, Chemistry-a European Journal 2015, 21, 5413-5422.
[14] G. Bort, S. Catoen, H. Borderies, A. Kebsi, S. Ballet, G. Louin, M. Port, C. Ferroud, Eur. J. Med. Chem. 2014, 87, 843-861. [15] P. M. Costa, J. T.-W. Wang, J.-F. Morfin, T. Khanum, W. To, J.
Sosabowski, E. Tóth, K. T. Al-Jamal, Nanotheranostics 2018, 2, 168-183.
[16] K.-S. Lin, M. L. Debnath, C. A. Mathis, W. E. Klunk, Bioorg. Med. Chem. Lett. 2009, 19, 2258-2262.
[17] M. K. Islam, S. Kim, H.-K. Kim, S. Park, G.-H. Lee, H. J. Kang, J.-C. Jung, J.-S. Park, T.-J. Kim, Y. Chang, J. Med. Chem. 2017, 60, 2993-3001.
[18] a) I. Casero, D. Sicilia, S. Rubio, D. Pérez-Bendito, Talanta 1997, 45, 167-180; b) Y. Shi, H. Q. Luo, N. B. Li, Spectrochim. Acta, Part A 2011, 78, 1403-1407.
[19] S. Torres, M. I. M. Prata, A. C. Santos, J. P. Andre, J. A. Martins, L. Helm, E. Toth, M. L. Garcia-Martin, T. B. Rodrigues, P. Lopez-Larrubia, S. Cerdan, C. F. G. C. Geraldes, NMR Biomed. 2008, 21, 322-336.
[20] G. M. Nicolle, E. Toth, K. P. Eisenwiener, H. R. Macke, A. E. Merbach, J. Biol. Inorg. Chem. 2002, 7, 757-769.
[21] a) W. Lee, H. Jung, M. Son, H. Lee, T. J. Kwak, G. Lee, C. H. Kim, S. W. Lee, D. S. Yoon, RSC Adv. 2014, 4, 56561-56566; b) K. Brannstrom, A. L. Gharibyan, T. Islam, I. Iakovleva, L. Nilsson, C. C. Lee, L. Sandblad, A. Pamren, A. Olofsson, Data Brief. 2018, 19, 1166-1170.
[22] C. A. Mathis, Y. M. Wang, D. P. Holt, G. F. Huang, M. L. Debnath, W. E. Klunk, J. Med. Chem. 2003, 46, 2740-2754.
[23] a) E. Atrián-Blasco, P. Gonzalez, A. Santoro, B. Alies, P. Faller, C. Hureau, Coord. Chem. Rev. 2018, 371, 38-55; b) M. G. M. Weibull, S. Simonsen, C. R. Oksbjerg, M. K. Tiwari, L. Hemmingsen, J. Biol. Inorg. Chem. 2019, 24, 1197-1215.
[24] a) J. D. Barritt, N. D. Younan, J. H. Viles, Angew. Chem. Int. Ed.
2017, 56, 9816-9819; b) A. K. Somavarapu, F. Shen, K. Teilum, J.
Zhang, S. Mossin, P. W. Thulstrup, M. J. Bjerrum, M. K. Tiwari, D. Szunyogh, P. M. Søtofte, K. P. Kepp, L. Hemmingsen, Chem. Eur. J. 2017, 23, 13591-13595.
[25] J. Danielsson, A. Andersson, J. Jarvet, A. Gräslund, Magn. Reson. Chem. 2006, 44, S114-S121.
[26] Y. Bai, J. S. Milne, L. Mayne, S. W. Englander, Proteins 1993, 17, 75-86.
[27] C. Lendel, B. Bolognesi, A. Wahlström, C. M. Dobson, A. Gräslund, Biochemistry 2010, 49, 1358-1360.
[28] A. Wahlström, L. Hugonin, A. Perálvarez-Marín, J. Jarvet, A. Gräslund, FEBS J. 2008, 275, 5117-5128.
[29] A. Abelein, B. Bolognesi, C. M. Dobson, A. Gräslund, C. Lendel, Biochemistry 2012, 51, 126-137.
[30] E. Dassin, A. Eberlin, J. Briere, A. M. Dosne, Y. Najean, International Journal of Nuclear Medicine and Biology 1978, 5, 34-37.
[31] a) H. LeVine, in Methods in Enzymology, Vol. 309, Academic Press, 1999, pp. 274-284; b) A. A. Reinke, J. E. Gestwicki, Chem Biol Drug Des 2011, 77, 399-411.
[32] J. Schleucher, M. Schwendinger, M. Sattler, P. Schmidt, O. Schedletzky, S. J. Glaser, O. W. Sørensen, C. Griesinger, J. Biomol. NMR 1994, 4, 301-306.
[33] J. L. Markley, A. Bax, Y. Arata, C. W. Hilbers, R. Kaptein, B. D. Sykes, P. E. Wright, K. Wüthrich, Eur J Biochem 1998, 256, 1-15.