FULL PAPER
Bismuth-Decorated Silicon Photocathodes for CO
2
-to-Formate
Solar-Driven Conversion
Dong Fu,
[a]Jeoffrey Tourneur,
[a]Bruno Fabre,*
[a]Gabriel Loget,
[a]Yaoyin Lou,
[a],[b]Florence Geneste,
[a]Soraya Ababou-Girard
[c]and Cristelle Mériadec
[c][a] Dr. D. Fu, J. Tourneur, Dr. B. Fabre, Dr. G. Loget, Dr. Y. Yu, Dr. F. Geneste Univ Rennes, CNRS
ISCR (Institut des Sciences Chimiques de Rennes)-UMR6226 F-35000 Rennes - France
E-mail: [email protected] [b] Dr. Y. Yu
Univ Rennes, Ecole Nationale Supérieure de Chimie de Rennes CNRS, ISCR-UMR 6226
F-35000 Rennes - France
[c] Dr. S. Ababou-Girard, Dr. C. Meriadec Univ Rennes, CNRS
IPR (Institut de Physique de Rennes)-UMR 6251 F-35000 Rennes - France
Supporting information for this article is given via a link at the end of the document.
Abstract: The integration of metal-based catalysts onto semiconducting electrodes provides a real benefit for the CO2
electrochemical conversion because it allows the electrochemical process to be activated by photogenerated electrons. In that context, we report here that silicon photocathodes modified with electrodeposited Bi nanostructures are highly active for the photoelectrocatalytic conversion of CO2 to formate. Through the
consumed electrical charge and the electrodeposition time, it is possible to finely control both the structure and the density of the deposited catalyst. The optimal photocathode was prepared by using a 5 s electrodeposition time and exhibited the highest photocurrent density (-24.1 mA cm-2) with partial formate photocurrent density j
formate
= -17.4 mA cm-2 at -1.03 V vs Reversible Hydrogen Electrode (RHE),
i.e. a 0.84 V overpotential for CO2 to formate conversion in CO2
-saturated 0.5 M KHCO3 solution. Such values highlight the excellent
photoelectrocatalytic activity of our photocathodes.
Introduction
The electrochemical CO2 reduction reaction (CDRR) to high-added value products using molecular or metallic catalysts immobilized on electrodes remains an intense and major research area since it represents a sustainable route towards storable and renewable feedstocks.[1,2,3] Among the useful chemicals produced from CDRR, formic acid (HCOOH) or formate needs only two protons and two electrons to be produced, but requires slightly more negative reduction potential than that of CO formation.[4] Formate has a high product value per electron ($ 16.1 × 10⁻³ /electron)[5] and is widely employed in industrial areas such as pharmaceutical synthesis and can be converted into syngas.[6] Also interestingly, compared with gaseous products such as CO and hydrocarbons, formate has the advantage of easy storage and transportation.[7] Numerous metal catalysts, such as Pb, Cd, Hg, In, Sn, and Tl (most of them have been widely studied by Hori and co-workers),[8,9,10,11,12] have been demonstrated to promote
the electrochemical conversion of CO2 to formate. Unlike e.g. Au, Ag and Zn converting CO2 to CO, such metals have a weaker affinity toward CO2•- intermediate, which can be easily desorbed from the metal surface. Among them, Bi, which has been first introduced through the pioneering research by Komatsu et al. in 1995,[13] has the advantages of being non-toxic and inexpensive. Bi-based catalysts deposited on conducting carbon-based electrodes electrochemically reduced CO2 to formate with high Faradaic efficiency (FE > 87-90%) in neutral aqueous solutions[14,15,16,17,18,19,20,21,22,23,24,25] while the use of ionic liquids electrolytes rather promoted the formation of CO.[26,27,28,29,30]
In this field of CO2 electrochemical conversion, the use of semiconducting photocathodes instead of non-photoactive traditionally used electrodes (e.g., metals and carbon) could provide a real benefit in terms of energy gain because it allows the electrochemical process to be activated by photogenerated electrons.[31,32] In that context, silicon appears as one of the most promising semiconducting materials owing to its small bandgap (1.1 eV) able not only to harvest photons from a large portion of the solar spectrum but also to encompass the different proton-assisted multielectron reduction potentials for CO2.[33,34]
In spite of favorable energy levels properties, the integration of Bi-based catalysts onto semiconducting silicon electrodes for the CO2 photoelectrochemical conversion has been only reported very recently in two studies.[22,35] In the first one, the catalytic coating was deposited onto oxide-free Si by a Bi3+-assisted chemical etching method from a bismuth salt solution containing hydrogen fluoride.[35] Although such a method offers some benefits in terms of simplicity, controlled morphology and thickness, the most efficient reported photocathode for CO2 -to-formate conversion yielded relatively low cathodic photocurrent densities of ca. 10 mA cm-2 at -1.0 V vs Reversible Hydrogen Electrode (RHE) under simulated sunlight. Higher photocurrent densities of ca. 17 mA-cm-2 were measured in the Gong et al.’s work from Si photocathodes modified with spin-coated Bi2O3 nanotubes.[22] Such a catalytic material was deposited onto Si from a mixture containing Bi2O3 nanotubes (NTs) and a
Accepted
2
perfluorinated polymer, namely Nafion®. Such a polymer is largely used for electrocatalytic purposes owing to its remarkable proton transport properties.[36] Nafion® has however some disadvantages such as a low CO2 permeability [ 37 ] and a high electronic resistance[36]. In addition, as Nafion® constitutes an efficient electrostatic barrier against anionic species, it can be hypothesized that the formate transport across the catalyst-embedding Nafion® layer to the electrolytic solution will be impeded. Also importantly in the context of CO2 solar conversion, a few µm-thick Nafion® layer is sufficient to substantially reduce light intensity transmitted to silicon and thus to decrease the catalytic photocurrent densities.
In this work, we demonstrate that Bi-modified Si photocathodes prepared by electrodeposition without additive polymer matrix yield cathodic photocurrents exceeding 20 mA cm-2 for the simulated sunlight-driven conversion of CO
2 to formate. Electrodeposition has been demonstrated to be a fast, versatile and convenient technique for the growth of Bi nanostructures[19,28, 38 , 39 , 40 ] on different types of conducting surfaces without the requirement of high vacuum or high temperature conditions. Herein, a few seconds electrodeposition was sufficient for producing Bi nanostructures-decorated photocathodes showing the best catalytic performance for CDRR characterized by an onset potential of ca. +0.1 V vs RHE, a light-limited photocurrent plateau of ~24 mA cm-2 and a high Faradaic efficiency of >72% for formate at ca. -1.0 V vs RHE.
Results and Discussion
Preparation of Electrodeposited Bi-modified Photocathodes. Bi0 was electrodeposited on illuminated (see the experimental section for details), freshly hydrogenated p-type Si at -0.3 V vs saturated calomel electrode (SCE) from an aqueous 1 M HNO3 solution containing 20 mmol L-1 Bi(NO
3)3•5H2O. Electrodeposition time was varied from 5 to 60 s and the deposit growth was monitored by chronoamperometry (CA). All CA curves exhibited the same shape for the three tested times (5 s, 30 s, and 60 s) (Figure S1, Supporting Information). The cathodic photocurrent was found to constantly decrease along the first 30 s before reaching a quasi-plateau for higher times. Such a trend is reasonably explained by the light absorption of the growing metallic deposit, which substantially reduces light intensity transmitted to silicon and thus decreases the photocurrent densities. This assumption is supported by the visual appearance of the modified photocathodes revealing an increase in the thickness of the electrodeposited black layer with increasing time (Figure S2).
Characterizations of the Electrodeposited Bi-Modified Si Surfaces The morphology and elemental composition of the electrodeposited Bi-based catalyst on the Si surface were probed by a combination of analytical techniques, such as scanning electron microscopy (SEM), energy-dispersive X-ray spectroscopy (EDS) and X-ray photoelectron spectroscopy (XPS), in order to provide a deeper understanding of our photoelectrochemical system.
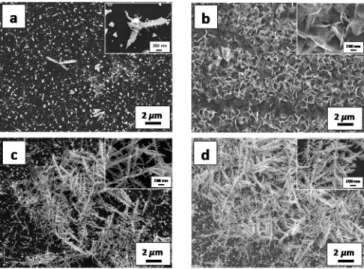
The SEM images of different modified surfaces prepared by Bi electrodeposition for 5 s, 30 s and 60 s (abbreviated as Si/Bi5, Si/Bi30 and Si/Bi60, respectively) are shown in Figure 1. For Si/Bi60, dense dendrite-like electrodeposits were observed on the
Si surface. A less compact dendritic structure was noticed for Si/Bi30 wherein dendrites coexist with smaller particles that are in close contact with Si. When the electrodeposition time was decreased to 5 s, only a few dendrites were visible on the surface with numerous small particles whose size was comparable to that of particles observed for longer electrodeposition times. This indicates that the nucleation occurred within the first 5 s, and suggests that the growth of dendrites initiated at these nuclei. Such observations are fully consistent with those reported by Ding
et al. in the frame of their study of Bi3+-assisted chemical etching of planar Si.[35]
The presence of Bi on Si was confirmed by EDS (Figures S3-S5). Bi and Si were identified as the principal elemental components for all the freshly Bi-modified surfaces with a smaller Bi content for Si/Bi5, well in line with the SEM and optical observations. The Bi content increased from 2.5 ± 0.1 wt % for Si/Bi5 to 27 ± 5 wt % for Si/Bi30 and 18 ± 2 wt % for Si/Bi60. For Si/Bi30 and Si/Bi60, a small amount of F was also detected (< 0.7 wt %). Such an element was thought to originate from fluoride species present either in HF used for Si hydrogenation or as trace contaminants in the bismuth salt used for electrodeposition.
Further analysis by XPS performed on the modified surface showing the best catalytic activity for CDRR (namely, Si/Bi5, vide
infra) has allowed to gain insights about the chemical composition
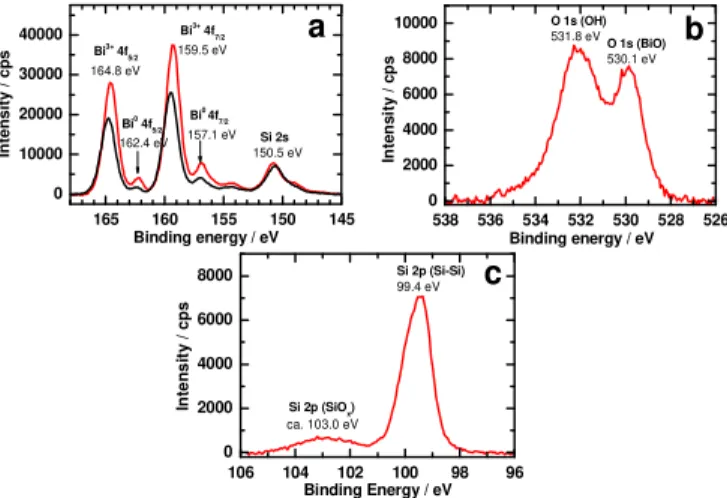
of the Bi deposit and its oxidation state as well. The Bi 4f spectrum shows two distinct doublets attributed to the Bi 4f7/2 peaks. The first component at 157.1 eV is assigned to Bi0, whereas the significantly more intense contribution at higher binding energy, i.e. 159.5 eV, corresponds to Bi3+ species (Figure 2).[29] We note that both Bi0 and Bi3+ ions have previously been detected for Bi material electrodeposited from a concentrated acidic solution.[26] The Bi 4f7/2 and Bi 4f5/2 signals ascribed to Bi3+ at 159.5 eV and 164.8 eV, respectively, are fully consistent with bismuth oxide (Bi2O3). Furthermore, the component separation of Bi (4f7/2 - 4f5/2) = 5.30 eV and the intensity ratio of Bi3+ 4f
7/2 to Bi3+ 4f5/2 (~1.3) are both in good agreement with the theoretical ratio of 1.33 for Bi2O3.[41]
Figure 1. SEM images of Si/Bi5 (a), Si/Bi30 (c) and Si/Bi60 (d) photocathodes electrodeposited from 1 M HNO3 solution containing 20 mmol L-1 Bi(NO3)3•5H2O. (b) corresponds to the SEM image of Si/Bi5 photocathode after 30 min electrolysis at -0.9 V vs. SCE in CO2-saturated 0.5 M KHCO3.
Accepted
3
The O 1s region shows two peaks at 530.1 and 531.8 eV which can be ascribed to metal oxide oxygen and hydroxyl groups, respectively.[41] Globally, all these XPS results demonstrate that the surface Bi atoms are mainly in the form of Bi2O3, which is likely to generate spontaneously after exposure of electrodeposited Bi0 to air. Moreover, both exposure of the modified photocathodes to air and the used electrodeposition conditions (aqueous medium under ambient conditions) were thought to be responsible for the oxidation of underlying silicon surface as evidenced by the presence of a shoulder at ca. 103 eV on the Si 2p spectrum attributed to silicon oxides.
Figure 2. High-resolution XPS spectra of Bi 4f (a), O 1s (b) and Si 2p (c) for the freshly prepared Si/Bi5 surface. The black trace in (a) corresponds to the spectrum of Si/Bi5 after 30 min electrolysis at -0.9 V vs. SCE in CO2-saturated 0.5 M KHCO3.
Complementary X-ray diffraction (XRD) measurements of the different modified surfaces revealed diffraction peaks which could be attributed to the rhombohedral Bi phase (Figure S6). Additionally, the effects of the Bi decoration on the optical properties of the substrate in the visible range were also investigated by total reflectance measurements (Figure S7). Flat hydrogenated Si showed a high reflectance in the visible region, between 70 and 40%. In contrast, the Bi-modified surfaces showed an enhanced light absorption with a reflectance in the range 40 to 30%, irrespective of the Bi coverage. These results demonstrate that the light trapping properties of the surfaces were not really affected by the amount of electrodeposited Bi on Si. Photoelectrochemistry of Bi-modified Photocathodes. Before investigating in details the photoelectrocatalytic properties of the best Bi-modified photocathode for CDRR, a preliminary electrochemical study has been carried out to determine the optimal Bi coverage leading to maximum catalytic activity. The photoelectrochemical response of different freshly prepared Bi-modified surfaces was thus examined in aqueous 0.5 M KHCO3 medium under argon and CO2, both in the dark and under simulated sunlight (AM 1.5G, 100 mW cm-2). Figure 3 shows the cathodic polarization curves obtained for Si/Bi5, Si/Bi30 and Si/Bi60 in Ar-saturated 0.5 M KHCO3 (pH = 8.3). As expected for charge depleted silicon, negligible cathodic current densities were measured in the dark for all electrodes. By contrast, much higher current densities were observed under illumination.
Figure 3 Linear sweep voltammogram (LSV) curves of Si/Bi5 (red), Si/Bi30 (blue) and Si/Bi60 (dark yellow) in Ar- (a) or CO2- (b) saturated 0.5 M KHCO3 solution in dark (dotted traces) and under illumination (solid traces). Scan rate: 20 mV s-1.
Subtle differences can be noticed among these modified electrodes, in particular, Si/Bi5 exhibited a less negative onset potential of -0.14 V vs RHE (set arbitrarily at 0.5 mA cm-2) combined with a higher photocurrent density of 9.0 mA cm-2 (at -0.75 V vs RHE) compared to Si/Bi30 (-0.21 V and 6.3 mA cm-2) and Si/Bi60 (-0.20 V and 7.2 mA cm-2). The latter two photocathodes yielded lower photocurrent densities which could be ascribed to higher coverages of the deposited Bi-based catalyst, thus limiting the light absorption by silicon. Such a trend was also visible under CO2 atmosphere. Indeed, an onset potential of +0.10 V was measured for Si/Bi5, against +0.08 V and +0.05 V for Si/Bi30 and Si/Bi60, respectively. Additionally, Si/Bi5 showed the highest photocurrent densities with light-limited plateau current densities 4 and 3 times higher than those measured for Si/Bi30 and Si/Bi60, respectively (Fig. 3b). Moreover, from the difference between the onset potentials measured for illuminated Bi-modified p-type Si and the dark nonphotoactive n+-type Si electrodes both under Ar and CO
2 (Figure S8), it can be deduced that the p-type semiconductor shifts the reduction wave towards much less negative potentials, which is perfectly consistent with the activation of the electrocatalytic process by the photogenerated electrons. It is noticeworthy that the same conclusion can be drawn if comparison was made wih the electrochemical response of a Bi foil (Figure S9).
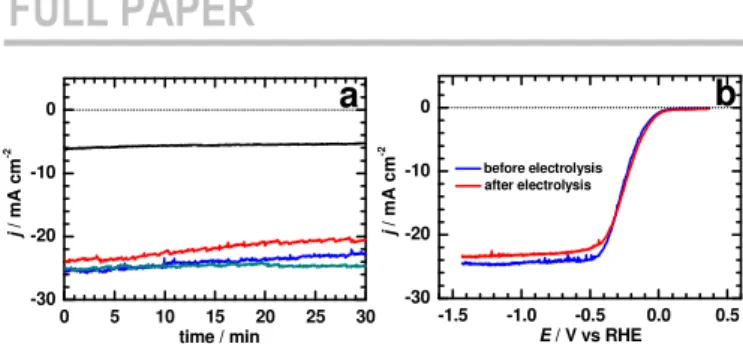
From the aforementioned electrochemical data, it can be concluded that Si/Bi5 was the most catalytically active photocathode for CDRR. To evaluate both the catalytic activity and the robustness of this system towards CDRR, electrolysis tests under continuous illumination were carried out at different applied potentials. For applied potentials of -0.23 V and -0.63 V vs RHE, a ca. 10% decrease in the cathodic photocurrent density was measured after 30 min electrolysis in CO2-saturated electrolyte (Figure 4a). Conversely, at more negative potentials (-1.03 V and -1.43 V), the photocurrent response was found to be more stable and the Si/Bi5 photocathode yielded appreciable cathodic photocurrent (~24 mA cm-2). It is worth noting that such values are higher than those measured for other Bi-modified Si photocathodes.[22,35] Moreover, the similarity between the LSV curves before and after electrolysis supports the good stability of the modified photocathode (Fig. 4b). Such an electrochemical stability was not affected by post-electrolysis morphological changes of the initial structure to a dense array of Bi microsheets (Fig. 1b) and the loss of a certain amount of the electrodeposited material (around 30%), as supported by the decrease in the intensity of the Bi 4f XPS signals (Fig. 2a).
538 536 534 532 530 528 526 0 2000 4000 6000 8000 10000 O 1s (BiO) 530.1 eV In te n s it y / c p s Binding energy / eV O 1s (OH) 531.8 eV
b
106 104 102 100 98 96 0 2000 4000 6000 8000 Si 2p (SiOx) In te n s it y / c p s Binding Energy / eV Si 2p (Si-Si) 99.4 eV ca. 103.0 eVc
-1.5 -1.0 -0.5 0.0 0.5 -30 -20 -10 0 j / m A c m -2 E / V vs RHE Si/Bi5 Si/Bi30 Si/Bi60b
-0.8 -0.6 -0.4 -0.2 0.0 0.2 0.4 -10 -8 -6 -4 -2 0 j / m A c m -2 E / V vs RHEa
165 160 155 150 145 0 10000 20000 30000 40000 Bi0 4f 7/2 157.1 eV Bi3+ 4f7/2 159.5 eV Bi0 4f 5/2 162.4 eV In te n s it y / c p s Binding energy / eV Bi3+ 4f 5/2 164.8 eV Si 2s 150.5 eVa
Accepted
Manuscript
Figure 4. a) Chronoamperometry curves obtained by controlled-potential electrolysis at -0.23 V (black), -0.63 V (red), -1.03 V (blue) and -1.43 V vs RHE (dark green) for Si/Bi5 in CO2-saturated 0.5 M KHCO3 solution under simulated sunlight. b) LSV curves at 20 mV s-1 of Si/Bi5 before and after 30 min electrolysis at -1.03 V vs RHE.
Detection of the CDRR Products Generated on Si/Bi5 and Faradaic Efficiencies. To further investigate the CDRR products generated on the Si/Bi5 photocathode, the gas and liquid phases were analyzed after 30 min electrolysis at different applied potentials under Ar or CO2 atmosphere. Resulting gaseous products (CO or H2) were detected by gas chromatography (GC) and the dissolved product (formate) was measured by ion chromatography (IC) with an aliquot of the electrolyte collected at the end of the electrolysis. For potentials of -1.03 V and -1.43 V, formate (HCOO-) was found to be the predominant product from CDRR under our conditions. The Faradaic efficiency (FE) for that reaction reached 72.1% at -1.03 V with an average partial photocurrent density for formate, i.e. jformate = -17.4 mA cm-2 (Figure 5). This formate selectivity was maintained at -1.43 V with FEformate = 73.0% and jformate = -18.0 mA cm-2. It is actually very interesting to note that these two parameters are statistically identical, which is probably caused by the mass transport limitation of CO2, in agreement with previous reports.[20, 42 ] Moreover, the jformate values determined at -1.03 V correspond to an average sustained activity for formate production of 14.9 mg h-1 cm-2, which is almost the same as that calculated for an applied potential of -1.43 V (15.5 mg h-1 cm-2). By contrast, at less negative applied potentials, FE for formate was drastically decreased to 20.0% at -0.23 V and 12.1% at -0.63 V, with jformate values decreased by a factor of about 16 and 6, respectively.
Figure 5. Electrolysis potential-dependent Faradaic efficiency for formate at illuminated Si/Bi5 photocathode after 30 min electrolysis in Ar- or CO2-saturated KHCO3 solution and corresponding cathodic photocurrent densities for formate.
Besides formate, two gas phase components, namely H2 and CO, were detected as side-products during CDRR. FE for H2 decreased from 23.3% to 9.2% with electrolysis potential decreasing from -0.23 to -1.43 V, whereas negligible CO amount between 0.9% and 2.2% was detected. In order to demonstrate that formate originates from the reduction of CO2, control
experiments have been additionally carried out in Ar-saturated electrolyte. Under such conditions, a negligible amount of formate was detected (FE < 1.8%) and CO was not produced (Fig. 5). Interestingly, a constant H2 FE around 23% was found at all applied potentials in the absence of any CO2 feedgas, suggesting that HER is a potential-independent process for the Si/Bi5 photocathode under our experimental conditions.
Conclusion
In this work, p-type Si photocathodes functionalized with Bi catalyst were easily fabricated without an additive polymer layer using a one-step and fast electrodeposition method. We have demonstrated that such photocathodes promoted the photoelectrocatalytic reduction of CO2 to formate in aqueous electrolytic medium. Both composition and morphology of the deposited Bi cocatalyst could be tuned by controlling the electrodeposition time. The optimal Si/Bi5 photocathode exhibited the highest photocurrent density (-24.1 mA cm-2) with partial formate photocurrent density jformate = -17.4 mA cm-2 at -1.03 V vs RHE (corresponding to a 0.84 V overpotential for CO2 to formate conversion). Such values highlight the excellent catalytic activity for CDRR of our photocathodes, outperforming that of recently reported Bi-based catalysts deposited on Si.[22,35] Moreover, under our conditions, the formate production rate reached 14.9 mg h-1 cm-2 with a Faradaic efficiency of 72%. We anticipate that the conversion efficiency of CO2 could be further improved by using structured silicon surfaces,[43,44] and/or Bi nanostructures,[19,45,46] or by modulating the illumination power of Si, as recently demonstrated by Ding et al.[35]
Experimental Section
Reagents. Bismuth nitrate pentahydrate (Bi(NO3)3•5H2O, 98%, from Acros
Organics), nitric acid (HNO3, 65%, from Sigma-Aldrich) and potassium
bicarbonate (KHCO3, 99.7~100.5%, from Alfa Aesar) were used without
further purification. Ar (99.999%, Alphagaz 1, Air Liquide) and CO2
(>99.9%, Alphagaz, Air Liquid) were used as supplied. The chemicals used for the cleaning and etching of silicon wafer pieces (30% 96~97% concentrated and 50% HF solutions) were of VLSI (H2O2, from
Sigma-Aldrich) and MOS (H2SO4 from O-BASF and HF from Sigma-Aldrich)
semiconductor grade. Acetone (MOS electronic grade, Erbatron from Carlo Erba) and anhydrous ethanol (96%, RSE electronic grade, Erbatron from Carlo Erba) were used without further purification. Ultrapure water from a Purelab Classic UV purification system from Veolia Water STI (18.2 MΩ cm-1 resistivity) was used to prepare all aqueous solutions.
Preparation of Electrodeposited Bi-modified Si photocathodes.
Hydrogen-terminated Si photocathodes. All Teflon vials and tweezers used for cleaning of silicon were previously decontaminated with piranha solution (3:1 v/v concentrated H2SO4/30% H2O2) at 100°C for 30min,
followed by copious rising with ultrapure water.
Caution: the concentrated aqueous H2SO4/H2O2 (piranha) solution is very
dangerous, particularly in contact with organic materials, and should be handled extremely carefully.
The p-type (1-5 Ω cm resistivity, boron-doped, double side polished, 250 µm thickness) Si (100) wafer was purchased from Siltronix. The wafer was cut in ca. 1 cm × 1 cm pieces and degreased by sonication for 10 min successively in acetone, ethanol, and ultrapure 18.2 MΩ cm water. They were then cleaned with piranha solution at 100 °C for 30 min followed by
0 5 10 15 20 25 30 -30 -20 -10 0 j / m A c m -2 time / min
a
-1.5 -1.0 -0.5 0.0 0.5 -30 -20 -10 0 j / mA c m -2 E / V vs RHE before electrolysis after electrolysisb
Accepted
Manuscript
5
copious rising with ultrapure water to eliminate heavy metals and organic residues.
For electrochemical experiments, the decontaminated surface was further processed to fabricate the photocathode. An Ohmic contact was established on the backside Si surface with a metal wire by first scrubbing the surface with sand paper and a diamond glass cutter and applying a droplet of InGa eutectic (99.99%, Alfa Aesar). A layer of silver paste (Electron Microscopy Sciences) was then deposited on the contact. After drying of the silver paste, the metal wire was inserted in a glass capillary,
and the electrode area (0.16-0.45 cm2) was defined with an epoxy-based
resin (Loctite 9460, Henkel) that covered all the backside of the Si surface as well as the silver paste. The assembled electrode was then placed into an oven at 90°C overnight to cure the resin.
After preparation, the silicon surface sealed in epoxy was freshly hydrogenated by immersing the electrode into HF 10% (~ 5.7 M) for 2 min. The surface was then copiously rinsed with ultrapure water and quickly dried under an argon stream.
Caution: Proper precautions must be performed when handling hydrogen
fluoride. Hydrogen fluoride is extremely corrosive for human tissue, contact resulting in painful, slow-healing burns and even death. Before being trained to use HF, the operator must complete HF awareness training. Laboratory work with HF should be conducted only in an efficient hood, with the operator wearing a full-face shield and protective clothing. Bi Electrodeposition. The electrodeposition of Bi on the freshly hydrogenated p-type silicon (Si-H) photocathode was carried out in an aqueous 1 M HNO3 solution (40 mL) containing 20 mBi(NO3)3•5H2O by
electroreduction of Bi3+ to Bi0. Prior to electrodeposition, the sonicated
Bi(NO3)3•5H2O solution was purged with argon for at least 15 min and then
sealed properly. For electrodeposition, a three-electrode electrochemical cell containing a Si-H working electrode, a Pt wire counter electrode and a KCl-saturated calomel electrode (SCE) as reference electrode, was used. The silicon electrode was immersed into the deposition solution and illuminated with a halogen optical fiber (Fiber-Lite DC-950 illuminator). Bi was deposited at -0.3 V vs SCE for different times. After electrodeposition,
the Bi-modified photocathodes (Si/Bix with x denoting the
electrodeposition time in seconds) were immediately rinsed thoroughly with ultrapure water and dried under an argon stream.
Electrochemical Measurements. All electrochemical experiments were carried out using an Auto-Lab PGSTAT 302N electrochemical workstation equipped with the GPES and FRA softwares. LSV curves were recorded at 20 mV s-1 and intentionally not corrected by the Ohmic drop of the cell.
The cell resistance was determined before each experiment by measuring the impedance of the system at 100 kHz, and it was usually found to be between 15 and 30 Ω. The geometrical area of the photocathodes
(between 0.16 and 0.45 cm2) was measured using the ImageJ software.
For the photoelectrochemical reduction of CO2, the electrolytic solution
(aqueous 0.5 M KHCO3) was purged with argon or carbon dioxide for at
least 20 min prior to measurements. The measurements were performed in a glass cell (Figure S10) comprising a quartz window in which were inserted a KCl-saturated calomel reference electrode (SCE) and a graphite rod counter electrode (the counter electrode was separated from the rest by a glass frit). The Si/Bix photocathode was disposed in front of the quartz window and used as the working electrode. The light source was provided
by a solar simulator with a fluence of 100 mW cm-2 (LS0106, LOT Quantum
Design) equipped with an air mass (AM) 1.5G filter. Potentials vs SCE were converted into potential vs reversible hydrogen electrode (RHE) using the equation: ERHE = ESCE + 0.24 + 0.059*pH (with pH = 7.2 for the
CO2-saturated 0.5 M KHCO3 electrolyte).
Gas Chromatography. Gas chromatography (GC) measurements for the detection and quantification of the gas produced from electrolysis (e.g. CO
and H2) were performed with a PerkinElmer® Clarus® 580 gas
chromatograph equipped with two detectors: a Thermal Conductivity Detector (TCD) and a Flame Ionization Detector (FID), and two columns: a Restek® Haysep Q (1 mm × 2 m) micropacked column and a Restek® ShinCarbon ST (1 mm × 2 m) micropacked column. The detection of gaseous products was carried out at TCD temperature of 50 °C and FID
temperature of 380 °C. For the determination of the Faradaic efficiency, at first, different volumes (namely, 5, 10, 15 and 20 µL) of mixed calibrated gases containing H2 (10%, v/v), CO (10%, v/v), CH4 (5%, v/v), CO2 (20%,
v/v), and He (55%, v/v) (from Air Products) were analyzed by experimental GC system in order to plot a relationship between the molar amount of related gas and the corresponding chromatogram peak area (Figure S11). Then, Faradaic efficiency for each detected gas during the electrolysis was calculated by using the following equation:
%
where α is the number of electrons transferred (α = 2 for CO and H2), n is
the number of mole of the target product, F is the Faraday constant and Q is the consumed electrical charge. For CO and H2 detection, according to
the calibrated curves in Figure S11,
2.94 10
2.56 10
where A is the chromatogram peak area of target product CO or H2,
VHeadspace is the volume of space above the electrolyte in the
electrochemical cell, which was measured after each electrolysis reaction, and VSample is the sample injection volume.
Additional Instrumentation. For the ionic chromatography (IC) analysis, the concentration of formate ions (diluted four times) before and after electrolysis was determined using Dionex DX120 IC equipped with a conductivity detector and a Dionex AS19 (4 mm × 250 mm) ion-exclusion column, using the calibration curve shown in Figure S12. The sample was eluted with potassium hydroxide at a flow rate of 1 mL min-1. The detection
was carried out by conductivity with a self-regenerating suppressor (SRS). The surface morphology of electrode materials was analyzed by scanning electronic microscopy (SEM), using a Jeol JSM 7100F (10 kV) instrument, equipped with a field emission gun, operating in high vacuum conditions, at an accelerating voltage variable from 2 to 20 keV, depending on the observation needs.
Energy-dispersive X-ray spectroscopy (EDX) was performed using a Silicon Drift Detector (SDD) - X-Max (Oxford Instruments) and the AZtecEnergy software.
XPS measurements were performed with an Mg Kalpha (hν) 1254 eV X-ray source, using a VSW HA100 photoelectron spectrometer with a hemispherical photoelectron analyzer, working at an energy pass of 20 eV for survey and resolved spectra. The experimental resolution was 1.0 eV.
Acknowledgements
The authors gratefully acknowledge ANR (Agence Nationale de la Recherche) for financial support of the CHALCO-CAT program (CHALCO-CAT ANR-15-CE06-0002-01). This work was also supported by University of Rennes 1 and CNRS. Francis Gouttefangeas and Loïc Joanny from ScanMAT/CMEBA are fully thanked for SEM and EDX measurements. Stéphanie Fryars and Antoine Vacher from Institut des Sciences Chimiques de Rennes are also fully thanked for X-ray diffraction and total reflectance spectroscopy measurements, respectively.
Keywords: CO2 electrocatalytic reduction • formate • bismuth catalysts • silicon • photocathodes
Accepted
[1] J. Qiao, Y. Liu, F. Hong, J. A. Zhang, J. Chem. Soc. Rev. 2014, 43, 631-675.
[2] C. Costentin, M. Robert, J. M. Saveant, Chem. Soc. Rev. 2013, 42, 2423−2436.
[3] D. D. Zhu, J. L. Liu, S. Z. Qiao, Adv. Mater. 2016, 28, 3423-3452. [4] A. J. Bard, R. Parsons, J. Jordan, in Standard Potentials in Aqueous
Solution, CRC Press, 1985.
[5] M. Jouny, W. Luc, F. Jiao, Ind. Eng. Chem. Res. 2018, 57, 2165-2177. [6] P. Sponholz, D. Mellmann, H. Junge, M. Beller, ChemSusChem. 2013,
6, 1172-1176.
[7] A. S. Agarwal, Y. Zhai, D. Hill, N. Sridhar, N. ChemSusChem. 2011, 4, 1301-1310.
[8] Y. Hori, in Electrochemical CO2 Reduction on Metal Electrodes, Modern Aspects of Electrochemistry (Eds.: C. G. Vayenas, R. E. White, M. E. Gamboa-Aldeco), Springer New York, New York, NY, 2008, pp. 89-189. [9] Y. Hori, H. Wakebe, T. Tsukamoto, O. Koga, Electrochim. Acta 1994, 39,
1833-1839.
[10] B. Khezri, A. C. Fisher, M. Pumera, J. Mater. Chem. A 2017, 5, 8230-8246.
[11] T. E. Teeter, P. V. Rysselbergh, J. Chem. Phys. 1954, 22, 759-760. [12] S. Zhang, P. Kang, T. J. Meyer, J. Am. Chem. Soc. 2014, 136,
1734-1737.
[13] S. Komatsu, T. Yanagihara, Y. Hiraga, M. Tanaka, A. Kunugi, Denki
Kagaku 1995, 63, 217-217.
[14] S. Kim, W. J. Dong, S. Gim, W. Sohn, J. Y. Park, C. J. Yoo, H. W. Jang, J. L. Lee, Nano Energy 2017, 39, 44-52.
[15] J. H. Koh, D. H. Won, T. Eom, N. K. Kim, K. D. Jung, H. Kim, Y. J. Hwang, B. K. Min, ACS Cat. 2017, 7, 5071-5077.
[16] N. Han, Y. Wang, H. Yang, J. Deng, J. Wu, Y. Li, Y. Li, Nat. Commun.
2018, 9, 1320.
[17] S. He, F. Ni, Y. Ji, L. Wang, Y. Wen, H. Bai, G. Liu, Y. Zhang, Y. Li, B. Zhang, H. Peng, Angew. Chem. Int. Ed. 2018, 57, 16114-16119. [18] C.-C. Miao, G.-Q. Yuan, ChemElectroChem 2018, 5, 3741-3747. [19] H. Yang, N. Han, J. Deng, J. Wu, Y. Wang, Y. Hu, P. Ding, Y. Li, J. Lu,
Adv. Energy Mater. 2018, 8, 1801536.
[20] S. X Guo, Y. Zhang, X. Zhang, C. D. Easton, D. R. MacFarlane, J. Zhang,
ChemSusChem. 2019, 12, 1091-1100.
[21] P. Lu, D. Gao, H. He, Q. Wang, Z. Liu, S. Dipazir, M. Yuan, W. Zu, G. Zhang, G. Nanoscale 2019, 11, 7805-7812.
[22] Q. Gong, P. Ding, M. Xu, X. Zhu, M. Wang, J. Deng, Q. Ma, N. Han, Y. Zhu, J. Lu, Z. Feng, Y. Li, W. Zhou, Y. Li, Nat. Commun. 2019, 10:2807. [23] S. Liu, X. F. Lu, J. Xiao, X. Wang, X. W. Lou, Angew. Chem. Int. Ed.
2019, 58, 13828-13833.
[24] Y. Zhang, X. Zhang, Y. Ling, F. Li, Angew. Chem. Int. Ed. 2018, 57, 13283-13287.
[25] D. Wu, X. Shen, J. Liu, C. Wang, Y. Liang, X.-Z. Fu, J.-L. Luo, Nanoscale
2019, 11, 22125-22133.
[26] J. L. DiMeglio, J. Rosenthal, J. Am. Chem. Soc. 2013, 135, 8798-8801. [27] J. Medina-Ramos, R. C. Pupillo, T. P. Keane, J. L. DiMeglio, J. Rosenthal,
J. Am. Chem. Soc. 2015, 137, 5021-5027.
[28] Z. Zhang, M. Chi, G. M. Veith, P. Zhang, D. A. Lutterman, J. Rosenthal, S. H. Overbury, S. Dai, H. Zhu, ACS Cat. 2016, 6, 6255-6264. [29] J. Medina-Ramos, J. L. DiMeglio, J. Rosenthal, J. Am. Chem. Soc. 2014,
136, 8361-8367.
[30] A. Atifi, T. P. Keane, J. L. DiMeglio, R. C. Pupillo, D. R. Mullins, D. A. Lutterman, J. Rosenthal, J. Phys. Chem. C 2019, 123, 9087-9095. [31] J. L. White, M. F. Baruch, J. E. Pander III, Y. Hu, I. C. Fortmeyer, J. E.
Park, T. Zhang, K. Liao, J. Gu, Y. Yan, T. W. Shaw, E. Abelev, A. B. Bocarsly, Chem. Rev. 2015, 115, 12888–12935.
[32] K. Maeda, Adv. Mater. 2019, 31, 1808205.
[33] B. Kumar, M. Llorente, J. Froehlich, T. Dang, A. Sathrum, C. P. Kubiak,
Annu. Rev. Phys. Chem. 2012, 63, 541−569.
[34] K. Sun, S. Shen, Y. Liang, P. E. Burrows, S. S. Mao, D. Wang, Chem.
Rev. 2014, 114, 8662−8719.
[35] P. Ding, Y. Hu, J. Deng, J. Chen, C. Zha, H. Yang, N. Han, Q. Gong, L. Li, T. Wang, X. Zhao, Y. Li, Mater. Today Chem. 2019, 11, 80-85. [36] K. A. Mauritz, R. B. Moore, Chem. Rev. 2004, 104, 4535-4586. [37] M. Mukaddam, E. Litwiller, I. Pinnau, Macromolecules 2016, 49, 280-286. [38] H. Zhong, Y. Qiu, T. Zhang, X. Li, H. Zhang, X. Chen, J. Mater. Chem. A
2016, 4, 13746-13753.
[39] A. Ananthi, S. S. Kumar, K. L. Phani, Electrochim. Acta 2015, 151, 584-590.
[40] X. Zhang, T. Lei, Y. Liu, J. Qiao, Appl. Cat. B: Environ. 2017, 218, 46-50. [41] V. S. Dharmadhikari, S. R. Sainkar, S. Badrinarayan, A. Goswami, J.
Electron Spectrosc. 1982, 25, 181-189.
[42] F. Li, L. Chen, G. P. Knowles, D. R. MacFarlane, J. Zhang, Angew. Chem.
Int. Ed. 2017, 56, 505-509.
[43] J. W. Beeman, J. Bullock, H. Wang, J. Eichhorn, C. Towle, A. Javey, F. M. Toma, N. Mathews, J. W. Ager, Energy Environ. Sci. 2019, 12, 1068-1077.
[44] E. Torralba-Penalver, Y. Luo, J.-D. Compain, S. Chardon-Noblat, B. Fabre, ACS Catal. 2015, 5, 6138-6147.
[45] H. Zhang, Y. Ma, F. Quan, J. Huang, F. Jia, L. Zhang, Electrochem.
Commun. 2014, 46, 63-66.
[46] T. Tran-Phu, R. Daiyan, Z. Fusco, Z. Ma, R. Amal, A. Tricoli, Adv. Funct.
Mater. 2020, 30, 1906478.
Accepted
FULL PAPER
7
Entry for the Table of Contents
P-type Si photocathodes functionalized with Bi catalyst were easily fabricated using a one-step and fast electrodeposition method. A few seconds electrodeposition was sufficient for producing Bi-decorated photocathodes showing the best electrocatalytic performance for the CO2-to-formate reduction characterized by a light-limited photocurrent plateau of ~24 mA cm-2 and a high Faradaic efficiency of >72% for formate at ca. -1.0 V vs RHE.