A Comparative Study: The Dynamic Behavior of Tall Buildings with
Diagrid and Hexagrid Structural Systems Subjected to Seismic Loads
by Xianghui Chen B.S. Structural Engineering University of California San Diego, 2017
SUBMITTED TO THE DEPARTMENT OF CIVIL AND ENVIRONMENTAL ENGINEERING FULFILLMENT OF THE REQUIREMENTS FOR THE DEGREE OF
IN PARTIAL
MASTER OF ENGINEERING IN CIVIL AND ENVIRONMENTAL ENGINEERING AT THE
MASSACHUSETTS INSTITUTE OF TECHNOLOGY JUNE 2018
02018 Massachusetts Institute of Technology. All rights reserved. The author hereby grants to MIT permission to reproduce
and to distribute publicly paper and electronic copies of this thesis document in whole or in part
in any medium now known or hereafter created.
Signature of Author: Certified by: Accepted by: I MASSACHUSTS INSTITUTE OF TECHNOLOGY
JUL 26 2018
LIBRARIES
Signature redacted
Department of Civil and Environmental EngineeringMay 11, 2018
Signature redacted
Gordana Helning Lecturer of Civil and Environmental Engineering Thesis Supervisor
Signature redacted
/'V
Jesse Kroll Professor of Civil and Environmental Engineering Chair, Graduate Program Committee
A Comparative Study: The Dynamic Behavior of Tall Buildings with Diagrid
and Hexagrid Structural Systems Subjected to Seismic Loads
by Xianghui Chen
Submitted to the Department of Civil and Environmental Engineering on May 11, 2018 in Partial Fulfillment of the
Requirements for the Degree of Master of Engineering in Civil and Environmental Engineering
ABSTRACT
Most advancements in achieving new structural heights for tall buildings are not possible without the innovation in structural systems. One type of tubular shell structural system, diagrids, like the one used in Hearst Tower, have gained much popularity in high-rise constructions over the past decade due to its high efficiency by resolving both gravity and lateral loads with the same elements. A new iteration of such tubular shell system named hexagrid was examined in this paper. The aim of the study is to evaluate the dynamic response and behavior of such systems when they are subjected to seismic loads, and to compare their efficiency to the better understood diagrid system. Three 60-story and three 36-60-story models using diagrid and hexagrid exoskeleton systems designed to control the governing wind drift requirements were constructed in commercial software ETABS. For each height, one benchmark diagrid structure and two hexagrid structures using horizontal and vertical configurations were modeled. ASCE 7-10 Code based linear dynamic Modal Response Spectrum Analyses and modal analyses were then carried out for two locations, San Francisco and San Diego, to study the seismic performance based on the dynamic response and modal properties. The results from hexagrid architype models were compared against those of benchmark diagrid models to study the difference in dynamic behavior and relative efficiency. The analysis results showed similar mode shapes across different systems, which was attributed to the similar geometry and load-resisting mechanism of tubular shell structures. However, neither of the hexagrid configurations are as stiff as the diagrid system, resulting in larger seismic-induced lateral displacements and acceleration. An efficiency analysis shows, from the perspective of structural weight, that neither one of the two hexagrid configurations are as efficient as diagrids in controlling lateral drifts, but vertical hexagrids are comparable to diagrids in controlling lateral acceleration. It was also concluded that the studied vertical hexagrid configuration is stiffer and more efficient than the studied horizontal hexagrid configuration. The results of the study could be used by design professionals, architects and structural engineers alike, to make a more informed decision in system selection.
Thesis Supervisor: Gordana Herning
Acknowledgements
First, I would like to thank my parents and family for their unconditional love and support-emotionally and financially-that they have given me all these years. I would have not been who I am and gotten where I am today without their help and guidance.
I would like to express my deepest gratitude and appreciation to my advisor, Gordana Herning, for her tremendous help and advice in writing this thesis from start to finish. Special thank-you to Professor Oral Buyukozturk, and his PhD candidates Murat Uzun and James Long for their help in guiding me to research and finalize this topic.
I would also like to thank my girlfriend Yichen for all her love and accompany, as well as all my dear friends anywhere in the world for their continuous support, especially my old friends Biao, Yang, and Max for the fun conversations and online accompany to help me destress and get me through tough times.
Last but not least, I want to say thank-you to the entire class of 2018 Master of Engineering classmates. It is an honor to have worked with you and I wish you all the best in your future endeavors.
This thesis would not have been possible without all the amazing people I am fortunate to have around me. Thank you to you all!
Table of Contents
List of Figures ... 8
List of Tables...10
1. Introduction...11
2. An Overview of the Structural System s for Tall Buildings ... 14
2.1 Diagrids ... 16
2.2 Hexagrids ... 17
3. Critical Literature Review: Seismic Performance and Optimization of Diagrid and Hexagid Structural System s ... 20
3.1 Optim al Diagonal Angles and Patterns ... 20
3.1.1 Diagrid Structural System ... 20
3.1.2 Hexagrid Structural System ... 24
3.3 Seism ic Perform ance & Design Factors ... 26
4. M odel definition ... 29
4.1 Overall Geom etry ... 29
4.2 M aterial ... 33
4.3 Selected Diagrid Structural System ... 34
4.4 Hexagrid Structural System ... 35
4.4.1 Horizontal Hexagrid ... 35
4.4.2 Vertical Hexagrid ... 35
4.5 Typical M em ber Sizes ... 36
5. Analysis and Design M ethodology ... 37
5.1 Code-Based Structural Analysis and Design ... 37
5.2 Seism ic Analysis Procedure ... 37
5.2.2 Overview of Modal Response Spectrum Analysis and Special Requirements Based on
ASCE 7-10 12.9 ... 38
5.2.3 M odal and Directional Com bination ... 39
5.3 Site Location and Param eters ... 39
6. Results and Analysis... 43
6.1 Com parative Study 1 - 60 Story... 43
6.1.1 M odal Properties ... 44
6.1.2 Drift and Acceleration ... 46
6.1.3 Structural W eight, Em bodied Carbon and Efficiency ... 51
6.2. Com parative Study 2 - 36 Story ... 53
6.2.1 M o dal Properties ... 54
6.2.2 Drift and Acceleration ... 55
6.2.3 Structural W eight, Em bodied Carbon and Efficiency ... 59
7. Conclusion...62
8. Future Potential Research Areas...65
Bibliography ... 66
List of Figures
Figure 1: Diagrid (left) and Vertical Hexagrid (right) Structural System (Moon et al. 2007;
Mashhadiali and Keyroddin, 2012a)... 11 Figure 2: Poly International Plaza, SO M ... 12 Figure 3: Acceleration Zoning Map of China (Gao, 2003) ... 12 Figure 4: Timeline of World's Tallest Buildings and Increase in Height from Previous Record
(K ay n i, 2 0 1 8 ) ...2va 14
Figure 5: Structural System for Different Height by F.R. Khan (Gu, 2015)... 15 Figure 6: Elevation View of Traditional Braced Tube and Diagrid (Moon et al., 2007)...15 Figure 7: Upper Row from Left to Right: IBM Building (Boake, 2013), Swiss Re Tower, Heast Tower;
Lower Row from Left to Right: Lotte Super Tower, Guangzhou West Tower (Sun, 2015).16 Figure 8: Pushover Curves of Diagrid Structures with Different Diagonal Angles (Kim and Lee,
2 0 1 2 ) ... 1 7
Figure 9: Hexagon Shape in Natural Structure: Balsa and Cork Structural Patterns (Montuori et al., 2 0 1 5 ) ... 1 7 Figure 10: Pushover Curve of Hexagrid Structural System (Mashhadiali and Keyroddin, 2012) ... 18 Figure 11: Sinosteel Building and Nanotower Conceptual Rendering (Montuori et al., 2015) ... 19 Figure 12: Al Bahar Tower Hexagonal Frame (Arup, 2013)... 19 Figu re 13 : M od u le D efin ition ... 2 0 Figure 14: Angle between the Diagonal Members and the Horizontal Plane ... 20 Figure 15: Top Story Displacement vs. Diagonal Angle of Different Building Heights (Moon et al.,
2 0 0 7 ) ... 2 2
Figu re 16 : A sp ect R atio D efin ition ... 22 Figure 17: Weight in Steel Diagrid Structures as a Function of Diagonal Angles (Kim and Lee, 2012)
... 2 3
Figure 18: Selected Performance Indicators (Story Drift, Inter-story Drift, Steel Consumption) Indicating 4-story Diagrid Modules as the Optimal Size (Isaac and Ipe, 2017)... 23 Figure 19: Efficiency Comparison by Montuori et al. (2015)... 24 Figure 20: Effect on Horizontal Dilation of Diaphragm Restraint (a) No Restraint (b) Restraints at
Every 9th Floor (c) Restraints at Every Floor) (Montuori et al., 2015) ... 25 Figure 21: Module Node Constraints Comparison: (a) Single-story (b) Double-story (Montuori et al.,
2 0 1 5 ) ... 2 6
Figure 23: Recommended R Value for Steel Diagrids (Baker et al., 2010) ... 27
Figure 24: Geometric Definition of Six Models...32
Figure 25: 3D Rendered View of Six Models, Showing the Braced Frame Core in 60-Story Models and Gravity Only Columns in 36-Story Models ... 33
Figure 26: Typical Angle of Diagrid Diagonal Members... 34
Figure 27: Horizontal Hexagrid Module Definition... 35
Figure 28: Vertical Hexagrid Module Definition...36
Figure 29: Table of Permitted Analytical Procedures as Listed in ASCE 7-10 Chapter 12 ... 37
Figure 30: Sample Design Response Spectrum Used for Equivalent Lateral Force Analysis and Modal Response Spectrum Analysis (ASCE, 2010)... 38
Figure 31: First 10 seconds San Francisco Design Response Spectrum with Spectral Acceleration on Y -ax is, P erio d o n X -axis ... 4 0 Figure 32: First 10 seconds San Diego Design Response Spectrum with Spectral Acceleration on Y-ax is, P e rio d o n X -Y-ax is...4 1 Figure 33: Ground Shaking Intensity Map FEMA E-74 (FEMA, 2012) ... 42
Figure 34: First Five Modes of 60 Story Models: Diagrid, Horizontal Hexagrid, and Vertical Hexagrid fro m T o p to B ottom ... 4 5 Figure 35: RSA Story Displacement vs. Floor Plots of 60 Story Models...49
Figure 36: Shear vs. Flexural Deformation Mode (Hiraish, 1983) ... 50
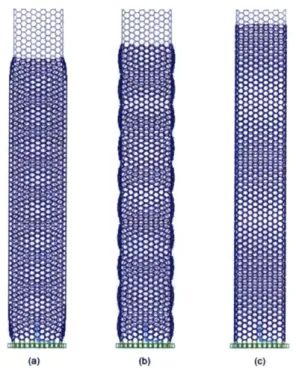
Figure 37: Deflected Shapes of 60-story Diagrid, Horizontal Hexagrid, Vertical Hexagird Showing Flexural (Diagrids on the Left) and Shear Dominated Deflected Shapes (Two Hexagrids on th e R ig h t) ... 5 1 Figure 38: Steel Mass and Seismic Performance Correlation for 60 Story Models... 53
Figure 39: First Five Modes of 36 Story Models: Diagrid, Horizontal Hexagrid, and Vertical Hexagrid fro m T o p to B o tto m ... 5 5 Figure 40: Story Displacement vs. Floor Number Plots of 36 Story Models ... 58
Figure 41: Steel Mass and Seismic Performance Correlation for 36 Story Models ... 60
Figure 42: Complex Connections Commonly Present in Diagrid Structures (Left: Swiss Re Tower, Right: H earst Tow er) (Boake, 2016) ... 63
List of Tables
Table 1: Seismic Design Factors for Steel Diagrid Structures (Baker et al., 2010)... 28
Table 2: Seismic Design Factors for Steel Diagrid Structures (Sadeghi and Rofooei, 2018)... 28
T ab le 3 : T y p ical M em b er Sizes ... 3 6 Table 4: ASCE 7-10 12.9 Calibration Requirements ... 39
Table 5: Seism ic Param eters of Tw o Sites...40
Table 6: Values Required to Construct Design Response Spectra... 40
T able 7: M odal M ass Participating R atio ... 43
T able 8: M R SA to ELF Base Shear Ratio ... 43
Table 9: Fundamental Periods and Fundamental Natural Frequency of 60 Story Models... 45
Table 10: Top Story Drift of 60-Story Models... 46
Table 11: Top Story Acceleration of 60-Story Models Under Seismic Loading ... 51
Table 12: Steel Mass and Embodied Carbon of 60 Story Models... 52
Table 13: Material Efficiency of Different Systems of 60 Story Models ... 52
Table 14: Fundamental Periods and Fundamental Natural Frequency of 36 Story Models ... 55
Table 15: Top Story Drift of 36-Story Models... 55
Table 16: Top Story Acceleration of 36-Story Models Under Seismic Loading ... 59
Table 17: Steel Mass and Embodied Carbon of 36 Story Models... 60
Table 18: Material Efficiency of Different Systems of 36 Story Models ... 60
1. Introduction
From the Great Pyramid of ancient Egypt to the modern
Jeddah
Tower in Saudi Arabia set to exceed 1000 meters, human ambition to reach new heights has never ceased. The astonishing progress would not be possible without the innovations and development of more efficient structural systems for different heights. Diagrids, i.e., diagonalized grids, for example, are among the most innovative and efficient structural systems for mid to high-rise buildings that have emerged in the recent decades (Boake, 2013). The essence of structural engineering is to design structures, by the means of choosing geometric form and material, to resist the anticipated vertical and lateral loads on a structure. Conventionally, such loads have been resolved by either frames with specially-detailed rigid connections that can resist loads in both directions by compression and bending action, or by separately resolving the lateral loads using more efficient elements such as braced frames, which deal with lateral forces through elements in compression, tension, or both. In diagrid structures, an innovative approach is taken by combining the advantages of the two traditional methods by eliminating most of perimeter columns and resolving both the gravitational and lateral forces through tension and compression actions of the diagonal members, as illustrated in Figure 1(a) (Moon et al., 2007). First proposed as a structural system in published literature in 2012 by Mashhadiali and Kheyroddin, Hexagrid system is the new iteration of the exoskeleton tubular structural system. It features modules composed of hexagon-shaped structural elements on the perimeter of the structure to resolve lateral and gravitational forces in a similar manner to diagrids. The load path diagram is illustrated on the right side of Figure 1(b).LOADING eJ DIRECTION L - it _X_. 6 FLANGE WEB (a) (b)
Figure 1: Diagrid (left) and Vertical Hexagrid (right) Structural System (Moon et al. 2007;
There has also been recognized research work by Moon et al. (2007), Boake (2013), and Kim and Lee (2013) on the design, optimization and comparative studies of diagrids, as they relate to other traditional frame structural systems. Although there are few existing constructed diagrid structures in high seismic zones at this time, it is still essential to investigate the dynamic response behavior and performance of any new structural systems for applications in those regions. One example of the use of diagrids in relatively high seismic zone is the Poly International Plaza in Beijing, as shown in Figure 2. The seismic zoning map is shown in Figure 3, indicating high peak acceleration near Beijing
(Gao, 2003).
Figure 2: Poly International Plaza, SOM
8 W lo 10 220' 130' 140'
.040 X
0. 20g F0. 3Zh -.0. 059
Figure 3: Acceleration Zoning Map of China (Gao, 2003)
20,
At this point, the seismic behavior and performance of diagrids are relatively well-understood through analytical and experimental work carried out by leading design firms like Skidmore, Owings & Merrill (Baker et al., 2010) and researchers in the academia (Sun, 2015; Kim and Lee, 2013; Kim and Lee, 2012). However, there has been less work devoted the understanding of seismic behavior and performance of the new iteration in tubular exoskeleton structural system: hexagrids.
This paper aims at shedding some light on the seismic performance and systematic exploration of the dynamic behavior of tall buildings using different configurations of the hexagrid structural system, with the purpose of investigating the relative efficiency and performance of the newly proposed structural system under strong seismic load. The paper will start with an overview of the structural system development for tall buildings with a focus on exoskeleton tubular structures: diagrids and hexagrids in Section 2. A state-of-the-art literature review on the pattern optimization and performance of the two systems will be presented in Section 3. In section 4, the analytical models used for this study will be defined. Then, an introduction to the analysis procedure and criteria to be used will be presented in Section 5. With the analysis complete, comparative studies of the structures using hexagrid system to comparable benchmark diagrid structures of different height and aspect ratio will be carried out in Section 6. Section 7 and 8 will conclude the study with design implications and potential future research areas.
2. An Overview of the Structural Systems for Tall Buildings
The immense economic and technological advancement due to the second Industrial Revolution, especially the emergence of the first vertical transportation hoist designed by Elisha Otis in 1852, enabled the development of modern high-rise buildings in the two major cities: Chicago and New York City (Kayvani, 2014). Structural heights of tall buildings have since been pushed higher and higher. Such vertical growth would not be possible without the innovations in structural systems along the way.
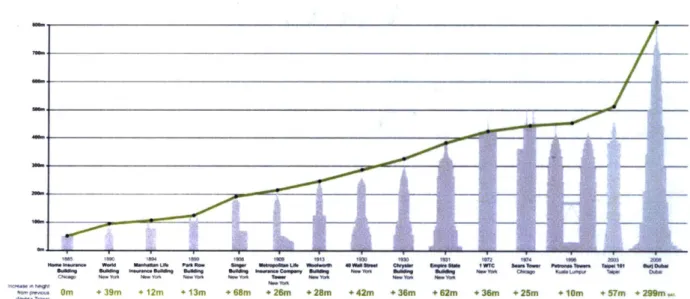
Figure 4 shows the rapid height growth of the tallest building in the world in a just little over one century. Some of the step-ups are a direct result of the use of an innovative structural system. For example, the first ever modern skyscraper-Home Insurance Building-in Chicago was made possible by the application of structural steel framing in place of thick and heavy masonry bearing wall system. (Kayvani, 2014) The Sears Tower finished in 1974 that held the tallest building title for over two decades owes its glory to the Bundled Tube system, which was a major shift from the traditional tubular system and the even older portal frame system used in tall buildings like the Empire State Building in New York City. The current tallest building, Burj Khalifa (initially named Burj Dubai), brought a dramatic 60% increase in height compared to Taipei 101 thanks to its Buttressed Core structural system capable of resisting all the expected loads and meeting serviceability requirements on the 828-meter tower (Baker and Pawlikowski, 2012).
III
7I
160 860 804 i~ 1880 ii 103 1808 8680 1801 102 104 860 8080 80.,. waft0 M086801 LOS p608ft. am Us80gwMIft 60g~uM *in80" ch80m MMOMM 11 "Mum008. ftwan60M u*6080 @we"
Om +0 39m + 12m + 13m +68m 6m + 428m + 42m + 36m +*62m .36m + 25m laGm + 57m +299m,.
ft,". Telor
Figure 4: Timeline of World's Tallest Buildings and Increase in Height from Previous Record (Kayvani, 2018)
One of the greatest structural engineers and the pioneer in innovating structural systems for skyscrapers, especially tubular structures, Fazlur Rahman Khan, put together diagrams illustrating the most efficient structural system for various heights with steel and reinforced concrete in the 1970s, as shown in Figure 5: IME INE UM-do 0
13
I
I
I
I
I
%6
]I
i
_ _Figure 5: Structural System for Different Height by F.R. Khan (Gu, 2015)
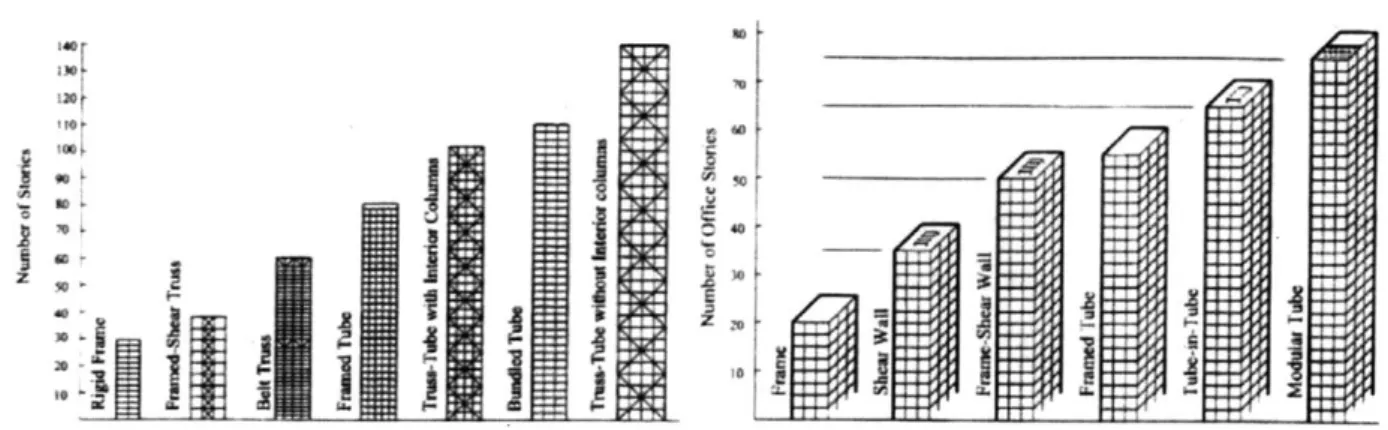
Categorization of these systems is just like any other engineering problem: there is no one unique solution. Different methods were proposed and used in previous research on structural systems, like the one done by Mir M. Ali in which he categorized systems based on the location (interior or exterior) of the main load bearing system. A previous study carried out by Gu in 2015 categorized structural systems into six main types: Rigid Frame, Core and Outrigger, Framed Tube, Trussed Tube, Tube in Tube, and Bundled System. She gave definition of these systems and introduced the main advantages. The systems of particular interest to this paper-diagrid and hexagrid-are considered as iterations of trussed tube system. An evevation view showing the defining characteristics of braced tube system and diagrid system is shown in Figure 6.
Braced Tube
Diagrid
Figure 6: Elevation View of Traditional Braced Tube and Diagrid (Moon et al., 2007)
2.1 Diagrids
Like mentioned in the previous section, diagrids are considered, by some, as a type of trussed tube structural system. It was defined and discussed in more detail in the introduction section. Similar to braced tube used in John Hancock Tower in Chicago, it was found to be efficient for structures up to 100 story tall (Gu, 2015).
The first real world application of diagrids was designed by Leslie E. Robertson Associates Consulting Structural Engineers in the IBM Building in Pittsburgh back in 1965. Many more diagrids mid to high-rise buildings have been designed and constructed since then, especially in the early 2000s, such as the Swiss Re Tower in London and the Hearst Tower in midtown Manhattan, New York City. The height of these earlier buildings does not represent the full potential of the diagrid structural system. Some other designs in recent years like the Lotte Super Tower proposed by Skidmore, Owings and Merrill and Guangzhou West Tower utilized the diagrid system to reach super tall status defined by Council on Tall Buildings and Urban Habitat, standing at 440 meters and 556 meters (Sun, 2015).
Figure 7: Upper Row from Left to Right: IBM Building (Boake, 2013), Swiss Re Tower, Heast Tower; Lower Row from Left to Right: Lotte Super Tower, Guangzhou West Tower (Sun, 2015)
Given its popularity, it is not surprising that there has been much research on the diagrid structural system with focus on its angle optimization, wind-induced behavior, and progressive collapse behavior.
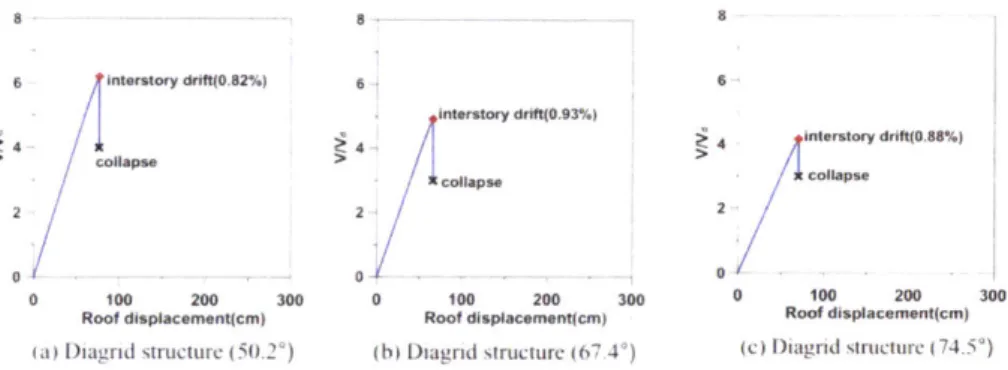
However, there is one major drawback in this system. Kim and Lee (2012) were among the first to investigate the seismic performance of diagrid system. They found out that, with nonlinear static and dynamic analysis, buildings with such system do not have high ductility, as shown in the pushover curve in Figure 8. All models failed at below 1% interstory drift, exhibiting unwanted brittle behavior for seismic applications (Kim and Lee, 2012). This is due to the inherent load-resolving mechanism, compression and tension of diagonal members, neither of which action would behave in a ductile manner. 8 - - - -_,- -- - -__ 8 6 interstory drift(O.82%) 6 6 interstory drft(0.93%) 4 4 Interstory drift(O.88%) collapse :1-F IIcollapse collapse 2 2 / 2 0 - --- 0 -- 0 0 100 200 300 0 100 200 300 0 100 200 300 Roof displacoment(cm) Roof displacement(cm) Roof displacement(cm)
(a) Diagrid structure (50.2*) (b) Diagnid structure 167 4') (c) Diagrid structure (74.5')
Figure 8: Pushover Curves of Diagrid Structures with Different Diagonal Angles (Kim and Lee,
2012)
2.2 Hexagrids
Hexagon and hexagon-like shapes are very common in natural structures and materials at both miniscule and larger scales. Montuori et al. (2015) discussed the presence of such shapes in nature in their studies on the mechanistical properties of different hexagrid structure configurations. For example, in culler solids like balsa and cork, hexagon-shaped cells efficiently populate the space to form the material, as illustrated in Figure 9.
Figure 9: Hexagon Shape in Natural Structure: Balsa and Cork Structural Patterns (Montuori et al.,
2015)
At a larger scale, the most obvious hexagon natural structure is beehive. The hexagon shape of honeycomb is believed by Roman scholar Marcus Terentius Varro to be the one that holds the largest amount of honey with least amount of wax required to build. Mathematician Thomas Hales formulated mathematical proof of "honeycomb Conjuncture", stating that one can divide a surface into equal regions with least perimeter length with hexagonal grids. This highly efficient structural pattern from nature has inspired material engineers to create light artificial composite material to possess high compression and shear strength (Montuori et al., 2015). Structural engineers and researchers are also interested in incorporating this naturally efficient pattern in load resisting system. As discussed in the introduction, Mashhadiali and Kheyroddin (2012a, 2012b) first proposed, in the form of a published literature, the use of such system on high-rise buildings, praising it as an innovative and efficient tubular structural system that is also architecturally pleasing. Aside from studying wind-induced behavior, they also carried out nonlinear static and dynamic analyses on three archetype models constructed in commercial software SAP2000. The linear pushover curve similar to those constructed by Kim and Lee (2012) in Figure 8 are shown in Figure 10 below. It was determined that hexagrid system has higher ductility and better inherent energy dissipation potential when compared to diagrid system (Mashhadiali and Keyroddin, 2012b).
03 -*A* 02 al 0 0 0.2 04 0.5 03 1 2
Figure 10: Pushover Curve of Hexagrid Structural System (Mashhadiali and Keyroddin, 2012)
In general, high ductility is highly desirable for seismic application, for that the high ductility can help achieve life safety goal set forth in building codes by giving ample time and warning to occupants. This one specific property might make hexagrid system a more desirable choice than diagrid structural system in high seismic zones.
At the time of writing this paper, there is no finished structure that utilizes hexagrid structural system alone as the sole lateral and vertical force resisting system yet. However, there has been conceptual designs such as the Sinosteel building and the Nanotower discussed by Montuori et al. (2015) in their study, which are shown in Figure 11.
Figure 11: Sinosteel Building and Nanotower Conceptual Rendering (Montuori et al., 2015) The Al Bahar Tower engineered by Arup in Abu Dhabi incorporated hexagrid frame in the concrete
core system tower. However, the hexagrid frame only provides about 10% of the overall lateral stiffness to the finished building (Lee and Kim, 2017). Figure 12 shows the finished project, which has architectural finishing but still shows the hexagonal frame pattern on the fagade (Arup, 2013).
Figure 12: Al Bahar Tower Hexagonal Frame (Arup, 2013)
All this information presents an opportunity for research to compare other seismic performance parameters such as drift and acceleration, as well as structural efficiency to those of similarly configured diagrid system, which will be the focus of this study.
3. Critical Literature Review: Seismic Performance and Optimization of
Diagrid and Hexagid Structural Systems
Recently, significant efforts (Boake, 2013; Kim and Lee, 2013; Kim and Lee, 2012; Moon et al., 2007) had been put into investigating and optimizing the performance of diagrid structures of different
modules. Hexagrids have also been studied (Mashhadiali and Keyroddin, 2012; 2013; Mathews et al.,
2016) to some extent in the past few years. To make the comparison valid, it is essential that equivalent and also the best performing modules are used in the analysis of the building models. For exoskeleton tubular structures like diagrids and hexagrids, modules are defined as the same geometric section that repeats itself throughout the height and perimeter of the building. For
example, one module is highlighted for each of the structural models in Figure 13.
KbI
Figure 13: Module Definition
Thus, state-of-the-art literature review related to the optimal patterns and seismic performance is conducted and the important findings are presented in the following sections.
3.1 Optimal Diagonal Angles and Patterns
3.1.1 Diagrid Structural System
For diagrid structures, it is commonly accepted that the angle between the diagonal members and the horizontal plane is the one of most important parameters that controls the efficiency of the system, noted as angle a in Figure 14.
Figure 14: Angle between the Diagonal Members and the Horizontal Plane
V VV V A A A. A V VVNJ A A A A V V V V V VA.-V VA.-V VA.-V A -A--A ff V V V W V V V I X. 4
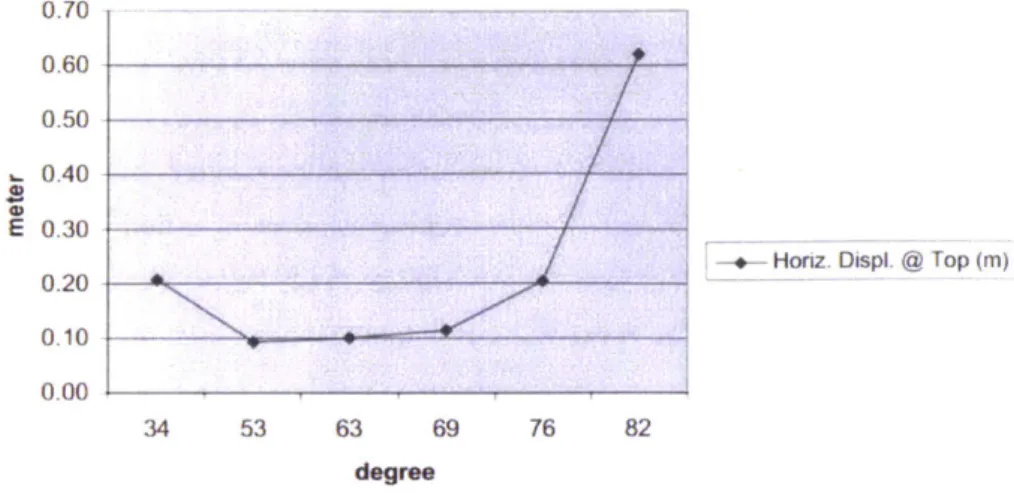
Moon et al. (2007) studied and published a paper about the mechanical characteristics and angle optimization of diagrid structures of various heights using several numerical models and an iterative design process to establish guidelines for design professionals. The fundamental mechanics, including shear and bending stiffness of diagrid modules, was studied to establish formulas for initial member sizing and optimal angle a. The important graphs and results are shown in Figure 15 below. The graphs represent the resulting horizontal displacements at the top of the diagrid structures of 3 different heights, 60, 42, and 20 Stories, with different diagonal angle a.
2 50 ,
* I i~ [ .p ( ,I)II(1
A
degree
10 82 1)()
(a) 60 Story Diagrid Models
34 53 63 69 76 82
degree
(b) 42 Story Diagrid Models 2.00 1.50 1.00 E 0.50 0.00 E 1.40 1.20 1.00 0.80 0.60 0.40 0.20 0.00
0.70 0.60 0.50
~.0.40
E 0.30 0.20 0.10 0.00. Horiz. Displ. @ Top (m)
34 53 63 69 76 82
degree
(c) 20 Story Diagrid Models
Figure 15: Top Story Displacement vs. Diagonal Angle of Different Building Heights (Moon et al.,
2007)
Moon et al. (2007) concluded with the statement that the range of 65 to 75 degrees is the optimal one for diagrid structures of 60 stories and an aspect-ratio of 7. Aspect ratio is simply defined as the ratio between the height and the base width of the structure, h/b, defined in Figure 16.
Figure 16: Aspect Ratio Definition
This range becomes lower for lower structures with a smaller aspect ratio. Namely, it is 55 to 65 degrees for a 42-story structure with an aspect ratio of around 5 (Moon et al., 2007). These results
highly agree with research conducted by Kim and Lee (2012), who studied the seismic behavior of multiple 36-story diagrid structures with a fixed aspect ratio of 3.6 and various diagonal angles using nonlinear static and dynamic analyses. They found out that brace angles between 60-70 degrees will result in the highest efficiency for resisting vertical and lateral loads. The important figure illustrating the findings regarding efficiency as related to diagonal angles is listed in Figure 17. Isaac and Ipe (2017) arrived at similar conclusions in their studies as well.
14000 13000- 12000- 11000-10000- . 50 60 70 80 Diagrid angle
Figure 17: Weight in Steel Diagrid Structures as a Function of Diagonal Angles (Kim and Lee, 2012)
In addition, Isaac and Ipe (2017), in their comparative study work of Diagrid, Hexagrid and Octagrid systems, also found the optimal module sizes (the height of each "Diamond" shape) to maximize efficiency at resisting dynamic lateral loads. They concluded that the Diagrid building with 4-story modules and 67.38-degree diagonal angle exhibits the most desirable behavior among 2-12 story
modules studied, resulting in greater lateral stiffness and low structural weight. Some key graphs are
shown in Figure 18.
ETRr
cIN-~a NTERSfEORE DRIFT-iSTOREl STEELCONSaPfONiSTOREl
F :P a
dy t,
dt 4 U-r g
Figure 18: Selected Performance Indicators (Story Drift, Inter-story Drift, Steel Consumption)
Indicating 4-story Diagrid Modules as the Optimal Size (Isaac and Ipe, 2017)
3.1.2 Hexagrid Structural System
For hexagrid structures, similar studies were carried out by multiple groups varying the module
orientation, sizes, and diagonal angles. Among those studies, the work by Montuori et al. (2015) and
Mathews et al. (2016) provided insights on maximizing the efficiency of hexagrid structural system.
The following figure is obtained from the paper by Montuori et al. (2015), and the formula used to
define efficiency is:
Efficiency = Pv *
p
*b
Where pv is visual density, p is structural weight density, and b is the thickness of the exoskeleton
tube. Each of the perimeters are defined differently for each system. It is discussed in more detail in
Section 9 of Montuori et al. (2015). In Figure 19, the efficiency of each model is plotted, where H._H-30
means 30 story horizontal hexagrids; VH means vertical hexagrids; and D means diagrids.
0,045 , 'W45 0 H H,4 _H30-s 0 HH 40v tH H_50v _H_60 _v H_H_70_-v 0 V_H_30_v 0.035 *V_H_40_v :VHSOv VH_60_v 0,030 V-H-70. a D_30_v a 0_40-v 0,025 0,02o 0,015 0,01(i 0,005 2S 35 45 5 65 on 75
Figure 19: Efficiency Comparison by Montuori et al. (2015)
In terms of diagonal angles, Montuori et al. (2015) pointed out that, using preliminary parametric
analyses and complete building design analyses, for horizontal hexagrids and vertical diagrids,
diagonal angles of 60 degrees and 40-50 degrees respectively, are the most efficient in terms of a
combined performance considering module stiffness, structural weight and visual density, which is
a very significant architectural concern as it directly affects the amount of daylight and feel of
openness of a building.
Regarding module height, they presented that, for horizontal hexagrids (here two parallel sides of
the hexagon are horizontal), the edge constraints imposed by the rigid diaphragm at each floor can
significantly increase the axial rigidity of hexagrid tubes by constraining the lateral dilatation of the
structure, as illustrated in the Figure 20 below (Montuori et al., 2015).
(a) (b) (C)
Figure 20: Effect on Horizontal Dilation of Diaphragm Restraint (a) No Restraint (b) Restraints at
Every 9th Floor (c) Restraints at Every Floor) (Montuori et al., 2015)
For unit cell (module) whose height equals to the inter-story height (Figure 21(a)), only partial horizontal movement of the nodes are possible when the structure is subjected to axial load. However,
for modules of double-story height (Figure 21(b)), all the nodes land on diaphragms and such
undesired movements can be fully blocked. Thus, double-story height is more advantageous and efficient in resisting axial load and controlling both vertical and lateral displacements of structural members. h/2 dW2=0
1F
1A
-
N~J
A 2 (aa0h/2 d/2cos"
...
C
...
/... .. .. 2 - -- - -D F Diaphragm-Constraint UNIT (F i (b)Figure 21: Module Node Constraints Comparison: (a) Single-story (b) Double-story (Montuori et al.,
2015)
The findings about module height were in line with what Mathews et al. (2016) found in their research on the seismic performance of hexagrid systems. The group studied three patterns of hexagrids proposed by previous researchers and used a total of 15 different configurations by varying the module geometry (width and height), concluding that: vertical hexagrids have the highest stiffness among others; and that for horizontal hexagrids, double-story height modules perform better (stiffer) than the 4-story modules.
The literature review related to optimal modules for the two structural systems provide significant foundation and baseline information for the comparative study to be conducted in this paper, especially for the model set-up and definition.
3.3 Seismic Performance & Design Factors
The focus of this paper is on the systematical study of dynamic response behaviors of diagrids and hexagrids under moderate to high seismic load. Thus, it is essential to obtain and apply the correct seismic design factors-Response Modification Factor (R), Over-strength Factor (flo), and Displacement Amplification Factor (Cd). The definitions of these factors are illustrated in Figure 22
Design Earthquake Ground Motions C' R= Response Modification Confiaent = VV C,= Dsleaon Ampflatbon Facor = (&'VR S= Overstrength Factor = VV Pushover Curve
Lateral DqMplacemrt (Roof Drift)
Figure 22: Definition of Seismic Parameters (FEMA, 2003)
Baker et al. (2010) from one of the world's leading structural engineering firm with long and distinguished tradition in the design of tall buildings Skidmore, Owings & Merrill conducted research
on these factors and published a paper proposing a methodology to determine the design factors for
steel diagrids based on ATC-63 project/FEMA P695 approach in 2010. It is a probability-based
approach to achieve the collapse prevention goal set forth by ASCE 7 by studying 300 different archetype models with varying aspect ratios, diagonal angles, seismic design categories, and gravity load intensity and subjecting the aforementioned archetype models to nonlinear static analyses.
Iterations were used for the convergence of the R-factor, which are shown in Figure 23.
1.2 1.0 0.8 0.6 0.4 0.2 0.0 0 - - O --R = .00 -R 2.03 -- R=272 --- R= 3.42 8-664 2 0 1 2 3 4 5 - - - --5 10 15 20 25 V.
Roof Dispbceenet (in)
Figure 23: Recommended R Value for Steel Diagrids (Baker et al., 2010)
The analysis results for the design factors recommended for the design of steel diagrid structures are
summarized in the Table 1.
U,
3
L
-VA V -F~J 1-I JWR __... R WPMi ieTable 1: Seismic Design Factors for Steel Diagrid Structures (Baker et al., 2010)
Seismic Design Factor R fo
Value 3.64 1.5
However, the industry and academia has not come to a consensus on these numbers to this day. Sadeghi and Rofooei just published a paper on March 23rd, 2018 (One month before this paper was written) questioning the validity of the number found by Baker et al. Sadeghi and Rofooei (2018) conducted similar numerical studies using FEMA P695 approach, concluding that R of 3.64 is unconservative for seismic design category (SDC) of D and above and suggesting that different R factors to be used based on the diagonal angle. R factors proposed by Sadeghi and Rofooei (2018) are listed in Table 2.
Table 2: Seismic Design Factors for Steel Diagrid Structures (Sadeghi and Rofooei, 2018)
Diagonal Angle 71.5 63.4 145
Response Modification 3 2.5 1.5
Factor R
As for the hexagrid structural system, there has been little work done on establishing appropriate seismic design factors. Researchers conducting studies on hexagrid systems have used different response modification factors to obtain the seismic design forces and conducting published comparative studies, which are scarce at this time. The R values range from 3 to 6 (Mashhadiali and Keyroddin, 2012; Mathews et al., 2016; Darbandsari and Abdadi, 2017).
Since there is no consensus on this subject matter for either Diagrid or Hexagrid structural systems, for the purpose of this study, the Seismic Design Factors R and flo will be set at 3 and 1.5, respectively, for models of both structural systems. This is to control the variables in seismic design forces by using the same Design Response Spectrum for both models in order to compare their behavior and performance under the same expected earthquake intensity.
4. Model definition
Geometry has been proven to have a tremendous effect on the efficiency of a structural system for building structures. Two heights were chosen for the scope of this study to examine the seismic behavior of the new hexagrid system: a 60-story at a height over 200 meters (656 ft) and a 36-story that stands about 130 meters tall (427 ft). Two hexagrids structure models were constructed for each height with different patterns (Horizontal and Vertical), totaling four hexagrids models. Additionally, two diagrid structures of the same heights as the hexagrid models were also constructed as the benchmark structure to carry out the comparative study. This section is devoted to describing, in detail, the various geometric aspects of the models constructed.
4.1 Overall Geometry
Like discussed in Section 3, aspect ratio is one of the most important factors that influences the behavior and efficiency of a building (Sun, 2015; Kim and Lee, 2012). For example, the lateral deformation of short and stocky structures tends to be shear governed while a tall and slender building to behave more like a bending beam.
The base for the 60-story building was chosen to be a square of 42 meters (138 ft) in width while the 36-story building has a base width of 36 meters (118 ft). These choices were made based on typical real buildings at similar height and previous work of other researchers (Sun, 2015; Mathews et al., 2016; Darbandsari and Abdadi, 2017).
The story height was set at 3.6 meters (11.8 ft) for both building heights, making the 60-story building stand at 216-meter tall (709 ft) and the 36-story at 129.6 meters (425 ft). Thus, two different aspect ratios were set at 5.14 and 3.6. Typical floor and elevation views of the 6 models are shown in Figure 24. 3D rendered views are listed in Figure 25. Module geometry will be discussed in more detail in Section 4.3 (for diagrids) and 4.4 (for hexagrids).
LIV
G2/
V
7V-(a) Plan (3-m constant Grid Spacing, Typical Unless Noted Otherwise), Elevation, and 3D views of 60-story Diagrid Model
B1
E2 G2
(b) Plan (2.08-m and 3.625-m Alternating Grid Spacing), Elevation, and 3D views of 60-story Horizontal Hexagrid Model
I VP
i-I
LT L. .X. L.. XMI
2, L Am LmI
B
Gi
(c) Plan, Elevation, and 3D views of 60-story Vertical Hexagrid Model
B1 B2
G3
ir
(d) Plan, Elevation, and 3D views of 36-story Diagrid Model
V
V
V
V V
A A A A A A I VVV A A A A A V V V V I A V A V A V A V A A VVVVVV / A V A V A V A V A A V V V V V AAAAA'"' /VVV A A A A V V V V IV V V V \ A A A A A I vvvvvv V V V V A A A A A I A A A A A A 1VVVV N A A A A A V V V V V V V tx x x x H+H+H IIB1
(e) Plan (2.08-m and 2.77-m Alternating Grid Spacing), Elevation, and 3D views of 36-story Horizontal Hexagrid Model
B1
B2 G2
--
4-
'1-(f) Plan, Elevation, and 3D views of 36-story Vertical Hexagrid Model Figure 24: Geometric Definition of Six Models
FL
/ 1-4 P \ / N' 7-N I NFigure 25: 3D Rendered View of Six Models, Showing the Braced Frame Core in 60-Story Models and Gravity Only Columns in 36-Story Models
4.2 Material
Structural steel was the only material assumed for all 6 models in order to control the variables as different material will drastically change the dynamic behaviors of a tall building as shown by Sun (2015) in his study of steel versus concrete diagrids.
4.3 Selected Diagrid Structural System
The primary focus of this paper is on the new iteration of tubular structural system: Hexagrids. Two diagrids are selected and modeled to be considered as the benchmark structures to which the hexagrid system will be compared. Thus, it is essential to select an optimal configuration for the modules to be used in the models.
As discussed in detail in Section 3.1.1, diagonal angles of 60-70 degrees are represented as the general consensus on the optimal range for structures of interested height and aspect ratio. Based on the previous work of Moon et al. (2015), Kim and Lee (2012), as well as Mathews et al. (2016), 67.4 degree was chosen to be the diagonal angles to be used on both the 36- and the 60-story benchmark structures, as shown in Figure 26. The 4-story module, which has the highest stiffness and relatively low structural weight among 5 other module heights, was chosen based on previous research from Mathew et al. (2016) discussed in more detail in Section 3.1.1.
V74 Typ.V
Figure 26: Typical Angle of Diagrid Diagonal Members
It shall also be noted that all 60 story models have an identical braced steel frame structural core
dimensioned at 18 meters by 18 meters located at the geometric center of the floor plan to provide
additional lateral stiffness. The core is connected to the diagrid or hexagrid perimeter structure with
transfer beams at each floor. It is also understood that such core is not needed for tubular structures
in an ideal situation because of the high stiffness inherent with exoskeleton tubular structures like
these. Nonetheless, this choice was made based on previous research (Sun, 2015), architectural
needs for vertical transportation, as well as common construction practice for buildings of similar
height and structural system. The inclusion of the core also allows the reduction of the member sizes
and an increase in redundancy by using a dual system (Sun, 2015).
Structural core is not included in any of the 36-store models, however. Additional gravity columns
are added in the interior to reduce the beam spans and to share gravity loads with the tubular shell
structure.
It is important to note that such cores and columns are kept constant (same location and size) for all analytical models to reduce their effect to the minimum. Transfer beams and gravity beam locations are not matched 100% between the diagrid and hexagrid models due to the node location difference in each system, although great effort was made to keep those elements as similar as possible to minimize the effect on the overall systematic assessment of the dynamic behavior of the building models.
4.4 Hexagrid Structural System
Two types of hexagrid modules are studied and compared to diagrids to have a more comprehensive understanding of this innovative system. One is horizontal and the other is vertical. Horizontal hexagrid is defined as those structures having the two parallel sides of the hexagon are parallel to a horizontal plane, shown in Figure 27, whereas vertical hexagrid is defined as having two parallel sides of the hexagon perpendicular to the horizontal plane, shown in Figure 28.
Similar to Diagrid structures, the behavior of hexagrids is also highly related to the module shape, especially the size and diagonal angle. This section is devoted to defining the module geometry.
4.4.1 Horizontal Hexagrid
The module used to model horizontal hexagrids in this study has double-story height and a diagonal
angle of 60 degrees, as illustrated in Figure 27.
600 Typ.
Figure 27: Horizontal Hexagrid Module Definition
This module selection is an informed decision based on previous studies by Montuori et al. (2015) discussed in detail in Section 3.1.2.
4.4.2 Vertical Hexagrid
In a similar fashion as the horizontal hexagrids, the module of the vertical hexagrids is selected. The diagonal angle is
a story height 3.6 meter
6 = arctan I = arctan I= 50.190
0half hexagrid width = 3 meter
This angle is right at the upper limit of the recommended 40-50 degrees range by Montuori et al. (2015). The 4-story module height is selected based on the work of Mashhadiali and Kheyroddin (2012), and Mathews et al. (2016) hexagrid systems. A typical vertical hexagrid module is shown in Figure 28.
\5 0.1-^ Typ.
Figure 28: Vertical Hexagrid Module Definition
4.5 Typical Member Sizes
Some typical member sizes for the models are shown in Table 3 below. Beams and girders are selected from readily available wide flange sections, while members of the grid shell structures are custom square HSS sections. Member sizes are controlled across different models to minimize the effect caused by different sections on the system behavior.
Table 3: Typical Member Sizes
Model Typical Beam Typical Girder Typical Grid Shell at
Base (mm)
60 Story All W24x94 (Bi) W27x1O2;(G1) HSS55Ox75
W27x129 (G2)
36 Story Diagrid and W21x83 (B2), W24x117; (G3) HSS45Ox25
Vertical Hexagrid W24x94 (Bi) W27x129 (G2)
36 Story Horizontal W24x94 (Bi) W27x102 (Gi) HSS450x35
Hexagrid I I
5. Analysis and Design Methodology
5.1 Code-Based Structural Analysis and Design
The objective of this paper is to study the dynamic response behavior and the relative efficiency of the innovative hexagrid structural system considering two different building heights and aspect ratios, and to compare the results to those of the more well-understood diagrid structural system to inform future design professional of the potential of the new system under seismic load. The six (6) analytical building models described in Section 4 are subjected to the design loads including Dead, Live, Partition, Wind, and Seismic set forth in ASCE 7-10, Minimum Design Loads for Buildings and Other Structures (ASCE, 2010), at two different locations. Structural members are sized based on a generally accepted stiffness criterion of horizontal displacement of the top story in tall buildings: 1) H/500 for wind load; 2) 2% drift under seismic load.
The following sub-sections will discuss the code-based seismic analytical procedures used in this study in more detail.
5.2 Seismic Analysis Procedure
5.2.1 Procedure SelectionAs mandated by ASCE 7-10 Section 12.6, the structural analysis of the analytical models shall consist of one of the permitted procedures outlined in table 12.6-1. This is shown in Figure 29. The structures
to be studies fall into the category of "all other structures". Thus, Modal Response Spectrum Analysis
or Seismic Response History Procedures are allowed. For this study, Modal Response Spectrum Analysis (RSA) will be used. A brief overview of this analytical procedure is provided in the next sub-section.
Table 12.6.1 Pennitted Analytical Procedures
Seismic Equivalent Uateal Modal Respo e Scksmic Respnw
Desigqn Force Analysts. Splsecesm Anialys Htitory Proceducs,
Category Stracdal Characteristics Section 12.W Setm 12 . Chapter 16e
B. C All structures P p P
D. E. F Risk Category I o l buildings not exceeding 2 P P p
stories above the base
Structures of light frme costruction P P p
Stnwtcs wills no sovactural irregularities anid not p p p
ceeding 160 f in structuasl height
Stnactres exceeding 160 ft in smaclaral height P p p with no struesoa irregularities and with T< 3.T,
Structures not exceeding 160 ln strucatural P P P
height and having only hori intal irregularties of
lyc2. 3.4. oe 5 in Table 12.3-1 or vertical incegularitics of Type 4. Sa, or 51 in Table 12.3-2
All other structures NP P P
T.: Permined. NP: NoA Pennted: ,
5.2.2 Overview of Modal Response Spectrum Analysis and Special Requirements Based on
ASCE 7-10 12.9
The dynamic behavior of any system can be studied if its equation of motion is written out. For a free-vibrating single Degree of Freedom dynamic system of mass m, stiffness k and damping c, the equation of motion can be expressed as:
mx + cx + kx = 0
A building structure can be generally idealized as a N-degree-of-freedom system whose equation of motion can be written in a similar form with scalars m, c, and k being replaced as three N x N matrices, [M], [C], and [K]. The most important dynamic attributes of such building structures, natural periods and their corresponding vibrating modes, can be extracted from the equation of motion by solving the following matrix eigenvalue and eigenvector problem:
[K]{x} -
w
2[M]{x} ={0}
Modal Response Spectrum Analysis is a linear dynamic analysis procedure used to predict the dynamic behavior of a structure subjected to a response spectrum by modal superposition. In general, the first few natural modes of a structure are extracted and subjected to the response spectrum to obtain the response of each mode and then the responses are combined numerically to provide the prediction of the overall response. The Design Response Spectra are to be divided by R/le to obtain the specific spectra to be used for a specific system to account for the post-elastic strength of the system, i.e., ductility. A sample Design Response Spectrum is shown in Figure 30.
IX
TO 1.0
Paiod. T(uc)
Figure 30: Sample Design Response Spectrum Used for Equivalent Lateral Force Analysis and Modal Response Spectrum Analysis (ASCE, 2010)
Different jurisdictions have different special requirements for the calibration of the design base shear and Modal Mass Participation Ratio. In this case, the code states that the number of modes shall be selected that the total Modal Mass Participation Ratio shall be at least 90% of the seismic weight in each orthogonal directions. Even though Equivalent Lateral Force Analysis is not allowed for the studied buildings, it is required in ASCE 7-10 12.9.4 that the resulting base shear from Modal Response Spectrum Analysis (Vt) to be at least 85% of the base shear found by Equivalent Lateral Force Procedure (V). If not, the response spectrum shall be scaled to achieve the 85% ratio to obtain member forces as well as drift. The requirements are summarized in Table 4:
Table 4: ASCE 7-10 12.9 Calibration Requirements
Parameter Modal Mass Participation Ratio MRSA Base Shear Vt
Requirement by ASCE 7-10 90%*W >85%*V
12.9
5.2.3 Modal and Directional Combination
It shall be noted that, for this study, results from different modes are combined using Complete Quadratic Combination (CQC) because of the expected closely spaced modes. Member forces resulted from the different application directions are also combined using Complete Quadratic Combination
(CQC) method.
5.3 Site Location and Parameters
The building models are to be set at two different locations, both of which with high magnitude ground motion, namely, San Francisco and San Diego in California, United States of America. San Francisco was chosen because of a previous study conducted by Sun (2015) about the seismic performance of diagrid structures with different materials. It is desired that the analysis results of the 60-story benchmark diagrid structure have similar results to validate the analysis and design procedures.
The ground motion parameters (Ss, S1, TL) are obtained from ASCE 7-10 22, and soil profile were obtained from United States Geological Survey (USGS) "Bay Area Soil Type and Shocking Hazard Map" from Sun's work (Sun, 2015). The site class is set as Class B for both locations to control the ground motion variation for comparison studies. These variables are summarized in Table 5.
Table 5: Seismic Parameters of Two Sites
Location Ss Si TL
San Francisco 2.00 g 0.95 g 12 sec.
San Diego 1.22 g 0.471 g 8 sec.
ASCE 7-10 Design Response Spectra for the two locations are then constructed. The critical values needed to construct the Design Response Spectrum as defined in ASCE 7-10 11.4.5 are listed in the
Table 6:
Table 6: Values Required to Construct Design Response Spectra
Critical Values San Francisco San Diego
SDS 1.33 g 0.815 g SD1 0.63 g 0.3 14 g TO = 0.2 x S 0.095 sec. 0.077 sec. Sag TS = SD1 0.470 sec. 0.385 sec. sDS TL 12 sec. 8 sec.
The Design Response Spectra for these two sites are then constructed as shown in Figure 31 and Figure 32: 1.30 -0.00 0.20 -0.15 -1.0 2.0 3.0 4 DA 64
Figure 31: First 10 seconds San Francisco Design Response Spectrum with Spectral Acceleration on
Y-axis, Period on X-axis
0.0 070 -0.40 0.20 0.10 -0-00- I 00 D 2.0 30 40 5-0 60 0
Figure 32: First 10 seconds San Diego Design Response Spectrum with Spectral Acceleration on Y-axis, Period on X-axis
It is noted that, as the Si value at the San Francisco site is greater than the limit of 0.6g, extremely high base shears were obtained because of the lower bound limit set forth by equation 12.8-6 in ASCE
7-10 12.8.1, which reads:
"for structures located where Si is equal to or greater than 0.6g, C, shall not be less than:
0.5s1 C=
(T.)
In this case, this will result in an extremely high C. value as follows
0.5S1
CS - - 0.158
(T)
In the practice industry, such a high C, value will warrant a Performance Based Design (PBD), as a building will never see such high base shear due to seismic because of its long period, which is beyond the scope of this study. That said, Code Based Response Spectrum Design was applied on the building models for this location to compare the results to those found by Sun (2015) to validate the analysis and design approach.
San Diego site was selected based on a lower Si value (0.6g), which leads to the design of the buildings out of the lower-bound Cs requirement to achieve a more realistic seismic design force and drift levels
-compared to the San Francisco Site. A ground shaking intensity map from FEMA (2012) document E-74 is shown in Figure 33.
Alaska Shaking intensity
MLoo Le of SOWWV
-Loew
Laef d f Moderut. L"oe of SaungWQHqh Le"e( Of Shung
Hawaii
Puerto Rico
Figure 33: Ground Shaking Intensity Map FEMA E-74 (FEMA, 2012)
Comparative studies were carried out after an iterative design process consisting of models being analyzed, members designed, model calibrated, and reanalyzed. Specifically, the seismic analysis and design were based on the Response Spectra shown above. Different seismic performance aspects were examined and discussed in detail in the following sections.
6. Results and Analysis
A total of six structural models constructed in ETABS Version 16.2 Ultimate (CSI, 2016) with the same loading criteria were analyzed at two locations of different seismic parameters, resulting in 12 sets of analysis results. The results will be discussed in detail in two comparative studies to be presented in this section.
As detailed in the previous Section, Modal Response Spectrum Analyses were used for all the models and calibrated to ASCE 7 12.9 requirement. The final Modal Mass Participating Ratios and Base Shear Ratios of all the models are documented in Tables 7 and 8.
Table 7: Modal Mass Participating Ratio
Model X-Direction Y-Direction
60 Story Diagrid 96.78% 96.82%
60 Story Horizontal Hexagrid 95.22% 96.16%
60 Story Vertical Hexagrid 95.22% 96.16%
36 Story Diagrid 95.70% 96.88%
36 Story Horizontal Hexagrid 95.11% 96.24%
36 Story Vertical Hexagrid 94.47% 94.49%
Table 8: MRSA to ELF Base Shear Ratio
Model San Francisco San Diego
X-Direction Y-Direction X-Direction Y-Direction
60 Story Diagrid 85.00% 85.04% 85.00% 85.04% 60 Story 85.00% 85.84% 85.00% 86.14% Horizontal Hexagrid 60 Story Vertical 87.72% 85.00% 87.80% 85.00% Hexagrid 36 Story Diagrid 85.00% 85.30% 85.59% 86.01% 36 Story 85.01% 85.95% 85.00% 86.21% Horizontal
H
exagrid 36 Story Vertical 88.23% 85.00% 88.26% 85.00% Hexagrid6.1 Comparative Study 1
-
60 Story
To study the important dynamic response characteristics of these models, linear dynamic analyses were carried out on these structures. To calculate the seismic weight, all the models are subjected to: