HAL Id: hal-02392366
https://hal.archives-ouvertes.fr/hal-02392366
Submitted on 4 Dec 2019
HAL is a multi-disciplinary open access
archive for the deposit and dissemination of
sci-entific research documents, whether they are
pub-lished or not. The documents may come from
teaching and research institutions in France or
abroad, or from public or private research centers.
L’archive ouverte pluridisciplinaire HAL, est
destinée au dépôt et à la diffusion de documents
scientifiques de niveau recherche, publiés ou non,
émanant des établissements d’enseignement et de
recherche français ou étrangers, des laboratoires
publics ou privés.
Determination of soot volume fraction and particle size
distribution in turbulent non- premixed butane and
ethylene jet flames through LII, PPS and SMPS
measurements
Irfan Mulla, Jérôme Yon, Guillaume Lefèvre, Bertrand Lecordier, David
Honoré, Armelle Cessou
To cite this version:
Irfan Mulla, Jérôme Yon, Guillaume Lefèvre, Bertrand Lecordier, David Honoré, et al.. Determination
of soot volume fraction and particle size distribution in turbulent non- premixed butane and ethylene
jet flames through LII, PPS and SMPS measurements. European Combustion Meeting 2017, Apr
2017, Dubrovnik, Croatia. �hal-02392366�
*
Corresponding author: armelle.cessou@coria.fr Proceedings of the European Combustion Meeting 2017
Determination of soot volume fraction and particle size distribution in turbulent
non-premixed butane and ethylene jet flames through LII, PPS and SMPS measurements
Irfan A. Mulla, Jérôme Yon, Guillaume Lefevre, Bertrand Lecordier, David Honoré, Armelle Cessou
* Normandie Univ., UNIROUEN, INSA Rouen, CNRS, CORIA, 76000 Rouen, France.Abstract
The present work reports soot volume fraction determined in turbulent sooting non-premixed jet flames using a Pegasor particle sensor (PPS) and also using the non-intrusive laser-induced incandescence (LII) technique. Additionally, soot particle size distribution is determined using Scanning Mobility Particle Sizer (SMPS). Turbulent flames with different fuels, namely: butane (Re = 26,000), 70% butane + 30% ethylene by volumes (Re = 20,000), and ethylene (Re = 10,000) are investigated. The axial distribution of PPS derived soot volume fraction is qualitatively in excellent agreement with that obtained using LII. The possible sources of quantitative discrepancy between soot concentration obtained through LII and that of the PPS are discussed. Axial evolution of the soot size along with the volume fraction is presented. These results form part of the proposed comprehensive database to validate advanced soot models.
1. Introduction and Objectives
The soot particles produced during combustion processes poses serious environmental and health risks. Soot deposited on snow surfaces reduces albedo, accelerating glacier melting. Similarly, at higher altitude soot absorbs sunlight which may contribute to global warming. Soot nanoparticles pose risks to respiratory organs. Carcinogenic compounds may get deposited on the soot, which in turn could aggravate health risks. These environmental and health hazards are prompting stringent regulatory particulate emission norms.
To reduce soot emissions, it is necessary to gain further insights into soot formation process to enhance prediction capabilities. Most of the experimental studies in turbulent sooting flames have been performed in fuel-jet/co-flow air configuration. Lee et al. [1] investigated correlation between soot formation processes and flame front (OH). Qamar et al. [2] reports soot volume fraction in a turbulent non-premixed jet flame with a natural gas fuel. Shaddix et al. [3] reports modeling and experimental data in turbulent non-premixed jet flames. The data included: soot volume fraction (LII), OH-PLIF and PAH-PLIF, and large eddy simulations in ethylene and a kerosene-based JP-8 fuel. Köhler et al. [4] reported wide range of parameters in a turbulent non-premixed ethylene jet flame. The database was used to assess numerical simulations [5].
The present work is a sub-task of a consortium project “Advanced Soot Model for Aeronautics and Piston Engines” (ASMAPE) aimed at enhancing soot prediction capabilities. In this context modeling community require experimental database for fuels apart from ethylene for validation of novel models. The proposed database shall quantify soot volume fraction, flame temperature, velocity field, soot particle size, fuel concentration field, flame front, and soot-precursor. The present work is a part of this database, and focuses on the determination of soot
size and volume fractions for ethylene, butane and butane/ethylene mix turbulent flames.
Various techniques have been used in the past to measure soot volume fraction. Among them, Laser-Induced Incandescence (LII) is generally preferred due to its non-intrusive nature, which provides planar and instantaneous description of the soot volume fraction in the flame. In this technique, soot particles are heated well-beyond the flame temperature with an incident laser pulse. The resulted incandescence signal which is proportional to soot volume fraction is imaged. The primary soot particle size can also be deduced based on LII decay rate with an appropriate modelling, however, the particle aggregate size cannot be determined. The methodology and assumptions in LII modelling and calibration are reported in a recent review [6]. In the present work, the soot volume fraction is determined using Pegasor Particle Sensor (PPS), an ex-situ technique mainly used for characterizing particulate emission in Diesel engine. The particle size distributions are determined by Scanning Mobility Particle Sizer (SMPS), which is also an ex-situ technique.
The objectives of the present work is to report the soot size and volume fraction in the target flames of interest to modelers, and to compare the volume fractions determined by aerosol sampling based PPS technique with well-established in-situ LII technique.
2. Experimental methodology and data reduction
2.1 Burner
A jet flame configuration is chosen, as it provides relatively simple axisymmetric configuration. The fuel is injected through a tube of 2 mm inner diameter and 0.5 mm wall thickness throughout the tube length. The fuel tube is surrounded by co-flowing air, which is issued through a square duct of 400 mm width. The co-flow duct also acts as a settling chamber that accommodate flow conditioning devices, which includes honeycomb, glass beads, and
2
screens which reduces flow non-uniformity. The flame is confined up to 750 mm height above burner (HAB). Quartz windows provide optical access for the laser diagnostics. The confined configuration avoids flame perturbations caused by ambient currents.
A square exhaust hood of 750 mm size extracts the combustion gases. The larger exhaust size ensures uniform suction. The whole burner can be translated vertically to allow imaging at different HAB. The flame perturbation due to entrainment of ambient air from the co-flow exit plane (at HAB = 750 mm) is mitigated by a square annular shield curtain of air flow. These precautions allowed stabilization of target flames with high reproducibility, despite of varying distance between exhaust hood and burner. The air and fuel flowrates are controlled with thermal mass flow controllers (Bronkhorst). These thermal flow controllers are independently calibrated using a Coriolis calibration bench, ensuring high accuracy.
2.2 Flame conditions
In this work, n-butane is used as a base fuel since it has a balanced combination of cetane number and sooting tendency as of a fuel of practical interest. The flame conditions are listed under Table 1, where the Reynolds number (Re) is defined based on the tube diameter and bulk jet velocity. Each flame is identified with the mass flow rate and fuel type (e.g.
mb = 0.30 is a butane flame with flow rate of 0.30
g/s). Apart from butane, an ethylene flame is also investigated, for which the Re (10 000) is chosen to mimic an earlier reported flame [4]. Additionally, a mixture of butane/ethylene (mb/e, 70/30 by volume) is used to assess effect of soot-enhancing agent. For the modeling convenience, the velocity of mb/e flame is kept same as of mb = 0.3 flame. The mass flow rate of co-flow air is kept high enough (5 g/s, in all cases) to allow over-ventilated flame condition.
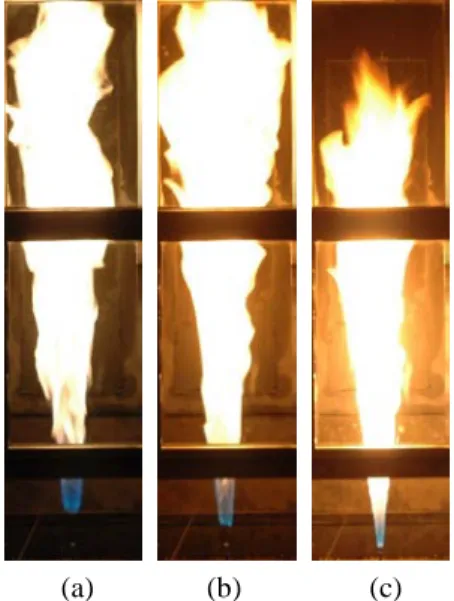
Photographs of the flames listed under Table 1 are shown in Fig. 1. The camera exposure of 1/20 s is set to mimic human eye vision. A low-sooting blue region at the flame base suggests partial air/fuel premixing.
Table 1. Target flame conditions.
No. mf-butn (g/s) mf-ethy (g/s) V (m/s) Re (-) 1 0.30 - 39.0 26 000 2 0.21 0.044 39.0 20 000 3 - 0.166 45.0 10 000
2.3 LII and extinction-based calibration
The fundamental wavelength (1064 nm) of Nd:YAG laser (Quantel, Brilliant) is used to heat soot particles. Infrared wavelength is used to avoid excitation of PAHs florescence. Laser delivers 6 mm beam with 7 ns pulse width, which is converted into light-sheet using a set of cylindrical and spherical
lenses. Only a portion of the light-sheet within fairly uniform intensity (within 70% of the peak) is used. Thus, the effective light-sheet was 90 mm high and 0.2 mm thick. Thickness of the sheet is measured using a beam profiler (DataRay Inc., WinCam). This beam profiler is also used to deduce light-sheet profile. The intensity at the edge (along the height) of light-sheet dropped by 30% relative to peak, which is acceptable, provided that LII is performed in a plateau regime. LII needs to be performed at the optimum fluence (plateau), just before the significant soot sublimation. The fluence was controlled by varying laser energy using a custom made attenuator. Thus, the corresponding fluence along the sheet height was within 0.4 to 0.6 J/cm2 range.
(a) (b) (c)
Fig. 1. Flame photographs, (a) mb = 0.3, (b) mb/e =
70/30, (c) me = 0.166. Exposure = 1/20 s. Images are 645 mm in height.
The LII signal is collected normal to the light-sheet using an ICCD camera (Princeton Instruments, PI-Max RB, resolution: 512 pixel × 512 pixel, 16 bit). The camera was equipped with imaging lens (UV-Nikkor 105 mm), resulting in a spatial resolution of 5.75 pixel/mm. The signal is collected in blue spectrum through a 400 nm filter (FWHM 25 nm). The camera is gated to an effective prompt gate width of 50 ns, which minimizes flame radiation.
LII signal is calibrated using laser-extinction method in butane turbulent flame at HAB = 313 mm. Laser-extinction measurements were also performed in ethylene flame at the same HAB. The calibration constants in butane and ethylene flame were found to be nearly identical. To avoid background flame emissions and low signals, we used a pulsed laser. A small portion of the LII light-sheet (~1.3 mm tall) is used. The pulse intensity is measured using two photodiodes (upstream and downstream of flame). The upstream photodiode is used to account for incident laser energy drift from run-to-run. The intensity with flame (I) and without flame (I0) is
measured using the downstream photodiode. Each of these measurements was averaged over 1000 shots,
3
providing mean transmittance ratio I/I0. The
corresponding soot volume fraction fv is calculated
following Beer-Lambert-Bouguer’s law, as: I/I0 =
exp(–Ke.fv.L/𝜆𝜆), where Ke is a dimensionless
extinction coefficient (= 5.01 at 1064 nm, following [4]), L is optical path length, 𝜆𝜆 is incident wavelength. Since the soot concentration along the path length is not constant in jet flames, only the path integrated soot volume fraction, Fv-int = ∫fv..dL
(ppm.au) can be obtained. Nevertheless, LII calibration constant can be deduced by integrating signal along the same optical path length, as: ∫SLII.dL
(au.mm). Subsequently, the calibration coefficient C (ppm/au) is found as: Fv-int = C.∫SLII dL.
2.4 PPS and SMPS
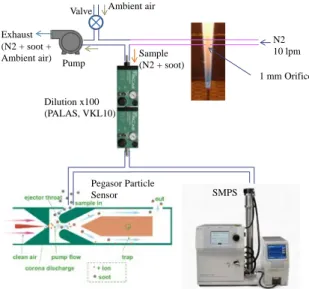
Pegasor particle sensor (PPS) is used to measure soot concentration, whereas scanning mobility particle sizer (SMPS) for soot particle size. Both SMPS and PPS measurements require extraction of an aerosol sample from the flame. Fig. 2 shows the schematic of experimental layout used.
The sample is drawn through a 1 mm orifice drilled in a tube with 4 mm inner diameter and 1 mm wall thickness. A mild vacuum is generated by a pump and controlled by a bypass valve, which draws the sample. The sample is diluted by rapid mixing of nitrogen (N2) that flows through the tube at 10 lpm
rate. Apart from dilution, N2 assists in quenching the
reactions and limiting the soot aggregation. In the absence of pump, flame perturbations caused by injection of N2 were observed. On the other hand, a
stronger suction (without a bypass valve) caused extraction of larger sample, interpreted from mild shortening of flame and excess heating of the probe. Additional, dilution (with air) is achieved using two diluters units (PALAS, VKL 10) connected in tandem, providing an additional dilution factor of 100 which assists in minimizing saturation of SMPS and PPS. The sampling probe generally disturbs the flame through alteration of temperature and upstream flow. Yet, wealth of information can be extracted with fewer assumptions and lesser complexity than that of non-intrusive techniques. In laminar flame such perturbation effects were observed to be within 3 mm ahead of probe [7]. Furthermore, in turbulent flow the flame perturbation effects are expected to be even lower, due to larger flow momentum.
PPS (PPS-M 2000HC PEMS) has been primarily used in the past to measure particulate emission in Diesel engines. PPS provides temporal resolution high enough (100 ms, in this work) to track soot evolution in the flame. In PPS technique particles interact with ionized air produced by a corona discharge (diffusion charging, abbreviated as DC). Subsequently, ions that are not attached to particles are trapped in an ion voltage trap. The exiting charged particles provide estimates of escaping current, which is proportional to soot concentration. Detailed working principle and recent developments in PPS technology can be found in Ref. [8]. Once
escaping current is measured, soot mass concentration can be deduced as Cs = Kpps.Ipps/Qv,
where: Ipps is escaping current in ampere, Qv is
sample flow rate in m3/s (5 lpm), K
pps is a constant
(1.05, based on Diesel soot applications). Soot volume fraction can be deduced, as fv-PPS = Cs/ρsoot,
where: ρsoot is assumed to be 1700 kg/m3. N2 10 lpm Exhaust (N2 + soot + Ambient air) Dilution x100 (PALAS, VKL10) 1 mm Orifice Valve Pump SMPS Pegasor Particle Sensor Ambient air Sample (N2 + soot)
Fig. 2. Schematic of sample extraction layout for
SMPS and PPS measurements.
SMPS is used to determine soot size distribution (TSI, Classifier 3080 + CPC 3010). SMPS counts the particle concentration by sequential selection of classes of electrical mobility diameters over certain range. Such scan is long (3 min for 7-290 nm), and thus this technique is generally used in laminar flames [7, 9]. Nevertheless, for the size range of interest (7-30 nm), the scan duration was short (23 s). The duration for each class scan needs to be long enough to provide statistically stationary description of fluctuating flame, so that the measurement provides temporally averaged quantity. The obtained size distributions are lognormal. In this paper, only geometric mode diameters are reported.
The probing system and dilution level were qualified using well-characterized miniCAST soot (Jing, miniCAST 5200). Soot generated by miniCAST propane (60 mlpm) / air (1.5 lpm) flame is stable and reproducible. The combustion products (including soot) are quenched by nitrogen gas (7 lpm) and diluted with air (20 lpm). SMPS measurements were performed at various N2 flowrates through the
probe, and 10 lpm was found to be enough to avoid soot aggregation in the sampling line. Additionally, PPS measurement showed a remarkable stability in the soot concentration with time, indicating no blockage of orifice for the miniCAST configuration. The dilution ratio (N2/sample) is determined (24:1)
through PPS measurements with the sampling probe and directly without the probe. Recall, the additional sample dilution (×100) of air is used. Thus, the effective dilution ratio is 2400:1 by volume.
4
3. Results and discussion
3.1 Mean LII
Mean soot volume fractions fv (ppm) determined
by LII technique are reported in Fig. 3 for the three targeted flames. These mean fields are determined by averaging 2000 instantaneous LII images for HAB > 225 mm and 1500 images below this HAB. As the flame is confined, certain regions are optically inaccessible. In ethylene flame (me = 0.166), measured axial peak fv is 0.51 ppm, which is in close
agreement with Köhler et al. [4]. Pure butane flame indicates much lower peak fv (0.06 ppm) than
ethylene as expected, since C/H ratio of butane (C4H10) is lower than that of ethylene (C2H4). Also
note that, fv depends on both: fuel type and turbulence
level (residence time, strain, etc.). Addition of 30% ethylene (by volume) increases fv by nearly twice
(0.14 ppm). Recall, that the bulk velocities in butane and butane/ethylene mix are kept constant to isolate flow dependencies (residence time, strain) from fuel type, and also for a modeling convenience.
(a) (b) (c)
Fig. 3. Mean fv (ppm), (a) mb = 0.3, (b) mb/e = 70/30,
(c) me = 0.166.
3.2 Probe characterization in a jet flame
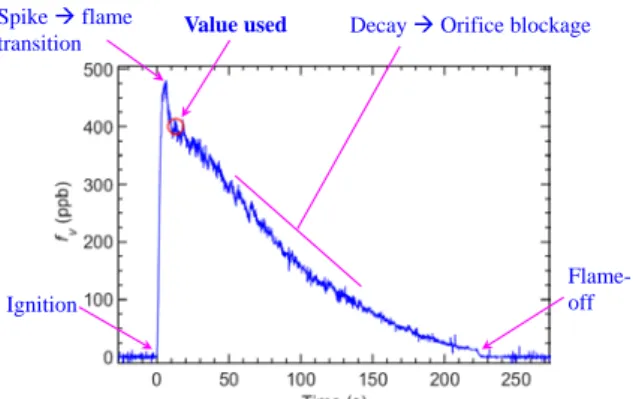
A preliminary test is performed with a butane jet flame (mb = 0.10 g/s). The sample is extracted at r = 0, HAB = 250 mm. Figure 4 shows an evolution of measured soot concentration.
The profile shows initial spike as flame ignites. The peak concentration is associated with the transitional soot volume fraction. Following the peak, measurement shows continuous drop in soot concentration, which originated due to blockage of probe orifice. There exists a distinct post-peak transition marked by circle, which is assumed to be the soot concentration in the flame before any
obstruction of the sampling orifice. This procedure is adapted for all target flames. The blockage of probe orifice is lesser in turbulent butane, and butane/ethylene mix flames due to lower soot concentration.
Value used Spike flame
transition Decay Orifice blockage
Ignition
Flame-off
Fig. 4. Soot volume fraction evolution using PPS
3.3 Soot volume fraction LII vs. PPS
Soot volume fraction measured using LII is referred here as, fv-LII and that of the PPS as fv-PPS.
Axial fv profile is extracted from mean LII image
shown in Fig. 3, along with the corresponding fv-PPS,
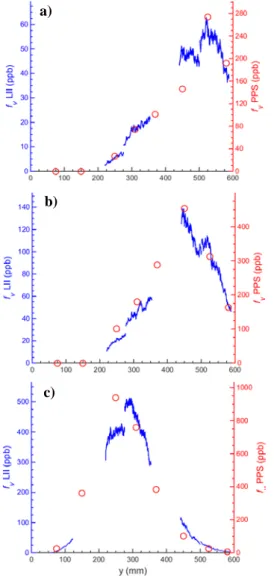
which is measured at 8 heights. Excellent qualitative agreement is observed between LII and PPS (Fig. 5) for the axial distribution of soot volume fraction, whereas the absolute values differ. However, a minute offset is present in ethylene case which may be due to a mild radial misalignment between sampling orifice and LII plane. The PPS trends provide valuable complementary information at the location where LII data is unavailable; however, the values of fv-PPS are not in agreement with fv-LII.
In the analysis, from the LII and PPS profiles, we deduce a ratio: maximum fv-PPS / maximum fv-LII,
irrespective of axial location. These ratios for butane, butane/ethylene mix, and ethylene flames are 4.3, 3.2, and 1.8 respectively. This varying discrepancy warrants a detailed discussion. There are multiple sources of uncertainty: 1) Unlike LII, fv-PPS is
measured only at discrete HABs, thus there is a possibility of missing an actual peak fv. 2) Dilution
ratio has been determined at lower temperature in miniCAST soot, whereas in the jet flame soot samples were extracted at higher and varying temperatures (with HAB), leading to modification of dilution ratio through gas expansion in the probe. 3) Extinction coefficient Ke used in LII calibration is a
function of fuel and soot maturity, whereas Ke is
assumed to be constant across fuels and throughout the flame. This assumption is reasonable, since nearly identical fluence curves and calibration constants were found (not presented here) in ethylene and butane flames 4) PPS calibration constant Kpps and
soot density depend on various parameters. PPS response is sensitive to particle size [10] and soot morphology [11]. Also, PPS has been factory-calibrated to a fixed size distribution (50 nm mode diameter for Diesel soot), which leads to error with
5
deviation from factory reference [8]. Nevertheless, the particle size is very small (Sec. 3.4), indicating a negligible aggregation, and thus errors attributed to soot morphology are less relevant. Moreover, varying particle size does not affect the PPS interpretation. For instance, in mb = 0.3 flame, soot size (Fig. 6.a) varies from 12 to 22 nm over HAB of 250 to 600 mm, yet fv-PPS (Fig. 5.a) is qualitatively in
excellent agreement with fv-LII over entire HAB. In
order to have a quantitative agreement between PPS and LII results, Kpps need to be 0.24 (instead of 1.05
as used here) which seems to be outside the uncertainty range (based on our unpublished data). Although above discussion identifies potential sources of uncertainty in fv-LII and fv-PPS, definitive
conclusion requires targeted investigations.
Fig. 5. Soot volume fraction measured using LII
(line) and PPS (circle), (a) mb = 0.3, (b) mb/e = 70/30, (c) me = 0.166.
3.4 Soot volume fraction and particle size
The SMPS derived, geometric mode soot diameter (Dm) is plotted in Fig. 6 along with fv-LII. We
retain LII derived fv as a reference since encouraging
agreement is found between present fv-LII in ethylene
flame with an independently reported value [4].
Figure 6 shows that the Dm ranges from 10-25
nm (with geometric standard deviation typically from 1.4 to 1.9 nm), suggesting negligible soot aggregation (either in flame or in sampling line), unlike measurements in miniCAST flame (Dm = 105 nm)
with identical sampling configuration.
Fig. 6. Soot volume fraction measured using LII
(line) and soot mode diameter (circles), (a) mb = 0.3, (b) mb/e = 70/30, (c) me = 0.166.
The location of the peak fv is generally associated
to the transition where soot oxidation process begins to dominate the surface growth. As shown in Fig. 6, this location is not systematically correlated with a peak soot size. For instance in butane flame (Fig. 6.a), soot size increases with concentration, and appears to increase beyond peak soot concentration location; however, a definitive conclusion could not be drawn due to limited data points past the peak fv
location. Nevertheless, such conclusion could be drawn from butane/ethylene flame (Fig. 6.b), since the flame is relatively compact, allowing measurements well past the peak fv location. Soot size
appears to peak slightly downstream of the peak fv
location.
Ethylene flame (Fig. 6.c), shows markedly different behavior than other flames. Soot size peaks
a) b) c) a) b) c)
6
well before peak fv location. A second local peak is
observed around y = 450 mm. Such trend has also been reported through simulations in a similar flame [5]. Although, simulated trends are in good agreement with the present data, the predicted [5] peak (axial) mean particle size is nearly twice (64 nm) as of the present peak mean diameter (28 nm). Also, note that in simulations [5], soot particles were assumed to be spherical to save the computational time, whereas in this experimental work we measure mobility diameter of soot which may have been coagulated, although the smaller size suggests otherwise. The assumption of neglecting soot coagulation may affect the numerical predictions. The discrepancy warrants further work on both experiment and simulation fronts. Independent simulations by ASMAPE consortium will provide soot size, and thus will contribute to convergence of database accuracy.
The correlation between soot size and volume fraction is not trivial. Such relationship depends on the particle mobility, aggregation and fragmentation rates, which in turn depend on local temperature, particle number concentration, and concentration of oxidant species.
4. Conclusions
The present work reports soot volume fraction and soot size in the flames of interest to modeling community. fv is deduced using two different
techniques, namely LII, and PPS. Axial peak fv-LII is
measured as 0.06 ppm, 0.14 ppm, and 0.51 ppm in butane, butane/ethylene, and ethylene flames respectively. Trends in fv-LII and fv-PPS are in excellent
agreement. The quantitative discrepancy between
fv-LII and fv-PPS is attributed to various sources:
uncertainty in LII extinction coefficient, uncertainty in sample dilution ratio, limited data points of PPS along the flame height, and PPS calibration uncertainties originated from different calibration reference size, soot morphology and composition.
Soot particle mode diameter along the flame axis lies within 10-25 nm range in different flames. Soot size increases with concentration in butane and butane/ethylene mix flames, and peaks slightly downstream of the peak fv location. In ethylene flame
soot size peaks well upstream of fv location, with
another local peak appearing in the downstream of peak fv location.
The data in butane and butane/ethylene flames is a new addition to the existing literature, and will become a part of the ambitious comprehensive database. Further measurements will be reported (OH-LIF, PAH-LIF, velocity, and mixing field) to complete the proposed database.
Acknowledgements
This project (ASMAPE) was funded by the National Research Agency (ANR) under contract no. ANR-13-TDMO-0002. The authors thank Dr. Gilles
Godard for assistance in laser installation.
References
1. S.Y. Lee, S. Turns, R. Santoro, “Measurements of soot, OH, and PAH concentrations in turbulent ethylene/air jet flames” Combust.
Flame 156 (2009) 2264–2275.
2. N.H. Qamar, Z.T. Alwahabi, Q.N. Chan, G.J. Nathan, D. Roekaerts, K.D. King, “Soot volume fraction in a piloted turbulent jet non-premixed flame of natural gas” Combust. Flame 156 (2009) 1339–1347.
3. C.R. Shaddix, J.Y. Zhang, R.W. Schefer, J. Doom, J.C. Oefelein, S. Kook, L.M. Pickett, H. Wang, “Understanding and predicting soot generation in turbulent non-premixed jet flames” Sandia National Laboratoies (2010) Sandia Report: SAND2010-7178, October 2010.
4. M. Köhler, K.P. Geigle, W. Meier, B.M. Crosland, K.A. Thomson, G.J. Smallwood, “Sooting turbulent jet flame: characterization and quantitative soot measurements” Appl. Phys.
B 104 (2011) 409–425.
5. M. Köhler, K.-P. Geigle, T. Blacha, P. Gerlinger, W. Meier, “Experimental characterization and numerical simulation of a sooting lifted turbulent jet diffusion flame” Combust. Flame 159 (2012) 2620–2635.
6. H.A. Michelsen, C. Schulz, G.J. Smallwood, S. Will, “Laser-induced incandescence: particulate diagnostics for combustion, atmospheric, and industrial applications” Prog. Energy Combust.
Sci. 51 (2015) 2–48.
7. A.D. Abid, N. Heinz, E.D. Tolmachoff, D.J. Phares, C.S. Campbell, H. Wang, “On evolution of particle size distribution functions of incipient soot in premixed ethylene–oxygen–argon flames”, Combust. Flame 154 (2008) 775–788. 8. S. Amanatidis, M.M. Maricq, L. Ntziachristos,
Z. Samaras, “Measuring number, mass, and size of exhaust particles with diffusion chargers: The dual Pegasor Particle Sensor” J. Aerosol Sci 92 (2016) 1–15.
9. C. Gu, H. Lin, J. Camacho, B. Lin, C. Shao, R. Li, H. Gu, B. Guan, Z. Huang, H. Wang, “Particle size distribution of nascent soot in lightly and heavily sooting premixed ethylene flames” Combust. Flame 166 (2016) 177–187. 10. B. Giechaskiel, M. Maricq, L. Ntziachristos, C.
Dardiotis, X. Wang, H. Axmann, A. Bergmann, W Schindler, “Review of motor vehicle particulate emissions sampling and measurement: from smoke and filter mass to particle number”, J. Aerosol Sci. 67 (2014) 48– 86.
11. W.G. Shin, J. Wang, M. Mertler, B. Sachweh, H. Fissan, D.Y.H. Pui, “The effect of particle morphology on unipolar diffusion charging of nanoparticle agglomerates in the transition regime”, J. Aerosol Sci. 41 (2010) 975–986.