OBSERVATIONS AND ANALYSIS
by
0
ROBERT BENNETT SINGERA.B, (Geological Sciences).-, Harvard College (.1973)
SUBMITTED IN PARTIAL FULFILLMENT OF THE REQUIREMENTS FOR THE
DEGREE OF
DOCTOR OF PHILOSOPHY at the
MASSACHUSETTS INSTITUTE OF TECHNOLOGY JANUARY, 1980
Signature of Author...
Certified by..
---Accepted by. _
Department of EartV and PlanAe ary /Sciences, January 24, 1980
-- Thesis Supervisor
Chairman, Departmental Committee Chirman TIFon Graduate Students
THE COMPOSITION OF THE MARTIAN DARK REGIONS: OBSERVATIONS AND ANALYSIS
by
ROBERT BENNETT SINGER
Submitted to the
Department of Earth and Planetary Science on January 24, 1980 in partial fulfillment of the
requirements for the degree of Ph.D.
ABSTRACT
The dark regions on Mars contain the surface materials most likely to resemble unmodified crustal rock, but their compositions have yet to be determined directly. New near-infrared (0.65-2.50pm) telescopic spectrophotometry for dark regions is presented here and interpreted using laboratory studies of iron-bearing mineral mixtures and terrestrial oxidized and unoxidized basalts. Upon closer inspection (by
spacecraft) the telescopic dark regions have been found to consist of large scale intermixtures of
bright soil (aeolian dust) and dark materials. Reflec-tance studies indicate that areal coverage of spec-troscopically observed dark regions by bright mater-ials does not exceed 40%, and is probably more
generally 20 to 30% maximum. The dark materials
themselves consist of an intimate physical association of very fine-grained ferric-oxide-bearing material with relatively high near-infrared reflectance and darker, relatively unoxidized rocks or rock fragments. While these two components could exist finely intermixed in a soil, a number of lines of evidence indicate that the usual occurrence is probably a thin coating
(20 to 30 micrometers thick) of oxidized material physically bound to the rock surfaces. These coating thicknesses are greater than previously thought and should serve to inhibit further gas-solid weathering. With this type of coating geometry the spectral proper-ties ofdark materials are largely independent of grain size, from sand ("l/2mm) to large outcrops. The
oxidized coatings seem likely to be derived by alter-ation of the underlying rocks, although deposition of
genetically unrelated dust is not ruled out. The coated
rocks are dark and generally clinopyroxene bearing.
The shallow band depths and low overall reflectances
indicate that opaque minerals such as magnetite are
mainly augites with varying calcium and iron content. Pigeonite or orthopyroxene may be present but cannot be unambiguously detected in existing data. Low-iron orthopyroxene is particularly difficult to detect
because of interference from ferric-oxide absorptions. Contrary to previous interpretations of other data no spectral indication of olivine or basaltic glass is found. Re-examination of previously interpreted data, in the light of recent studies of mineral-mixture
spectra and dark region spectral behavior beyond 1.1 ym,
also shows no unambiguous evidence for olivine or glass.
Spectral study of terrestrial basalts implies that possibly 5% or at most 10%'modal olivine could be present in observed martian dark materials without
being apparent in existing reflectance spectra. Ultra-mafic (high-olivine) lavas such as suggested for Mars by a number of researchers are not consistent with these interpretations. Mafic igneous rock types, similar to many terrestrial basalts, seem likely to predominate in observed dark regions. Since earlier data does indicate compositional variability, obtaining high quality near-infrared observations for additional dark regions around the planet is an important task for the future.
Thesis supervisor: Thomas B. McCord, Professor of
ACKNOWLEDGEMENTS
Throughout my professional career I will be
indebted to my advisor, Dr. Thomas B. McCord, for the training I have received to conduct science produc-tively in the real world. Tom provided a balance between guidance and freedom, coupled with excellent facilities and opportunities. My interest in Mars was initiated by a project suggested by Tom, and then
allowed to grow freely. One of the advantages of being a student under Tom has been the opportunity to interact with his many colleagues, In this context I have benefited greatly from working with Dr. John B. Adams. John provided valuable suggestions as well as a free exchange of data and laboratory samples throughout my thesis work. I am also grateful to him for introducing me to the many geologic
similarities between Mars and Hawaii. To Dr. Roger G. Burns I owe my theoretical introduction to mineral spectra and my practical introduction to laboratory spectroscopy, which grew into the development of a new instrument. Roger served as my primary contapt at M.I.T. while I worked on my thesis in absentia, and on many occasions helped with bureaucratic as well as scientific matters. Dr, Robert L. Huguenin has also provided valuable discussion and help,
including the use of his laboratory at the University of Massachusetts. One of the liabilities of moving
Bob. Dr. Michael J. Gaffey has been a frequent and well-appreciated source of information concerning both geological and astronomical questions. In addition I have learned much from him concerning
science-related matters such as the writing of papers and proposals. Frequent interaction with Roger N. Clark, Dr. B. Ray Hawke, and Lucy A. McFadden has been valuable to me. I also appreciate discussions and cooperation with Drs. Carle M. Pieters, Larry A. Soderblom, Stanley Zisk, Jim W. Head, Dale P.
Cruikshank, John Sinton, and Michael Garcia. On the Planetary Sciences staff, my thanks go to Karl Hinck, Duncan Chesley, and Rodney Okano for computer-related
support, to Jeff Bosel and Mark Rognstad for help
with instrumentation, to Pam Owensby and D'Na MacLasky for help with data processing, and last but certainly not least to Zeny Cocson and Sam Ostrowski for
keeping things running in spite of people like me. At M.I.T. Debbie Gillette has been of great help with
administrative matters.
My wife Arleen deserves special thanks. It would be pointless to speculate on how my graduate
career might have progressed without her love,
support, and perseverance. This thesis is dedicated to her, with love and appreciation.
TABLE OF CONTENTS
Page
Abstract 2
Acknowledgements 4
Preface 7
I. Mars Surface Composition from Reflectance
Spectroscopy: A Summary 10
II. MARS: Near-Infrared Spectral Reflectance of Surface Regions and Compositional
Implications 59
III. MARS: Large Scale Mixing of Bright and Dark Surface Materials and Implications
for Analysis of Spectral Reflectance 98
IV. Near-Infrared Spectral Reflectance of
Mineral Mixtures: Systematic Combinations of Pyroxenes, Olivine, and Iron Oxides 135
V. The Composition of the Martian Dark Regions, I: Visible and Near-Infrared Spectral Reflectance of Analog Materials and Interpretation of Telescopically
Observed Spectral Shape 187
VI. The Composition of the Martian Dark
Regions, II: Analysis of Telescopically Observed Absorptions in Near-Infrared
I began my graduate studies in the Department of Earth and Planetary Sciences in 1975. During my
residency at M.I.T. I did research with Prof's. Roger G. Burns and Thomas B. McCord. In the spring of 1977 I passed my general examination and left to continue research in absentia with Tom McCord at the University of Hawaii. The move was of course disruptive and
isolated me from the M.I.T. faculty. Overall, however, I feel that it was worthwhile to have spent time at both locations. The resources available through the
Institute for Astronomy and the Hawaii Institute for Geophysics are very good, both in terms of faculty
and research staff and in terms of facilities, inclu-ding Mauna Kea Observatory. In addition, that part of my training as a planetary scientist which has
come from firsthand exposure to the many aspects of Hawaiian volcanism is not insubstantial.
My initial interest when I arrived at M.I.T. was in terrestrial remote sensing. While working for Roger Burns I received my basic training in the theoretical and laboratory measurement aspects of reflectance spectroscopy. After I began work for Tom McCord (still at M.I.T.) I gained experience with reflectance spectroscopy as a tool for remote deter-mination of planetary surface composition. Throughout this period my general knowledge of planetary science
(in contrast to my classical geology undergraduate training) increased.
Sometime after arriving at the University of Hawaii Tom McCord suggested that I take on a project involving multispectral imaging from Viking. This was my intro-duction to Mars. While little of this work is included
in this thesis I am still involved with an outgrowth of the original project. My interest in Mars grew
concurrently with the design and construction of a spectrogoniometer system for our laboratory, largely conducted by myself and described in Chapter IV. Tom McCord and John Adams (University of Washington) jointly suggested that the composition of the martian dark
regions was a topic in need of both telescopic and
laboratory study, and that I might consider this for my thesis. I am indebted to Tom and John for the
original suggestion and for many follow-up discussions. As my work progressed I became increasingly involved with basalts and their alteration products. I can
foresee coming full-circle, back to using remote sensing as a tool for investigating planetary science problems on Earth.
This thesis was prepared in the form of six papers also intended for publication. Two have been published already (Chapters I and III) and three others have been submitted as of this writing (Chapters IV, V, and VI). I
an efficient way to conduct and report various free-standing segments of a scientific research program. A disadvantage of this thesis format is that some introductory and descriptive material is of necessity repeated. Chapter I is a review paper and serves as an introduction to Mars science from reflectance
spectroscopy, The reader may wish to only skim the introductory material in subsequent chapters, although each paper does have a somewhat different emphasis.
CHAPTER I
Mars Surface Composition From Reflectance Spectroscopy: A Summary
This paper has been published in J. Geophys. Res., 84, 8415-8426, 1979. Authors: R.B. Singer, T.B. McCord, R.N. Clark, J.B. Adams, and R.L. Huguenin.
Visible and near-infrared (0.3 - 2.6 ym) reflectance spectra of the martian surface have been obtained
primarily from earth-based telescopic observations, and multispectral images have been obtained both from space-craft and earth-based observations. Observations in this wavelength region have confirmed the bimodal albedo
distribution of surface materials, first observed visually. All spectra of Mars are characterized by strong Fe3+ absorptions from the near-UV to about 0.75 ym. Darker regions show this effect to a lesser
degree, and are interpreted to be less oxidized materials.
In addition, dark areas have Fe 2+ absorptions near
1.0 ym, attributed primarily to olivines and pyroxenes. There is evidence at infrared wavelengths for highly dessicated mineral hydrates and for H20-ice and/or
adsorbed H20. Observations of the north polar cap show a strong H20-ice spectral signature but no spectral evidence for CO 2-ice, while only C02-ice has been identified in spectra of the south polar cap. While the brightest materials on Mars are widespread and correlate with aeolian dust, darker materials show greater mineralogic variability and are thought to be closer in petrology and physical location to their parent rock. At present the best model for the dark materials is somewhat oxidized basaltic or ultramafic
rock, regionally variable in composition and details of oxidation. The bright materials appear to be finer-grained assemblages of primarily highly oxygen-sharing dessicated mineral hydrate, some ferric oxides, and other less major constituents, including a small amount of relatively unaltered mafic material. The bright materials seem likely to be primary and/or secondary
alteration products of the'basaltic or ultramafic dark materials.
INTRODUCTION
To understand the current state and the geologic evolution of Mars it is necessary to characterize
surface materials in terms of composition and mineralogy and to define the distribution of these materials around the planet. Remote sensing techniques will continue to be necessary to derive this information on regional and global scales, even if an Apollo- or Luna-type sampling program is carried out (Head et al., 1978).
The primary compositional remote sensing techniques so far applied to Mars are visible and near-infrared reflectance spectroscopy and multispectral mapping
(emission spectra of dust clouds have yielded some
important compositional information about airborne dust). Multispectral mapping has been done on a global scale
from Viking images (Soderblom et al., 1978) and on a very detailed scale at the Viking landing sites (e.g., Evans and Adams, 1979; Guinness et al., 1980; Strickland,
1979). Low spectral resolution reflectance spectra have been generated from Viking lander images for some
materials surrounding the spacecraft (Huck et al., 1977). Most of the reflectance spectra and some of the
multi-spectral images have been obtained using earth-based telescopes. Earth-based observations will be the
primary source of new data, at least until the Galileo spacecraft passes Mars in 1984 en route to Jupiter,
and perhaps until the next Mars mission, hopefully by the late 1980's. Other remote sensing techniques, such as X-ray spectroscopy and X-ray fluorescence, are
dependent on future spacecraft missions.
It is the purpose of this paper to discuss available reflectance spectra (primarily telescopic) and multi-spectral maps, including some new data, and their
interpretations. Ongoing analysis and laboratory studies will be reviewed as well as prospects for the future.
OBSERVATIONS Earth-Based Observations
McCord and Adams (1969) reviewed available reflec-tance data prior to that date. The bulk of the measure-ments were integral disk and in the spectral range from 0.3 to 1.2 ym. Agreement among the data sets is good, and the basic shape of the reflectance curve is well defined.
During the 1969 apparition (Ls = 162* - 163*), McCord and Westphal (1971) observed seven regions on the surface, approximately 200 km in diameter: five from 0.3 to 1.1 ym (24 filters) and two from 0.3 to 2.5 ym (52 filters). At the same time, Binder and Jones (1972) observed a much larger number of 300- to
500-km-diameter areas from 0.6 to 2.3 ym, but with only 10 filters. Binder and Jones were able to develop good statistics on the Martian albedo distribution, but the spectral resolution is too low for much compositional analysis. In addition, the spectral slopes in the infrared do not agree with more recent observations; this may be due to the standard star calibration problems Binder and Jones described.
During the 1973 apparition (Ls = 301* - 302*), McCord et al. (1977a) observed 26 areas on the surface of Mars, using 25 filters covering the wavelength
16
multispectral images were taken through 20 filters in the same spectral region (McCord et al., 1977b) using a silicon diode vidicon system. These observations occurred during a dust storm originating in Solis Lacus and include some spectra and spectral images of optically thick dust clouds. In 1976, McCord et al. (1978)
obtained the first high-precision, 1 % spectral resolu-tion data from 0.6 to 2.6 pm for the integral disk of Mars (Ls = 58*), using a circularly variable filter
(CVF) and an indium antimonide detector. During the 1978 apparition (Ls = 480 - 50*), an improved version of this instrument was used to obtain spectra- of 11 regions, 1000-2000 km in diameter, from 0.6 to 2.5 pm
(McCord et al., 1980). The relatively large size of these areas was due in part to the unfavorable appari-tion. With further improvements in instrumentation and
increasingly favorable oppositions much smaller regions can be observed in the future.
Figure 1 is a map of area locations for data taken by McCord et al. in 1969, 1973, and 1978. Locations of dust cloud spectra, or spectra of areas partially
obscured by dust clouds, are not shown on this map. An additional spectrum, 78-11, was taken of the north polar cap.
Spacecraft Observations
Spectral reflectance observations from spacecraft consist mainly of multispectral images from Viking orbiters and landers. Soderblom et al. (1978) have prepared three-color photometric maps for a large portion of the planet between latitudes 30*N and 60*S
from VO II approach images (Ls = 1050). These have good spatial resolution (10-20 km) but limited spectral coverage and resolution (three broad bands: 0.45 ±
0.03 -ym, 0.53 ± 0.05 pm, and 0.59 ± 0.05 pm). Soderblom and others are preparing additional multispectral maps using Viking orbital images of selected regions and at higher spatial resolution (L.A. Soderblom, personal communication). Viking lander cameras are capable of taking images in six spectral bandpasses from 0.4 to 1.0 pm. Huck et al. (1977) developed a technique for transforming these six brightness values into an
estimate of spectral reflectance. These data are being used successfully for determining color differences and properties of the surface at the two landing sites
(Evans and Adams, 1979; Strickland, 1979). As with orbital data, repeat coverage is available throughout a martian year, permitting monitoring of variations in
surface optical properties (Guinness et al., 1979). The Viking infrared thermal mapper (IRTM) includes the visible and near infrared in one of its six
bandpasses. Kieffer et al. (1977) used this instrument to generate a global map of bolometric normal albedo from latitudes 30*N to 300S for LS = 124* - 129*. A histogram presented with the map demonstrates a distinct bimodal albedo distribution. Farmer et al. (1977)
combined the continuum bandpasses in the Mars atmospheric water detector (MAWD) to generate a narrow bandpass
global map of surface brightness at 1.4 ym for VO I and VO II. Combined coverage extends from latitudes 650N to 500S. Both these maps and the IRTM albedo map agree rather well with earth-based observations of bright and dark markings.
Mariner 9 carried an ultraviolet spectrometer (UVS) and a thermal infrared interferometric spectrometer
(IRIS). UVS observations were almost entirely dominated by light scattered from atmospheric dust particles
(Barth et al., 1972). The IRIS produced emission spectra from 5 to 50 ym of dust clouds and many areas on the
surface (Hanel et al., 1972). Mariner 6 and 7 each carried an infrared spectrometer (IRS) covering the spectral region from 1.9 to 14.4 ym. The instrument
and some results are described by Pimentel et al., (1974). Comparison of Viking and Earth-based Observations
The agreement between Viking orbiter and lander multispectral observations and earth-based reflectance
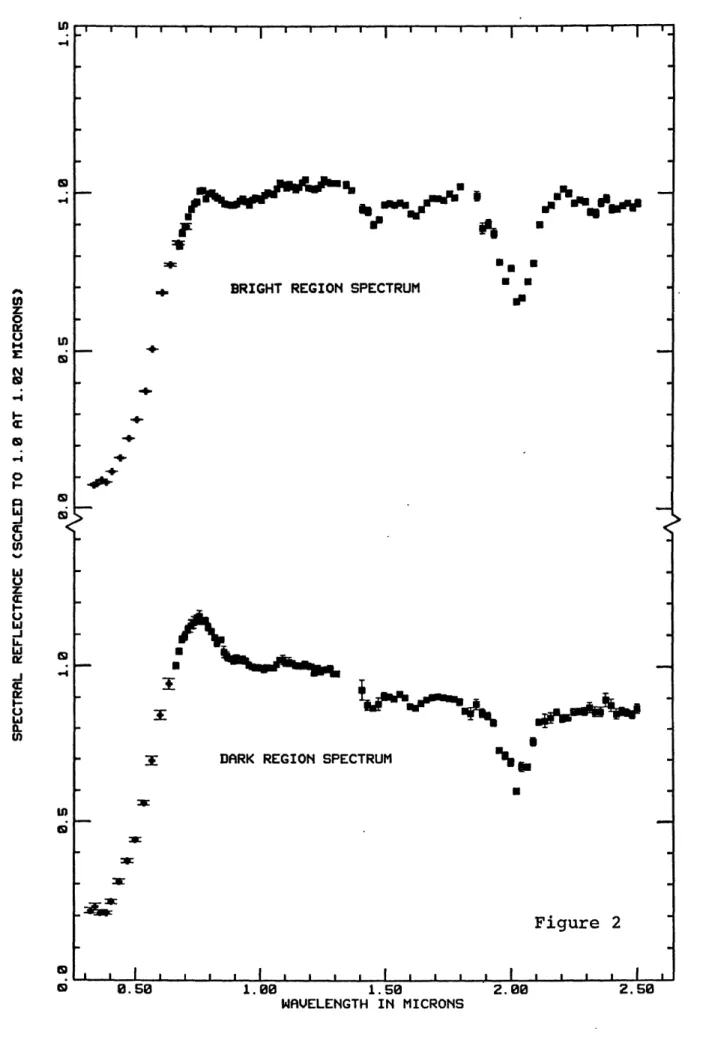
Orbiter II and earth-based reflectance data for a few regions on Mars is shown in Figure 2 (Singer and McCord, 1980). All spectra have been scaled to a value of 1.0 at 0.56 ym. These and other VO II approach data have a tendency to be slightly less 'red' than corresponding earth-based observations, that is, the slope from 0.45
to 0.59 ym is lower. The Viking images were taken during a martian season (Ls = 105*) characterized by white condensates (presumably water ice) at certain
locations (Smith and Smith, 1972). Soderblom et al. (1978) demarcated areas where they felt that clouds and frost significantly obscured the surface; it is possible that smaller amounts of condensate over much of the
rest of the planet could account for the observed differences in spectrum slope.
Comparison between Viking lander and earth-based observations are less straightforward because telescopic
spectra do not yet exist for the exact landing sites and because the lander cameras view the surface on a much more detailed scale. Soil color at both lander sites agrees closely with telescopic reflectance data for bright regions, and spectral reflectance estimates from 0.4 to 1.0 pm are very similar to telescopic
spectra (Huck et al., 1977). More detailed studies of spectral comparisons are currently being performed.
20
SPECTRAL REFLECTANCE PROPERTIES OF MARTIAN SURFACE MATERIALS
To a visual observer, Mars shows a generally bimodal albedo distribution: bright and dark, with some areas of intermediate albedo. This has been
confirmed as a general relatioiship in the visible and near-infrared by earth-based telescopic observations
(e.g. Binder and Jones, 1972) and spacecraft observations (e.g. Farmer et al., 1977; Kieffer et al., 1977).
Measurements of bright area to dark area albedo ratios vary from a low of about 1.8 to a high near 3.0 (McCord and Westphal, 1971; Binder and Jones, 1972).
Super-imposed on these overall albedo differences are more subtle but very important spectral variations.
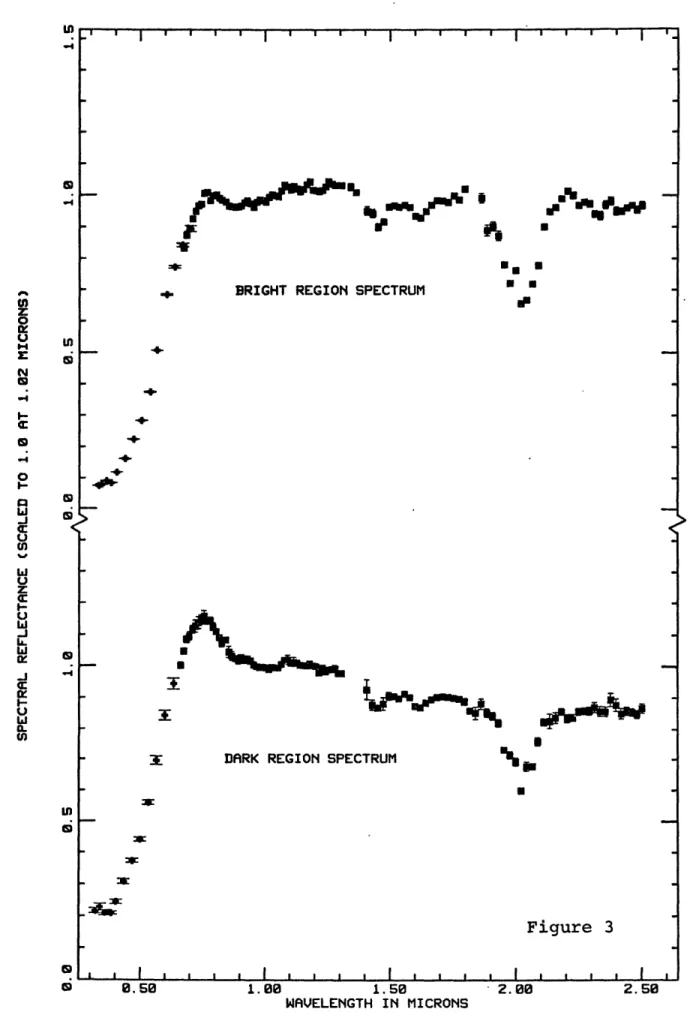
A composite average spectrum of several typical bright areas is shown at the top of Figure 3, scaled to unity at 1.02 pm (McCord et al., 1977a, 1980). Bright area spectra are characterized by strong Fe3+ absorptions from the UV to 0.75 pm with a slope change at about
0.6 pm and a weaker Fe3+ absorption near 0.87 pm. These features are attributed to a ferric oxide content of about 6-8 wt. % (Huguenin et al., 1977). Frdm the band minimum near 0.87 pm to about 1.3 pm the spectrum slopes upwards. Between 1.4 and 1.7 pm there is a broad
absorption which has been interpreted as H20 in a
most noticeably at 1.45 and 1.62 ym. From 1.8 to 2.2 ym the spectrum is dominated by a deep Mars atmospheric Co2 absorption. Removal of a model CO2 atmosphere
(McCord et al., 1978) yields a fairly flat spectrum from 1.7 to 2.5 ym, with the possibility of an additional H20 absorption near 1.9 ym (McCord et al., 1980)
Dark area spectra are substantially different from bright area spectra. The bottom of Figure 3 shows a composite spectrum of visible and infrared data in
Iapygia (69-6 and 78-10), also scaled to unity at 1.02 ym (McCord and Westphal, 1971; McCord et al., 1980). The slope from UV to red is reduced compared with that for bright region spectra; the absorption near 0.87 ym is also weaker. These two features indicate a lower Fe3+ content (Adams and McCord, 1969; Huguenin et al., 1977; -McCord et al., 1977a). In addition, dark area spectra
show Fe2+ absorptions around 1.0 ym. These vary with location on the planet and are thought to represent differences in mafic mineralogy, mostly pyroxenes and olivines (Adams and McCord, 1969; Huguenin et al., 1977;
McCord et al., 1977a; Singer, 1980b). In contrast to the bright area spectra, dark area spectra have a
distinctive peak near 0.75 ym and slope fairly uniformly downwards from 1.1 to 2.5 ym (after martian atmospheric CO2 effects are removed) (McCord et al., 1980).
22
Reflectance spectra from 0.3 to 1.1 Um of dust clouds are very similar to the spectra of the brightest
regions on Mars, which appear fairly uniform. This correlates with other evidence that the source for the brightest surface material is rather homogeneous
aeolian dust (McCord et al., 1977a). As discussed above, dark area spectra show less uniformity and indicate less oxidized (weathered) material, so they may represent compositionally varied materials closer in optical properties, 'petrology, and physical location to their parent rocks.
Based on the likelihood that many spectroscopically observed dark areas have partial coverage by streaks and
splotches of bright material, Singer and McCord (1979) have applied a simple additive or checkerboard model to investigate the effects of bright spectrum contamination of dark region observations. In this two-component
model the observed spectrum is the average, weighted for relative areal coverage, of the spectra of bright and dark surface types. It was assumed that the bright streaks have the same spectral characteristics as observed bright regions and dust clouds and that the observed
dark area spectra are actually mixtures of bright and dark spectral components. The spectral influence of varying amounts of bright material is then algebraically
size of bright and dark patches is much greater than the mean optical path length in those materials. This
assumption is felt to be valid for much of the martian surface.
The results of an analysis for a dark area spectrum using an additive model as described above is shown in Figure 4. Spectral coverage is essentially complete from 0.3 to 2.5 ym and represents a composite of two data sets (McCord and Westphal, 1971; McCord et al., 1980). A model Mars atmosphere (Kieffer, 1968) was used to remove martian C02 absorptions in the infrared. The top curve, labelled 'Bright,' is the average of a number of typical bright region spectra. The next lower curve, labelled 'Dark.' is the observed spectrum for the telescopic dark region Iapygia. The curves below this show the results of the analysis described above for removal of the influence of 10%, 20%, 30%, and 40% areal coverage by bright material. With removal of increasing amounts of the bright material spectrum the
'dark material' spectra show reduced UV absorption and less indication of an absorption near.0.87 ym. This is consistent with a lower Fe3+ content in the dark
material. In addition, the Fe2
+ absorption near 1 pm becomes more apparent, and the peak reflectance shifts
24
material effects corresponding to greater than about 40% areal coverage results in an unrealistically low
albedo dark material spectrum; this places an approximate upper limit for coverage for dark regions by bright
material. A 20%-30% contamination by bright material seems to be a reasonable estimate for a 'typical' dark region; better estimates for specific regions could be obtained using high-resolution Viking images processed to maintain albedo information.
There is some telescopic evidence for spectral variation of high albedo areas with location and/or time. Huguenin et al., (1977) have attributed some of the spectral difference between bright regions and airborne dust to changes in the degree of hydration of the dust, which they suggest becomes dessicated, possibly by UV radiation, after it has been exposed. The bright areas observed in 1969 (McCord and Westphal, 1971) such as 69-1 in Arabia have similarities to those observed in
1973 (McCord et al., 1977a) such as 73-1 and 73-2, but the 69-1 spectrum has a slightly less intense absorption
in the blue UV, and the weak Fe3+ band near 0.87 pm is
not apparent. Instead, a weak band is present near 0.95 ym, a wavelength more characteristic of Fe2+
mineralogy. The interpretation is that Arabia, at least in 1969, showed an incomplete masking of a ferrosilicate surface component by a bright surface component having
a considerably higher ferric oxide content (Huguenin et al., 1977).
26
COMPOSITIONAL INTERPRETATION OF SPECTRAL OBSERVATIONS
Ferric Oxide
Because of the visual red color and the polarization properties of Mars, ferric oxides have long been consid-ered likely candidates for surface materials (e.g. Wildt, 1934; Dollfus, 1957; Sharonov, 1961; Draper et al., 1964; Sagan et al., 1965; Binder and Cruikshank, 1966; Younkin, 1966). At wavelengths greater than about 1 pm, however, all Mars spectra, especially for dark regions, deviate substantially from the spectra of pure iron oxides. Huguenin et al. (1977) have interpreted bright region spectra to indicate soils with about 6-8 wt. % ferric oxide. The major absorption edge which dominates the visible spectrum arises from a pair of. 02- - Fe3+
charge transfer bands centered near 0.34 and 0.40 pm. Slope changes near 0.6 pm are due to Fes+ interelectronic transitions. Another absorption band occurs centered at 0.84-0.89 pm, depending on the type of ferric oxide, and is also due to an interelectronic transition in
Fes+. The details of ferric oxide absorptions depend on the crystal structure and the degree of hydrbxylation. It is felt that telescopic spectra are consistent with dessicated goethite as the dominant ferric oxide species
(Anderson and Huguenin, 1977).
Because the three Viking orbiter bandpasses fall on intense Fe3+ absorptions, multispectral maps
ferric oxide mineralogy and content. Soderblom et al. (1978) have identified a number of regional units of uniform color. The highest albedo surface unit
(excluding condensates) is rather 'red' and correlates with aeolian dust. (For Viking orbiter observations the term 'red' is used to mean a high reflectance in the 0.59-ym bandpass relative to the 0.45-ym bandpass. This definition is usually, but not always, in concur-rence with colors perceived by the eye.) A somewhat
less red and less bright soil unit is observed to be stratigraphically lower, a relationship also observed at the Viking Lander I site. Significant color differ-ences are also seen by Viking orbiter in the dark
regions; in fact, both the reddest and least red geologic units observed are low in albedo.
A photostimulated oxidation mechanism has been demonstrated for magnetite, olivine, and basaltic glass which could occur at realistic rates in the present martian environment (Huguenin, 1973a, b, 1974). This permits extensive weathering of Fe2+ bearing minerals to ferric oxides, other transition metal oxides,
hydrated clay minerals, and carbonates. Hydrothermal alteration of mafic or ultramafic materials, associated with volcanic activity, could also be a source for
28
caused by volcanic eruption in the presence of water-ice, has been suggested as an alteration mechanism to produce
iron-rich clays on Mars (Toulmin et al., 1977; Soderblom and Wenner, 1978).
Mafic and Ultramafic Materials
Adams and McCord (1969) successfully modeled both bright and dark area spectra from 0.4 to 1.1 ym using an olivine basalt with different degrees of oxidation
(Figure 5). An acid solution was used to induce oxida-tion of the basalt; analysis showed that magnetite was the only mineral phase affected but that the weathering product, limonite, precipitated as a partial coating over other mineral grains. This laboratory modeling reproduces well the characteristics of spectra than available but does not address the spectrum beyond 1.1 ym nor does it fully explain some details seen in more recent spectroscopy of Mars. Updated laboratory modeling (Singer, 1980a) has concluded that a thin Fe3+ rich layer coating a dark substrate can properly
reproduce the characteristic shape of dark region spectra from 0.3 to 2.6 pm without fully masking
infrared absorptions in the substrate. In the visible, Fe3+ absorptions dominate the spectrum and account for the rise in reflectance to the spectrum peak near
0.75 ym. The long-wavelength side of this peak is defined by the 0.84- to 0.89-ym ferric oxide band and
by the continuing decrease in infrared reflectance as the thin ferric-oxide layer becomes increasingly trans-parent to longer wavelengths. At some wavelength the spectrum will theoretically converge with that of the dark substrate. Diagnostic Fe2+ absorptions near 1 pm in such mafic minerals as pyroxenes and olivines are reduced in spectral contrast and somewhat modified but do persist in the spectrum. These conclusions are taken as confirmation and extension of the work by Adams and McCord (1969) and Huguenin (1973a).
Telescopic spectra of martian dark areas that were measured during the 1969 and 1973 (McCord and Westphal,
1971; McCord et al., 1977a) and spectra derived from 1973 telescopic multispectral images (McCord et al., 1977b) have been interpreted by Huguenin et al. (1977, 1978). Each spectrum showed a different composite of absorption bands in the 0.7- to 1.1-pm wavelength
region. (A study by Singer and McCord [1979) has shown that the variation seen in these absorptions can not merely be due to variable mixing of bright dust and a single dark material.) While a few of the constituent band positions could be determined directly from the spectra, most band positions were derived by additional data processing. The principal technique used was
relative reflectance spectroscopy: all spectra were divided by the spectrum of a standard area, which
emphasizes relative differences in absorptions. Recog-nizing the relatively large uncertainties in the band positions derived by this ratio technique and noting
the restricted wavelength range and resolution, tentative mineral identifications were made according to the
interpretation scheme outlined by Adams (1975). Most of the interpretations by Huguenin et al.
(1977, 1978) were for dark areas within the Margaritifer S. and Coprates quadrangles (longitudes 0*-90* and latitudes 0*-30*S). The spectra were used for deriving the average mineralogies of dark areas within the
quadrangles, and spedtrophotometric images used in an attempt to define the spatial extent of the mineralogic units. Nine dark area units were defined, but the
average mineralogies for only six of the units were characterized due to band masking by contaminant dust. The spectra showed features that were attributed to
mixtures of orthopyroxene (or pigeonite) + clinopyroxenes
+ olivine (or glass). The relative strengths of the features attributed to these minerals varied from unit to unit, and this was interpreted to indicate possible variations in their relative proportions. Most of the units were interpreted to be olivine-rich, and one of the units in central Erythraeum M. was proposed to
contain a titaniferous clinopyroxene based on apparent absorption features at 0.6-0.77 ym (attributed to Fe2+ +
1.00 ym (attributed to an Fe 2+ interelectronic
transi-tion in augite-diopside).
Huguenin et al. (1978) further noted several correlations between their 'petrologic' (mineralogic) units and geologic and albedo units. The lower albedo units, for example, were interpreted to have relatively more clinopyroxene + olivine (or glass) and less ortho-pyroxene (or pigeonite) than the higher albedo units. One petrologic unit in western Erythraeum M. corresponded closely in location with a cratered plains unit in the Coprates Quandrangle. In addition, chaos and- channeled terrain appeared to occur preferentially in the areas characterized by low orthopyroxene/clinopyroxene + olivine (or glass) ratios.
Other dark area interpretations were proposed by Huguenin et al. (1977). The spectrum of an area in Mare Acidalium, for example, showed a unique complex of absorption features between 0.7 and 1.1 pm that is very
similar to the spectra of iron-rich calcic pyroxenes discussed by Adams (1975). The higher spectral resolu-tion data now available (McCord et al., 1980) and
obtained in the future will allow more positive identi-fication of mineralogy and mineralogic variations
(e.g. Singer, 1980b).
Interpretations of reflectance spectra for dark regions on Mars indicate a basaltic or ultramafic source
rock. This is consistent with independent proposals by Maderazzo and Huguenin (1977) and McGetchin and Smyth
(1978) that martian crustal rocks may be derived from iron-rich ultramafic primary lavas.
Water
Water was first discovered on Mars by Sinton (1967), who observed the strong absorption near 3 pm. This band was further defined by Beer et al. (1971) and Houck
et al. (1973). Pimentel et al. (1974) found evidence for at least small amounts of water in or on the surface using the Mariner 6 and 7 IRS instruments in the 3-ym region. An analysis of an integral disc spectrum of Mars by McCord et al. (1978) also shows absorptions in the 1.4- to 2.0-ym region that were attributed to water in the form of ice plus a highly dessicated mineral hydrate. New data and analysis (McCord et al., 1980) have shown additional evidence for a mineral hydrate and/or solid H20.
All martian IR spectra observed so far show a drop in reflectance from 1.3 to 1.4 ym, independent of Mars atmospheric CO2 absorptions. This effect is.gr'eater
for bright areas than for dark areas. In order to understand the reason for this drop, Clark (1980) and McCord et al. (1980) approximated the reflectance of Mars with spectra typical of basalts and their oxidation
with a spectrum typical of thin oxidized layer over basaltic material (as discussed above). These spectra were scaled in the same manner as the telescopic spectra and have a smooth reflectance beyond 1.1 pm. To these spectra, an ice spectrum was algebraically added in
small amounts to match the apparent 1.4-pm drop observed in the martian spectra. The ratio of the martian spectra to the simulated spectra shows absorption features which correlate with the expected martian atmospheric CO2
bands (Figure 6a and 6b). The simulations fit the bright area spectra better than the dark spectra and indicate that the relative band intensities are weaker and
different for dark areas than bright areas. The results show that the water is present in the martian surface in different forms (e.g., frost or ice sheets on the surface, ice mixed in the regolith, or bound). Clark
(1980) has shown that bound water bands which typically occur at 1.4 and 1.9 pm do not shift appreciably (' 100
E)
with temperatures from 300* to 150*K and that bound water can be spectrally distinguished from free ice. Thesimulation of martian spectra described above shows that free water ice is the primary cause of the 1.3- to
1.4-pm drop in reflectance and that there is more water in the bright areas than in the dark areas. The physical details of this ice/regolith combination have yet to be
determined and may be difficult to determine with the existing data. There is some evidence for bound water in the martian surface at 1.4 and 1.9 ym, but these are difficult regions to observe from the earth because of uncertainties in telluric water removal and the strong 2-ym martian CO2 atmospheric absorption.
A spectrum of the north polar cap of Mars (McCord et al., 1980), taken in the northern spring (Ls = 50*) with extent of the cap to about 60*N, shows very strong water-ice bands. Clark and McCord (1980) have success-fully modeled this spectrum by assuming that 60% of the light is reflected by water ice and 40% of the light is reflected by grey material (same reflectance at all wavelengths) (Figure 7). The actual amount of water present is difficult to determine because of the
variation in grain size and/or hydration state. There is good evidence that there was not polar hood or clouds present at the time of this observation (James et al., 1979, also personal communication, 1978). A spectrum of the south polar cap taken by Larson and Fink (1972) with a fourier spectrometer (1.2-2.8 ym) shows 11
narrow absorptions, which they identified as solid CO2. No water could be identified in this spectrum, at least in part because of discontinuities in the spectral
Composition of Martian Dust
Most of the compositional information currently available for martian dust comes from analysis of Mariner 9 IRIS observations of dust suspended in the atmosphere. While this is not reflectance data, a short discussion is included here for completeness. Hanel et al. (1972) concluded from infrared features that the primary constituent of the dust has an SiO2 content of 55-65%, consistent with a rather acidic rock or mineral composition. It was argued by Hunt et al.
(1973) that certain other infrared features expected for acidic materials are not present. From comparisons of the IRIS data to infrared transmittance of terrestrial materials, they concluded that a montmorillonite-type clay provided the best match to the reststrahlen band near 9 pm. Aronson and Emslie (1975) have shown that there are several other minerals which could also
produce the 9-ym feature, including some feldspars and micas. Like montmorillonite, these minerals are strongly Si-O bond sharing. Toon et al. (1977) concluded that the 9 ym feature could not be accounted for by pure
montmorillonite. They suggest that the observed feature is dominated by acidic or intermediate igneous silicates and/or clays, but could also include a significant
component of lower SiO2 material such as basalt. Additional results are that limonite, carbonates,
nitrates, and carbon suboxide are excluded as major (greater than 5 or 10%) constituents of the airborne dust (Hunt et al., 1973; Toon et al., 1977).
Earth-based reflectance spectra of optically thick dust clouds have been shown to be very similar to
spectra of uniform bright regions on the surface (McCord et al., 1977a). This material has been interpreted as
6-8 wt. % ferric oxide, with the remaining bulk largely composed of an Fe2+-poor dessicated mineral hydrate, possibly a clay mineral (Huguenin et al., 1977).
Huguenin et al. (1977) also suggested that the airborne dust might be less dessicated than apparently similar materials on the surface. Newer infrared reflectance spectra of bright surface materials on Mars (McCord et al., 1978, 1980) are consistent with the presence of dessicated mineral hydrates and are actively under
study. At this point, however, a positive mineral
identification is not possible for this rather spectrally neutral (in the visible and near-infrared) strongly
Earth-based spectrophotometric observations of Mars will continue to be important as a major and perhaps the only source of new compositional information through the next decade. Oppositions, approximately every 26 months, will become increasingly favorable through 1988 as the
angular size of Mars as seen from the earth increases. If appropriate instrumentation is available, worthwhile observations can be made with the space telescope.
Interpretation of existing data is of course a continuing process. Several groups are involved in laboratory
studies aimed at better understanding the materials and processes on Mars. Results of these programs are helpful
in planning future observations, both from the earth and from spacecraft.
We strongly emphasize the need for high spectral resolution mapping of a significant fraction of the martian surface in the visible and near-infrared from a spacecraft. The first opportunity for data of this type is when the Galileo Near Infrared Mapping Spectro-meter (NIMS) flies by en route to Jupiter. Up to one
third of the martian surface could be mapped with high spectral quality at spatial resolution better than that possible from the earth. Full coverage at far better resolution would be possible as part of an orbital science package on the next Mars mission, hopefully by
38
the late 1980's. This type of global study is necessary to expand on and place in context results from local exploration or sample return.
ACKNOWLEDGEMENTS
This work was supported by NASA grants NSG 7312 and NSG 7590. We are grateful to Laurence A. Soderblom for his helpful review. Contribution number 233 of the Planetary Sciences Laboratory.
REFERENCES
Adams, J. B., Interpretation of visible and
near-infrared diffuse reflectance spectra of pyroxenes and other rock forming minerals, in Infrared and Raman Spectroscopy of Lunar and Terrestrial Minerals, edited by C. Karr, Jr., pp. 91-116, Academic, 1975. Adams, J. B., and T. B. McCord, Mars: Interpretation of spectral reflectivity of light and dark regions, J. Geophys. Res., 74, 4851-4856, 1969.
Anderson, K. L., and R. L. Huguenin, Photodehydration of martian dust (abstract), Bull. Amer. Astron. Soc.,
9, 449, 1977.
Aronson, J. R., and A. G. Emslie, Composition of the martian dust as derived by infrared spectroscopy
from Mariner 9, J. Geophys. Res., 80,4925-4931, 1975. Barth, C. A., C. W. Hord, A. I. Steward, A. L. Lane,
Mariner 9 ultraviolet spectrometer experiment: Initial results, Science, 175, 309-312, 1972.
Beer, R., R. H. Norton, J. V. Martonchik, Astronomical infrared spectroscopy with a Connes-type interfero-meter: II, Mars, 2500-3500 cm-1 , Icarus, 15, 1-10, 1971.
Binder, A. B., and D. P. Cruikshank, Lithological and Mineralogical investigation of the surface of Mars, Icarus, 5, 521-525, 1966.
studies of the photometric function, composition, and distribution of the surface materials of Mars, J. Geophys. Res., 77, 3005-3019, 1972.
Clark, R. N., The spectral reflectance of water-mineral mixtures at low temperatures, submitted to J. Geophys. Res., 1980.
Clark, R. N., Mars: Water-ice features in near infrared spectra of small areas (abstract), Proc. Amer. Astron. Soc.,10, 567, 1978.
Clark, R. N., and T. B. McCord, Mars Residual North Polar Cap: Earth-based spectroscopic confirmation of water ice as a major constituent and Evidence for hydrated minerals, submitted to J. Geophys. Res., 1980.
Dollfus, A., Propridt6s photomdtrique des contrdes ddsertique sur la plandte Mars, Comptes Rendus, 244,
162-164, 1957.
Draper, A. L., J. A. Adamcik, and E. K. Gibson, Compari-son of the spectra of Mars and a geothite-hematite mixture in the 1 to 2 micron region, Icarus,3, 63-65,
1964.
Evans, D. L., and J. B. Adams, Comparison of Viking
lander multispectral images and laboratory reflectance spectra of terrestrial samples, Proc. Lunar Planet.
Farmer, C. B., D. W. Davies, and A. L. Holland, Mars: Water vapor observations from the Viking Orbiters,
J. Geophys. Res., 82, 4225-4248, 1977.
Guinness,E.A., R. E. Arvidson, D. C. Gehret, and L. K. Bolef, Color changes at the Viking landing sites
over the course of a Mars year, J. Geophys. Res., 84, 8355-8364, 1979.
Hanel, R., B. Conrath, W. Hovis, V. Kunde, P. Lowman, W. Maguire, J. Pearl, J. Pirraglia, C. Probhadara,
B. Schlachman, G. Levin, P. Straat, and T. Burke, Investigation of the martian environment by infrared spectroscopy on Mariner 9, Icarus, 17, 423-442, 1972. Head, J. W., J. B. Adams, T. B. McCord, C. Pieters, and
S. Zisk, Regional stratigraphy and geologic history of Mare Crisium, in Proceedings of the Conference on Luna 24 entitled Mare Crisium: The View from Luna 24, edited by R. B. Merrill and J. J. Papike, pp. 43-74, Pergamon, New York, 1978.
Houck, J. R., J. B. Pollack, C. Sagan, D. Schaack, and J. A. Decker, Jr., High altitude infrared spectroscopic evidence for bound water on Mars, Icarus, 18, 470-480, 1973.
Huck, F. 0., D. J. Jobson, S. K. Park, S. D. Wall, R. E. Arvidson, W. R. Patterson, and W. D. Benton,
Spectrophotometric and color estimates of the Viking lander sites, J. Geophys. Res., 82, 4401-4411, 1977.
I. Kinetics and alteration phase identification, J. Geophys. Res., 78, 8481-8493, 1973a.
Huguenin, R. L. Photostimulated oxidation of magnetite, 2, Mechanism, J. Geophys. Res., 78, 8495-8506, 1973b. Huguenin, R. L., The formation of geothite and hydrated
clay minerals on Mars, J. Geophys. Res., 79, 3895-3905, 1974.
Huguenin, R. L., J. B. Adams, and T. B. McCord, Mars: Surface mineralogy from reflectance spectra, in Lunar Science VIII, pp. 478-480, Lunar Science Institute, Houston, 1977.
Huguenin, R. L., J. W. Head, T. R. McGetchin, Mars: Petrologic units in the Margaritifer Sinus and Cop-rates Quadrangle, Reports of Planetary Geology
Program, 1977-1978, NASA Tech. Memo. 79729, 1978. Hunt, G. R., L. M. Logan, and J. W. Salisbury, Mars:
Components of infrared spectra and composition of the dust cloud, Icarus, 18, 459-469, 1973.
James, P. B., G. Briggs, J. Barnes, A. Sprick, Seasonal recession of Mars' south polar cap as seen by Vikinj, J. Geophys. Res., 84, 2889-2922, 1979.
Kieffer, H. H., Near infrared spectral reflectance of simulated Martian frosts, Ph.D. thesis, Calif. Inst. of Technol., Pasadena, 1968.
44
Kieffer, H. H., T. Z. Martin, A. R. Peterfreund, and B. M. Jakosky, Thermal and albedo mapping of Mars
during the Viking primary mission, J. Geophys. Res., 82, 4249-4291, 1977.
Larson, H. P., and U. Fink, Identification of carbon
dioxide frost on the Martian polar caps, Astrophys. J., 171, L91-95, 1972.
Madarazzo, M., and R.L. Huguenin, Petrologic implica-tions of Viking XRF analysis based on reflection spectra and the photochemical weathering model
(abstract), Bull. Amer. Astron. Soc., 9, 527-528, 1977. McCord, T. B., and J. B. Adams, Spectral reflectivity
of Mars, Science, 163, 1058-1060, 1969.
McCord, T. B., and J. A. Westphal, Mars: Narrowband Photometry, from 0.3 to 2.5 microns, of surface
regions during the 1969 apparition, Astrophys. J., 168, 141-153, 1971.
McCord, T. B., R. L. Huguenin, D. Mink, and C. Pieters, Spectral reflectance of Martian areas during the
1973 opposition: Photo-electric filter photometry 0.33-1.10pm, Icarus, 31, 25-39, 1977a.
McCord, T. B., R. L. Huguenin, and G. L. Johnson, Photometric imaging of Mars during the 1973 opposi-tion, Icarus, 31, 293-314, 1977b.
McCord, T. B., R. Clark, and R. L. Huguenin, Mars: Near-infrared spectral reflectance and compositional
Huguenin, Mars: Near-infrared reflectance spectra of surface regions and compositional implication,
Thesis submitted to J. Geophys. Res., 1980. Ch. i
McGetchin, T. R., and J. R. Smyth, The mantle of Mars: Some possible geological implications of its high density, Icarus, 34, 512-536, 1978.
Pimentel, G. C., P. B. Forney, and K. C. Herr, Evidence about hydrate and solid water in the Martian surface
from the 1969 Mariner infrared spectrometer, J. Geophys. Res., 79, 1623-1634, 1974.
Sagan, C., J. P. Phaneuf, and M. Ihnat, Total reflec-tion spectrophotometry and thermogravimetric analysis of simulated Martian surface materials, Icarus, 4,
43-61, 1965.
Sharonov, V. V., A lithological interpretation of the photometric and colorimetric studies of Mars, Soviet Astron.-AJ, 5, 199-202, 1961.
Singer, R. B., The composition of the Martian dark regions: I. Visible and near-infrared spectral reflectance of analog materials and interpretation of telescopically observed spectral. shape,
submitted to J. Geophys Res., 1980a. Thesis
Singer, R. B., The composition of the Martian dark regions: II. Analysis of telescopically observed absorptions in near-infrared spectrophotometry,
Singer, R. B., and T. B. McCord, Mars: Large scale mixing of bright and dark surface materials and implications for analysis of spectral reflectance,
Thesis
Proc. Lunar Planet. Sci. Conf. 10th, 1835-1848, 1979. Ch.III Singer, R. B., and T. B. McCord, Mars surface color
units from Viking Orbiter and groundbased telescope data: A comparison, to be submitted to J. Geophys. Ites., 1980.
Sinton, W. M., On the composition of Martian surface material, Icarus, 6, 222-228, 1967.
Smith, S. Q., and B. A. Smith, Diurnal and seasonal
behavior of discrete white clouds on Mars, Icarus, 16, 509-521, 1972.
Soderblom, L. A., and D. B. Wenner, Possible fossil H20 liquid-ice interfaces in the Martian crust,
Icarus, 34, 622-637, 1978.
Soderblom, L. A., K. Edwards, E. M. Eliason, E. M. Sanchez, and M. P. Charette, Global color variations on the Martian surface, Icarus, 34, 446-464, 1978. Strickland, E. L., III, Soil stratigraphy and rock
coatings observed in color enhanced Viking Lander Images, In Lunar and Planetary Science X, pp. 1192-1194, Lunar and Planetary Institute, Houston, 1979. Toon, 0. B., J. B. Pollack, and C. Sagan, Physical
properties of the particles composing the Martian dust storm of 1971-1972, Icarus, 30, 663-696, 1977.
Toulmin, P., III, A. K. Baird, B. C. Clark, K. Kiel, H. J. Rose, Jr., R. P. Christian, P. H. Evans, and W. C. Kelliher, Geochemical and mineralogical inter-pretation of the Viking onorganic chemical results,
J. Geophys. Res., 82, 4625-4634, 1977.
Wildt, R., Ozon and Sauerstoff in den Planeten-Atmos-pharen, Ver5ffentlich Univ.-Sternwarte G6ttingen, 38, 1934.
Younkin, R. L., A search for limonite near-infrared spectral features on Mars, Astrophys. J., 144, 808-818, 1966.
FIGURE CAPTIONS
Figure 1. Locations on Mars for spectrophotometric observations by McCord and others. The first two digits represent the year of observation (e.g., 69-1 was
observed in 1969). Observations made in 1969 are
described by McCord and Westphal (1971); 1973 observa-tions are described by McCord et al. (1977a); 1978 observations are described by McCord et al. (1980). Locations of observations for which the surface was partially or wholly obscured by atmospheric dust are not shown. (Base map: USGS topographic map of Mars
I-961, 1976.)
Figure 2. Comparison of Viking orbiter and ground-based spectrophotometry for identical areas on Mars
(see Figure 1 for locations). All data are scaled to unity at a wavelength of 0.56 ym. Vertical bars on
Viking data points do not represent observational errors; rather they show the la variation of spectral reflectance characteristics within each region of ground-based
observation. Horizontal bars on Viking data points show the half amplitude band widths (from Singer and McCord, 1980).
Figure 3. Representative bright and dark region reflectance spectra, scaled to unity at 1.02 ym. The bright region spectrum (top) is composed of an average
1978 (infrared). The dark region spectrum (bottom) is a composite of data from two nearby locations in
Iapygia: 69-6 (visible) and 78-10 (infrared).
Figure 4. Demonstration of the effects of bright material contamination in observed dark regions.
Details of the analysis are described in text. Curves labelled 'observed bright' and 'observed dark' are
observational data for bright and dark regions, respec-tively, with a model CO2 atmosphere removed. The curve
labelled '-10% brt' is the dark material spectrum
resulting from the assumption of 10% areal coverage of the observed dark region by bright material, and
similarly through '-40% brt.' Notice that an assumption of more than 40% coverage by bright material would
yield an unrealistically low reflectance for the dark material (.from Singer and McCord, 1979).
Figure 5. Comparison of observed Mars bright and dark region spectra with laboratory spectra of weathered basalt. A single olivine basalt, oxidized in the
laboratory, provided the best match for both bright and dark regions in this spectral range; the bright region spectrum requires a higher degree of oxidation and a finer grain size than the dark region spectrum (from Adams and McCord, 1969).
Figure 6a. The average of the brightest region spectra from McCord et al. (1980) is shown (top) compared with an additive model (simulation) of a spectrum characteristic of a combination of oxidized basalt and water ice. The ratio of the bright area to the simulation (residual) is shown (bottom) and compared with a standard martian CO2 transmittance spectrum
(Kieffer, 1968; McCord et al., 1978).
Figure 6b. Same analysis as in Figure 6a but compared with a model (simulation) based on an H20-ice spectrum and a spectrum characteristic of photo-oxidized magnetite, where the oxidation layer is about 1 pm
thick (Huguenin, 1973a) (from McCord et al., 1980).
Figure 7. The martian north polar cap spectrum compared with an additive simulation of ice and a grey material (top). The ratio of the polar cap spectrum to
the simulation is then comapred with the expected CO2 martian transmittance (bottom). (From Clark and McCord,
30'N-
0-30S
-
REGI I
r
±--a REGIIII
REGI REGI - IiGROUNDBASED VIKING ORBI 0.40 ON 69-1 IT ON 73-6111
i11
I1I
ON 69-6 ON 73-26 (McCORD ET AL., 1971, 1977)-TER II (SODERBLOM ET AL., 1978)
I
0.60 0 80
WAVELENGTH IN MICRONS
Figure 2
I I I I I I I I I I I I I I I I I I I I I I I I . BRIGHT REGION S .ifU PECTRUM 4. 4.
A
EDARK REGION SPECTRUM
Figure 3 8.60 1.00 1.50 2.00 2.50 1.A00 1.E N WlAVELENGTH IN MICRONS I 0. 50 - 2. 00 2. 50
I I -r---r -- r--- I - I I I I T v vW 0vgq v~ 'wVft v yYyv V v y v vvv v T U U x )@C x X X x x )x4c - Xx a a a E3a 1a 1 9 . , I 1.50 2.00 WAVELENGTH IN MICRONS VVA 2.50 3.00 1~ OBSERVED BRIGHT OBSERVED D3ARK -10% BRT 20% BRT --30% BRT --40% BRT , I . I I CT) N 0.50 1.00
I I
I OXIDIZED BASALT <.050mm 2 LESS OXIDIZED BASALT
0.50- .100 mm * MARS, BRIGHT REGIONS (p) x SYRTIS MAJOR, LATE SUMMER * *0 C ~x'x % x x * e . I I
.4
.6
.8
WAVELENGTH (p.)
1.0 30-No
0z
w U-Lu 20H * ~ 10F-0 0 * 2,.2
-MARS AVERAGE BRIGHT AREA
'Si
U
'r Ua -
-sn
UMARS AVERAGE BRIGHT AREA RESIDUAL
-w--- -CO2 TRANSMITTANCE. I I I I I I I I I I £ I A I I I L 1.60 2.00 WAVELENGTH IN MICRONS Figure 6a 0 N L4 z 0 U C N tgC me. U U 0 a: U. U US -J a: U W 0.60 1.20 2.40
-I I I I I I I j I I I I I I I I 1 1
MARS DARK AREA 78-10
MARS 78-10 RESIDUAL N (4 z W 0 C9 '-m N CDa to 0 I.-. U U tL -J cr U CL cin 0.80 1.20 1.60 2.00 WAVELENGTH IN MICRONS 2.40 Figure 6b CO2 TRANSMITTANCE I ..- I I I I I I a I 1 1 -- L - I I I I I .
I I I I I I I
I g I
MARS NORTH POLAR CAP
I
I
SIMULATION: 60% FROST, 40%
RESIDUAL: NORTH POLAR CAP / SIMULATION
Z CD cn z 0 '-N CD (L i L0 I-. I I I , 1.20 I I I 1.60 WAVELENGTH IN MICRONS Figure 7 CO2 TRANSMITTANCE AIR MASS- 3.5 0.80 I I I I I I I I I I I I I -- I I -- - -I I I a a I E B 2.00 2.40
MARS: Near-Infrared Spectral Reflectance of Surface Regions and Compositional Implications
This paper is by T.B. McCord, R.N. Clark, and R.B. Singer. It will be submitted to J.Geophys.Res. in 1980 in revised form.
60
ABSTRACT
Reflectance spectra (0.65 - 2.50 pm) are presented for 11 martian areas. The spectral resolution is ^l;% and the spatial resolution is 1000 - 2000 km. These are the first high quality spectrophotometric data at these wavelengths for regions on the surface. Spectral features
previously observed are confirmed and better defined, and a number of important spectral properties are charac-terized for the first time. The spectra show water-ice absorptions in the 1.5 and 2 pm regions, which if due to surface frost would imply the presence of 1 to 2 mg/cm2
H2 0. However, other studies have shown that the presence of a frost on the surface is unlikely. Water-ice may exist in the pore structure of clay minerals if the clay
structure is saturated. The dark region spectra indicate about four times less water ice than seen in bright
regions. Since some bright material is present in dark regions there may be no water ice associated with the dark materials themselves. The presence of weak 2.3-pm absorption bands in many of the spectra imply the
presence of hydroxylated magnesium-rich minerals such as amphiboles (anthophyllite) and sheet silicates
(serpentine, talc, and magnesian smectites). The apparent absence of a 2.2-pm absorption implies that montmorillonite may not be a major component of the martian regolith. Many of the spectra also show
apparent absorptions at 1.9 pm, in the wing of the 2.0-ym martian atmospheric CO2 absorption, which are
due to bound water, strengthening the previous conclu-sions. Observed dark regions have previously not well determined near-infrared spectral shapes characteristic of thin semi-transparent alteration coatings overlying dark unaltered rock. Previously observed ferrous- and ferric-iron absorptions in the 1-ym region are better defined by these new data. Clinopyroxene (augite) is definitely present but olivine is not spectrally