Publisher’s version / Version de l'éditeur:
Vous avez des questions? Nous pouvons vous aider. Pour communiquer directement avec un auteur, consultez la première page de la revue dans laquelle son article a été publié afin de trouver ses coordonnées. Si vous n’arrivez pas à les repérer, communiquez avec nous à PublicationsArchive-ArchivesPublications@nrc-cnrc.gc.ca.
Questions? Contact the NRC Publications Archive team at
PublicationsArchive-ArchivesPublications@nrc-cnrc.gc.ca. If you wish to email the authors directly, please see the first page of the publication for their contact information.
https://publications-cnrc.canada.ca/fra/droits
L’accès à ce site Web et l’utilisation de son contenu sont assujettis aux conditions présentées dans le site LISEZ CES CONDITIONS ATTENTIVEMENT AVANT D’UTILISER CE SITE WEB.
Internal Report (National Research Council of Canada. Division of Building
Research), 1968-08-01
READ THESE TERMS AND CONDITIONS CAREFULLY BEFORE USING THIS WEBSITE. https://nrc-publications.canada.ca/eng/copyright
NRC Publications Archive Record / Notice des Archives des publications du CNRC :
https://nrc-publications.canada.ca/eng/view/object/?id=f18e33f3-7830-4620-a480-e437e86d9acf https://publications-cnrc.canada.ca/fra/voir/objet/?id=f18e33f3-7830-4620-a480-e437e86d9acf
Archives des publications du CNRC
For the publisher’s version, please access the DOI link below./ Pour consulter la version de l’éditeur, utilisez le lien DOI ci-dessous.
https://doi.org/10.4224/20338141
Access and use of this website and the material on it are subject to the Terms and Conditions set forth at
Toxicity hazards of small unvented fuel-burning appliances
TOXICITY HAZARDS OF SMALL UNVENTED FUEL-BURNING APPLIANCES
by
A. D. Kent
ANAL VZED
Internal Report No. 362
of the
Division of Building Research
OTTAWA
The study of small unvented appliances now reported arose out of earlier work on the climate likely to exist in family basement
fallout shelters. It was decided that some provision should be made
for emergency winter heating as well as for cooking and lighting in
such shelters and that a liquid fuel, preferably kerosine, should be
stored for this purpose. In the earlier studies described in DBR
Reports 243, 264 and 322 use was made of simple inexpensive flat-wick kerosine burners, and a further examination of these and other appliances as to general performance and particularly in respect of
their production of carbon monoxide was indicated. This had obvious
interest for many regular uses of such appliances as well as for fall-out shelter heating.
The author, a mechanical engineer, is a research officer in
the Building Services Section. He has been involved in many studies
on domestic heating and in work on safety standards for heating ap-pliances.
Ottawa August 1968
N. B. Hutcheon Assistant Director
by
A. D. Kent
The use of unvented heating and cooking appliances in confined quarters can be a hazard to health and to life unless proper precautions are taken to ensure that the concentrations of toxic gases, principally carbon monoxide and carbon dioxide, are kept below their safe limits. Generally accepted limits of maximum concentration are 100 ppm (parts per million) for carbon monoxide and 5, 000 ppm for carbon
dioxide. In any given enclosure, the resultant concentration of any
particular combustion gas depends upon the amount of the gas present in the normal atmosphere, the rate of generation of the gas by the appliance and other sources, and the ventilation rate by which the gas
is dissipated. Carbon monoxide (CO) and carbon dioxide (C02) are
present in ordinary atmospheric air in small quantities, about 1 or 2 ppm
for CO and about 400 to 500 ppm for C02. The precautions necessary in
confined spaces are thus mainly concerned with supplying sufficient ventilation to counter the rate of gas production by dilution.
Under some circumstances, the ventilation rate may be beyond the control of the occupants, such as in a basement fallout shelter,
where the air change rate of the basement rather than that of the shelter is the ultimate controlling factor on the gas concentrations in the shelter. During warm summer weather and periods of low wind velocity, it has been shown (1) that carbon dioxide concentrations at or below 0.5 per cent (5, 000 ppm) are difficult to maintain even when the occupants are
the only source of carbon dioxide. Under such conditions, it would be
important in a fallout shelter to minimize the use of unvented fuel-fired
cooking appliances which could only aggravate the contamination. The
same would apply to other confined spaces such as tightly closed tents,
cabins, boat galleys, cabin trailers, or northern vehicles. The danger
is especially grave when the weather is colder, since this leads to
The quantity of carbon dioxide produced by a fuel-burning appliance operating efficiently in a normal atmosphere is more or less in direct proportion to its firing rate for a given type of fuel and, therefore, can be predicted fairly accurately from records of
fuel consumption. Carbon monoxide, on the other hand, is far less
predictable since its production depends not so much upon the firing rate but rather upon the burner design and the temperature of the
flame and its environment. Furthermore, under conditions of
re-duced oxygen content, as in a poorly ventilated occupied shelter or cabin, it would be expected that completeness of combustion would
be affected. It would also be expected that most burners would
emit more carbon monoxide when operated with a less volatile fuel than that for which they were designed.
TEST PROGRAM
The program of appliance testing reported herein was an out-come of preliminary tests on certain keros ine-burning appliances
used in connection with the fallout shelter climate studies. The object
of the tests was to study the combustion characteristics of various fuel-fired heating, illuminating and cooking appliances which are nor-mally available on the Canadian market for camping, boating, etc.
This involved ass essing their potential hazard in terms of the pro-portion of carbon monoxide output to carbon dioxide output (CO/C02 ratio) when operating with (a) adequate oxygen under normal atmospheric conditions and (b) increasingly reduced oxygen content due to inadequate ventilation.
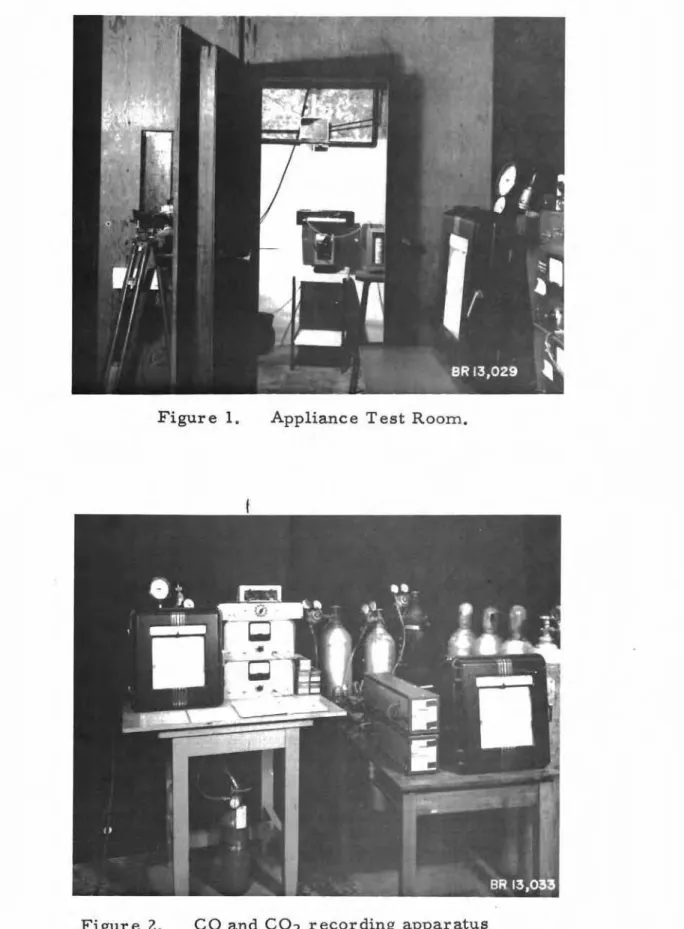
The tests were carried out in a small refrigerated room
(Figure 1) 7 1/2 ft long, 5 it wide and 9 it high of wood frame
con-struction, with plywood exterior and insulated with fibrous glass wool
between framing members. A floor of plasterboard was the only interior
finish. The test chamber was equipped with a quadruple-glazed window
and a gasketed insulated wooden door similar to those used for walk-in
type refrigerators. The volume of the evaporator of the refrigerating
unit plus that of the furniture and test equipment reduced the net room
volume to approximately 390 cu it allowing for the space occupied by
the insulation. Temperature control of the room air was within ±4F
load when fully operating appliances were introduced into the room. The appliance test location was on a small metal table immediately below the evapor a tor unit where the open flames would be least
affected by the air currents. Uniform air temperature throughout
the room was assured by the excellent mixing action of the fan
dis-charge of the ceiling-hung evaporator. This mixing was sufficient
to allow the use of a single thermocouple junction for recording average air temperature and a single sampling tube for taking a
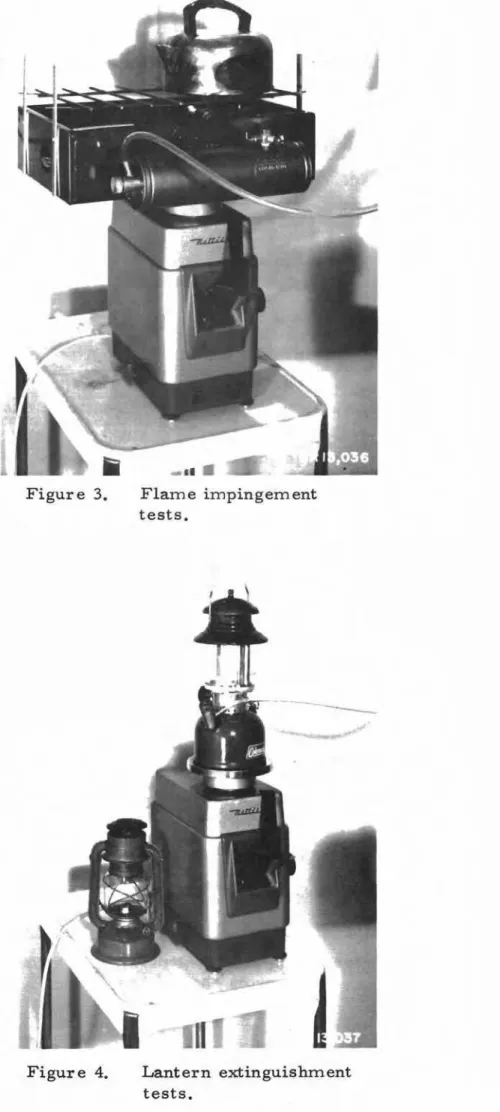
con-tinuous atmospheric sample for analysis. Analysis of the room air
for carbon monoxide and carbon dioxide was achieved by the use of
two Beckman infra-red analyzers in series (Figure 2), indicator
deflections of the two amplifiers being alternately recorded on the
single strip chart of a multi-point recorder. The readings of carbon
monoxide concentration in the room air required correction for
inter-ference by carbon dioxide. Water vapour correction was unnecessary
because of the use of a desiccant, magnesium perchlorate, in the
sampling system. Zero concentration and up-scale concentration gases
of known laboratory analysis obtained from standard cylinders were
used for standardizing the equipment. A small diaphragm pump
trans-ported the sample from the test room or from the test cylinders through a valve selector switch operated either manually or automatically by
the print mechanism of the recorder. The sampling system also
con-tained a throttling valve and a variable area flow meter which were used to adjust the gas flow through the analyzers to 1 litre per minute. Relative humidity of the air in the test room was measured and recorded
continuously by a hair-actuated hyg r og r aph, Fuel consumption of the
majority of appliances was obtained by placing the appliance on a
precision balance and taking a sight reading through the test room window
of the loss of weight measured at fifteen-minute intervals. The exception
was one appliance whose total weight with fuel was too great for the range
of the balance. This appliance was weighed outside the test room before
and after the test to obtain total fuel consumption, the interim con-sumptions being estimated.
In conducting the appliance tests, in each case the burner was lit in the normal fashion and allowed to burn in the 75F air of the laboratory outside the test room so that flame temperature, appliance temperature and fuel burning rate reached a condition of reasonable
test room on the platform of the balance and the test observations
begun. The time between entering with the appliance and leaving
the room was one-half minute or less, thus allowing a minimum of contamination of the test room atmosphere by the breathing of labo-ratory personnel.
The test program involved different types of applianc es designed to burn a wide variety of fuels such as kerosine, fuel oil, alcohol, naphtha, liquefied petroleum gas, aliphatic solvent, and
even charcoaL The individual appliances were chosen as representative
of types readily available to the consumer, the majority being
pur-chased from local hardware and sporting goods stores. Most of the
units were operated not only with the fuel for which they were designed but other fuels which in an emergency they might reasonably be
re-quired to use.
The schedule of tests is outlined in Table 1. Tests 1 to 16
were to determine the behaviour of four types of kerosine-burning
appliances using Type 2 special kerosine (2), Type l(Standard) kerosine (2),
No. 1 (stove) oil and No. 2 (furnace) oil. Tests 17 to 26 involved two
types of alcohol-burning appliances operating with methyl, ethyl and
isopropyl alcohols and methyl hydrate. Two stoves and a lantern
normally using lighting naphtha were tested for operation with lighting naphtha, aliphatic solvent, marine (white) gasoline, and automobile
(leaded) gasoline in tests 27 to 38. For the tests of pressure type
appliances, a constant pressure was maintained in the fuel tank by means
of compressed air from a service line. This procedure kept the fuel
burning rate more or less constant for the duration of the test and eliminated the necessity of re-entering the test room to renew the ap-pliance pressure during the test, thus avoiding upsetting the temperature
conditions and the gas concentrations in the room. Tests 39 to 44 were
conducted using three catalytic combustion heaters of different makes
operating on aliphatic solvent and lighting naphtha. In test 45 a small
picnic stove operating on liquefied petroleum gas (LPG) was tested. Tests 46 to 49 were conducted for tiny portable cooking appliances of the type used for hiking and mountain climbing, operating on the fuel for which they were designed, while test 50 involved a charcoal-burning stove used mainly for barbecuing.
The main series of tests was conducted with the appliances
operating at full capacity. Auxiliary tests were conducted for the
four kerosine-burning appliances using special kerosine as fuel with the fuel rate adjusted to reduce the capacity of each appliance to approximately 3/4 and l/Z full capacity.
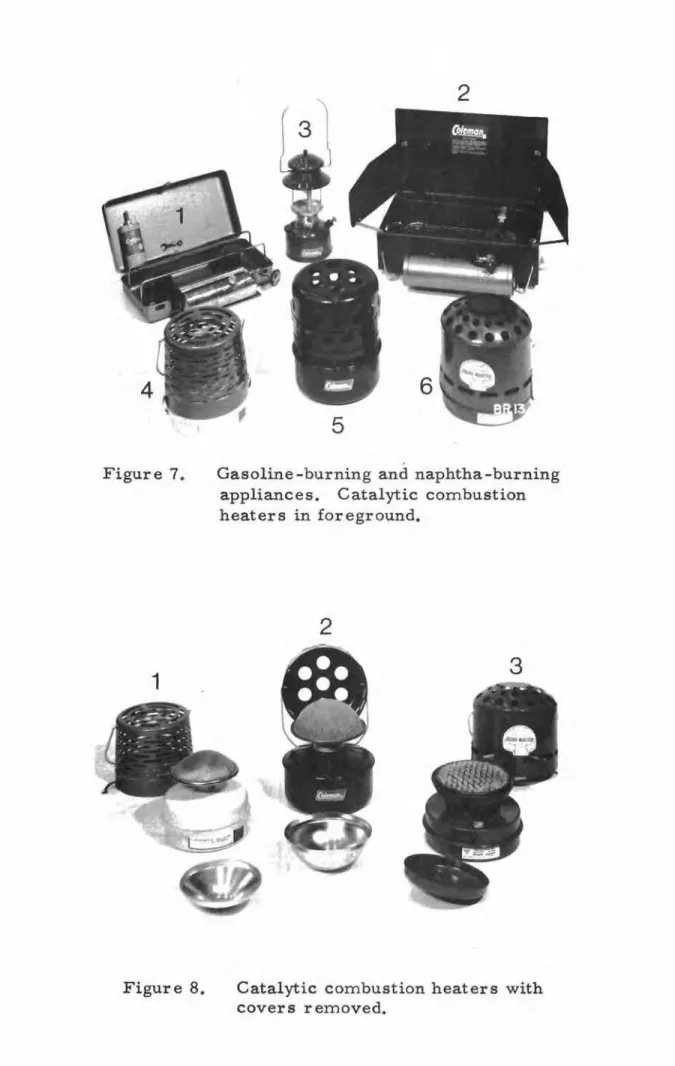
Additional tests were run to determine the amount of carbon monoxide produced by placing first a kettle of water and then a metal plate on the stove, and the variation in the quantity of carbon monoxide produced when the kettle or plate is gradually raised out of the zone of
flame impingement (Figure 3). Another test was made to determine
the carbon monoxide production involved in cigarette smoking.
Still other tests were conducted to determine the carbon dioxide concentration of the room atmosphere at which the flame of a wick-type lantern would be extinguished (Figure 4) and to determine the normal ventilation rate of the test room by plotting the decay rate of carbon dioxide introduced into the room from a COZ cylinder.
TEST PROCEDURE
A useful criterion for the assessment and comparison of the toxic gas production of appliances is the ratio of carbon monoxide to
carbon dioxide production (CO/COZ ratio). Normally this ratio is
obtained under test conditions allowing adequate oxygen to the appliance. British Standards for domestic heating and cooking appliances (3) allow O.OZ as the maximum COl COZ ratio by volume for appliances burning between (a) the manufacturer's recommended maximum rate of burning and (b) either one-half of this rate or the minimum rate recommended
by the manufacturer, whichever is less. The figure of O. OZ is no doubt
obtained by the ratio of allowable concentrations of CO and COZ,namely 100 ppm and 5000 ppm.
Of interest also, especially when studying the performance of
appliances in relatively small and perhaps poorly ventilated spaces, is
the CO/COZ ratio with the oxygen supply restricted. Thus in addition
to the initial COl COZ ratio during the first few minutes of the test run with adequate oxygen supply, a second criterion was used, namely the change in the value of this ratio with time and with fuel consumption as oxygen was being gradually depleted and the concentrations of combustion products were rising.
The construction of the test chamber resulted in a small amount of air leakage at plywood joints and around the door closure due to the difference in density of the cooler air in the test room and
that of the laboratory. It was necessary, therefore, to establish the
rate of air exchange of the test chamber and the surrounding laboratory
in order for the readings of gas concentrations to be meaningful. This
was done by the tracer gas method whereby a quantity of gas is intro-duced into the space and its concentration depletion or decay measured over a period of time.
The ventilation rate of a room or space based on the measure-ment of the decay rate of a homogeneous mixture of tracer gas and air can be expressed as follows:
A
=
where=
=
==
=
ventilation rate, air changes per hour,
concentration of tracer gas at time t
1, per cent,
concentration of tracer gas at time t
2, per cent,
time of first sample, hours, time of second sample, hours.
From two concentration values of the tracer gas carbon dioxide, involving a time lapse of 5 hours, the calculated ventilation rate of the test room using the above formula was 0.115 air changes per hour,
when the room was maintained at 50F ± 2F degrees. With a net room
volume of 390 cu ft, this resulted in a total ventilation rate of
approxi-mately 45 cu it per hr, which included the 2 cu it per hr (approximately
1 litre per min) continuous extraction of the room air sampling.
In the first analysis of the concentrations of gases resulting from the operation of the various heaters the ventilation rate of 45 cfh was
thought to be insignificant. A closer examination of the situation,
the ventilation air could be as high as 135 cu it in total volum.e or
roughly one third of the room volum.e. A second analysis was thus
made necessary, taking into account this quite substantial air change
volum e,
The rate of production of any of the gases of combustion can be calculated from the following formula:
Wt.5 = r t.t - V5t.t w whence r w = Wt.5 t.t
+
V5 (1) where r=
wW
=
5=
V
=
t=
average rate of gas production, lb per hr, weight of mixture in room, Ib,
gas concentration, Ib gas per Ib mixture ventilation rate of room, lb per hr, time, hr.
5ince the amounts of CO or COZ contamination are small re-lative to the air of the room, W is assumed to be the weight of air enclosed by the room which is the density at 50F multiplied by the
room v ol.um e, or 0.0778 Ib/ cu it x 390 cu it which equals 30.4 lb.
Then V becomes 0.115 x 30.4. For any two consecutive concentration
readings taken with a time increment of t, the concentration increment
t.5 becomes the difference between 5 Z and 51 and the value of 5 is derived from the arithmetic mean, or
5
=
Thus for time increments of 15 min the formula for the average pro-duction rate of CO becomes:
30.4 x .115 (5
Z
+
51)z
then r
w
=
(2)where =
=
average rate of production of CO, lb per hr ,
CO concentrations, at times t
l and t2
respectively in lb per lb of mixture.
Since the CO concentration as recorded by instrument (s) is
in per cent by volume instead of lb per lb of mixture (S), then S
= .
00967 ssince the specific gravity of CO (relative to air) is .967.
Then
r = .00967x123.6(s
w 2
=
where s 1 and
"z
are CO concentrations, at times t1 and t2
respectively, in per cent by volume (as rnea.aur ed},
Similarly for carbon dioxide (C0
2) production the formula
would be: (3) where R = w C 1 and C2
=
average rate of production of CO , lb per hr,
2
CO concentrations at times t
l and t
2 2
respectively in 1b per lb of mixture,
and since then
C
=
.0152 c (sp gr of CO relative to air is 1. 52)2
=
where c and c are CO concentrations at times t
l and t
1 2 2 2
Thus to establish the COl COZ ratio by weight for any
IS-min increment of time t1 to t
z
the ratio is:Expressed in terms of volume the average rates of CO and
COZ production in cubic feet per hour become:
then and then r L 195 (sZ
-
.97 51) w r=
=
v PCO .967 x .0778 r = 15.9 (s .97 51) cu it/hr v Z R L 88 (c Z-
.97 c1) R = w = v PC O 1.5Zx.0778 Z R=
15.9 (c-
.97 c 1) cu ft/hr v Z (4) (5)average rate of CO production, cu it/hr, average rate of COZ production, cu it/hr,
density of CO 1b/cuit,
density of CO Z Ibl cu ft. r v R v where P CO ;; P CO
=
ZPerformance standards for portable appliances usually express
the COl COZ ratio of the combustion gases on a volume ,basis instead
of by weight. Thus the expression for the CO/COZ production ratio on
a volume basis becomes:
COl COZ ratio by volume =
r v R
v
In using these equations to calculate the CO/C02 production ratio for each appliance and the variation of this ratio over the test period, the assumption was that the ventilation rate of the test room
was constant at the measured value of 45 cu it per hr. It was assumed,
therefore, that there was no significant change in weight of the room
gases due to the conversion of 0 to CO and CO (approximately 0.9
2 2
weight ratio of CO
2 produced to O2 consumed); and that the bulk mean
temperature of the air in the test room was the same for the decay rate test (from which the ventilation rate was established) as for the performance tests in which different appliances were producing various
degrees of heat within the room. This is thought to be a valid assumption
since the temperature at the control point in the room was maintained
within
±
40F and the large volume of air circulation assured a reason-ably uniform air temperature throughout the room in all cases.
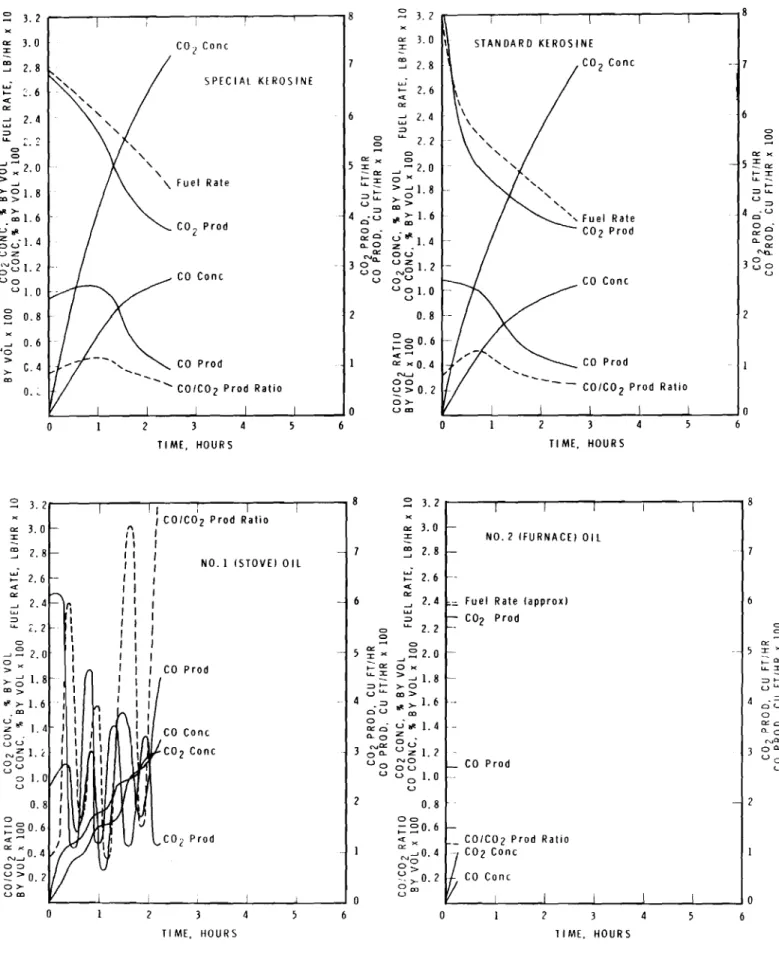
TEST RESULTS
The results of the tests of the kerosine-burning appliances are
given in graphic form in Figures 9 to 12. These figures show in each
case the variation in the CO and CO
2 concentrations as measured, the
CO and CO
2 productions as calculated from these measurements, the
calculated CO/C02 production ratio and the measured fuel rate from the
time (0 hours) when the appliance was placed in the test room until the end of the test.
(a) Double Flat-Wick Stove (No 1 in Figure 5)
(Performance, Figure 9)
This is a small circular cook stove about 9 in. in diameter
designed to accommodate a single cooking utensil. The burner
incorpor-ates two flat-type cotton wicks with bottom ends dipping into the
kerosine reservoir of about 2 1/4-lb fuel capacity. The wicks are
in-dependently adjustable for height by means of friction rods with knob
ends. At optimum wick height, this stove gives a clean yellow flame;
beyond that height the flame develops orange tongues accompanied by
smoke. Combustion gases even with clean flames have a slight odour.
Experience with this stove as a heater in fallout shelter climate studies indicated that higher flame than the ordinary optimum can be tolerated without smoking if a metal plate is placed on the stove to provide added radiation to the flames.
From the performance curves it is evident that the fuel rate of this stove is fairly low (.04 to .06 lb/hr) except that with
special kerosine a rate up to .09 lb/hr can be tolerated without
smoking. With all four fuels the CO production was low and became
stabilized after the first hour or so of oxygen depletion, remaining remarkably steady at .007 to .009 cu ft/hr until the end of 6-hr tests.
Similarly the CO2 production fell at first but became more or less
constant after an hour or two. The resultant COl C02 ratio began
initially quite low for all four fuels, rose slightly but remained below
.01 during all four tests.
(b) Circular Wick Stove (No 2 in Figure 5)
(Performance, Figure 10)
This stove is a l Ot- in, by 10-in. appliance with single burner
and a fuel tank capacity of about 2 lb. The burner operates with a
single circular adjustable wick, and is equipped with a sleeve "head" made up of concentric perforated cylinder walls and an open core. In operation the blue flame is practically odourless, although lighting
and extinguishing are accompanied by some odour. Removal of the
head on extinguishment eliminates most of the heat storage which is responsible for the lingering odour after the flame has gone out.
The performanc e curves for this stove show a high initial fuel
rate and high CO
2 production decreasing rapidly with oxygen depletion
to about half its normal rate at flame extinguishment after 3 to 4 hrs
operation in the test room. The CO production of this stove was quite
low showing a tendency to decrease during the tests. Correspondingly
the CO/C02 production ratio remained consistently low.
(c) Reflective Heater (No 3 in Figure 5)
(Performance, Figure 11)
This heater is one of a large number of European portable kerosine-burning heaters of the so-called "fireball" type operating with a sleeve burner equipped with a circular kindler wick of asbestos and a flow control valve, the burner being crowned with a circular wire coil and dome-shaped wire screen which glows a brilliant red at
high fire. A concave reflector behind the burner is designed to produce
the 8 3/4-lb capacity barometric fuel tank from being overheated.
A removable cooking grill allows the heater to be used as a single
burner stove if the flame guard, which is hinged at the top rear, is
lifted. The type of fuel feed used in this heater makes for a surging
or non-uniform fuel consumption when fuel rates below the maximum
are attempted. At maximum fuel rate, the flame is clean and
re-latively odour free, but on flame extinguishment, a very strong pungent odour is emitted unless the burner "head" is removed im-mediately.
When operated with fuels other than kerosine this heater's
performance was unsatisfactory. With No 1 (stove) oil, the fuel feed
to the flames carne in surges spaced at about 1/2 -hr intervals and after about 2 1/4-hrs operation the flame became extinguished at the
"valley" of the fourth surge. On No 2 (furnace) oil, operation was
very brief. After difficulty in starting the flame from the kindler
wick the heater ceased to function after about 15 min operation in the
test room. The readings for this period, however, indicated CO
and CO2 production, fuel rate and CO/C02 ratio were about the same
as for No 1 oil and the two kerosines. On both special and standard
kerosine the fuel rate and C02 production dropped off sharply from
the start of the tests. The CO production was medium at first, falling
to low at flame extinguishment after 2 1/2-hrs operation. The COl CO2
ratio in both cases was low at first, rose to about. 005 and dropped
back to about. 0025 by the end of the tests.
(d) Pressure Burner Stove (No 4 in Figure 5)
(Performance, Figure 12)
This is a small single burner kerosine-burning stove typical of a number of European makes of portable pressure-type cookers intended for camping or hiking and, therefore, lightweight and compact
when dismantled and packed in a small metal box. It requires alcohol
to preheat the vaporizer of the burner before kerosine can be properly burned, and pressure must be maintained in the l-lb capacity fuel reservoir for proper fuel feed, necessitating re-pumping with the
manually operated piston pump after 3/4 to 1 hour's operation. The
burner operates with a characteristic hissing or roaring noise as the liquid fuel is first vaporized by the heat of the flame, the vapour being
discharged upward through a fine orifice, striking the underside of
the burner "head". Here it mixes with air and ignites producing
blue fIarn e s which pass out radially through openings around the
vaporizer. Reduced heat output is achieved by momentarily releasing
SOlUe of the air in the pressure tank through a relief valve which, if left open, will stop the operation of the burner.
The pe rf or manc e curves for this stove showed a difference in
p erf or manc e with different fuels. The fuel rate under constant
pressure increased slightly when operating with special kerosine but dropped off sharply after about 1 1/4 hrs with standard kerosine and
No 1 (stove) oil. With No 2 (furnace) oil the sharp drop in fuel rate
commenced at the beginning of the test period. The CO
2 production in
each case followed the pattern of the fuel rate. With all four fuels the
CO production was at first reasonably low but, after about 3/4 to 1 hr of the test, rose very steeply so that in all four tests by the time flame e xtiriguf shm ent occurred the CO concentration in the room was above
the rn a.xirnurn allowable concentration (MAC) of 100 ppm (0.01 per cent).
This meant that the COl CO2 ratio, while starting off in each case at
a low value of .00 1 to • 002, rose above this after about an hour's
operation, especially in the test using standard kerosine.
(e) Other Appliances
Figures 9 to 12 have shown the time relationship of CO and CO2
production, concentration and fuel ratio for the four kerosine-burning
appliances operating with four different fuels. In Figure 13 the COl CO2
ratio vs time curves of these appliances for the special kerosine have been reproduced along with those of the various other appliances which
were tested, using the fuel for which they were designed. It will be noted
that most of the wick-type appliances and the LP gas stove showed a
tendency to increase in CO/C02 production ratio virtually from the
beginning of the test (curves A, F and N), (the exception being the
circular wick stove (curve B)), whereas the pressure-type burners (curves D, G) give a sharply rising curve after a relatively stable
operation time of about an hour. The reflective heater (curve C) ratio
rose at first, then fell off after about an hour's operating time. Of the
catalytic combustion heaters, all began with fairly high ratios which in
one case (curve K) remained high but in the others (curves J and L) fell
markedly with time. The pressure lantern showed a consistently low
CO/C0
INITIAL CO/C0
2 PRODUCTION RATIO
The COl CO2 production ratio of the appliance at the beginning
of the test run, before. any appreciable oxygen depletion of the com-bustion air can take place, is perhaps the most important single characteristic of the appliance in evaluating its performance and
general sUitability for use in confined spaces without a flue pipe. The
values of the initial COl CO
2 production ratios for the appliances
tested are contained in Table I I along with the initial fuel rate for
the particular test of each appliance. It is apparent that the majority
of appliances when tested at their normal fuel rate produced a CO/C0 2 ratio well below the. 020 maximum value set by the British Standards
Institution. However, one of the catalytic heaters and the charcoal
stove exceeded this figure in initial CO/C0
2 ratio.
Tests of the four kerosine-burning appliances at 3/4 and 1/2
full capacity indicated that the initial CO/C02 ratio of the three
appliances utilizing wicks increased with decreasing fuel rate, especially with the reflective heater, but that the pressure burner appliance exhibited a virtually constant initial CO/C0
2 ratio regardless
of the fuel rate. With the catalytic heaters the fuel rate was very
critical, varying from low initial CO/C02 ratio at low fuel rate to high ratio at high fuel rate.
With certain appliances, the type of fuel had a marked effect
on the initial COl CO2 production ratio; for example, the alcohol vaporizer
stove operated reasonably well with all alcohols except methyl alcohol, and the pressure burner gasoline stove showed a much lower initial
COl CO2 ratio with the automobile gasoline for which it was designed
than with the marine gasoline or the naphtha type fuels.
CO/C0
2 PRODUCTION RATIO WITH DECREASING
OXYGEN CONCENTRATION
The curves of COl CO
2 production ratio plotted against time, as
in Figures 9 to 12 for kerosine-burning appliances and in Figure 10 for additional appliances, give a record of each appliance's performance
in terms of hours of time of the test run. The 02 concentration at a
given time varied between appliances because of differences in firing rate, and therefore a more meaningful comparison of the performances
can be gained using the decrease in oxygen concentration of the
atmosphere as a basis rather than time. Since the decrease in
Oz
and increase in CO2 are complementary the CO2 concentration
can be used as a base for plotting the COl CO2 production ratio of
each appliance.
Thus the COl CO2 production ratio curves and the fuel rate
curves of Figures 9 to 12 have been replotted with CO
2 concentration
as a base in Figure 14. These show that in the cases of the
wick-type stoves the change in fuel had little effect upon the COl CO2
pro-duction ratio or the fuel rate. The same may be said for the
reflective heater except that for the heavier fuels, operation ceased
before a full test could be completed. In the case of the pressure
burner stove the COl CO2 production ratio was low for all fuels up
to a CO2 concentration of about 1 1/2 per cent beyond which operation
of the burner was unsteady and accompanied by large volumes of CO
production. Fuel rate fell off sharply with this stove operating on
No 2 fuel oil. These curves show that under conditions of increased
CO2 concentration (depleted oxygen) the adjustable wick-type burners
are to be preferred to the pressure burner type kerosine-burning a pplianc e s •
Figures 15 and 16 include the same information as Figure 14
and similar information for the other appliances burning the fuel for which they were designed.
Of the wick-type kerosine-burning appliances (curves A, B, and
C), the increase in CO
2 concentration had little effect on the CO/C02
production ratio but the fuel rate of the two larger capacity appliances
(curves B and C) showed a gradual reduction with increased CO
2
con-centration.
Of the pressure-burner appliances the kerosine stove (curve D)
and the automobile gasoline-burning stove (curve G) showed low COl CO2
ratio at first, but a marked increase in COl CO
2 ratio after the CO2
concentration had reached 1 1/2 per cent. On the other hand, the
naphtha-burning lantern and the naphtha-burning stove (curves H and I)
showed no increase in CO/C0
CO
2 concentration. Fuel rates for these pressure-burner
ap-pliances were virtually constant regardless of CO2 concentration.
Both the vaporizer-type alcohol-burning stove (curve E) and the wick-type alcohol-burning heater (curve F) showed an increase
in CO/CO?, production ratio after 1 to 1 1/2 per cent CO2 concentration.
The v apor rz er stove (curve E) showed no drop in fuel rate, however, while the wick-type burner (curve F) gave a falling fuel rate with
increased C02 concentration, the waviness of the curve showing some
surging in the fuel consumption.
The performance of the three catalytic combustion heaters,
with aliphatic solvent as fuel, was quite varied. Of the two smaller
appliances with approximately the same initial fuel rate (curves J and K) one heater had a very much higher COl CO
2 production ratio
(curve K). The third catalytic heater of higher heating capacity than
the other two began with a high fuel rate and high CO/C02 ratio
(curve L), but as CO2 concentration increased, both fuel rate and CO/C02 production ratio fell away rapidly, so that at about 1 l/2 per cent CO2 concentration the fuel rate was only about l/2 the initial
fuel rate and the COl CO2 ratio had been reduced to less than l/3
initial value.
Jellied alcohol-burning appliances, the performance of which is shown in curves M and 0, showed a distinct difference in COl CO
2 ratio due to the fact that the second appliance (curve 0) included a
small cooking vessel located in the flame. This gave an initial CO/C02
production ratio for this appliance above the corresponding ratio for
the other one (curve M). As CO
2 concentration increased curve
°
showed a sudden drop in COl CO
2 ratio believed to be caused by the
reduction in CO production as the flame environmental temperature increased.
Stove No 5 operating with LP gas (curve N) showed a very low COl CO
2 production ratio until a CO2 concentration of about 1 l/2 per
cent. At 2 per cent the ratio was rising steeply. The increasing
CO2 concentration had also an effect upon the fuel rate which dropped
steadily from the beginning. It is interesting to note that the test run
caused by entering the test r oom to replace the spent first cartridge with the second was so slight as to be unnoticeable in both the COl CO
2
ratio curve and the fuel rate curve (curve N). It would appear that
the fuel discharge lost while replacing cartridges was cornp ens a ted
for by a slightly higher rate of fuel discharge fr orn the new cartridge.
In sUITlITlary, wick-type burners in general showed a decreasing fuel rate with increasing CO
2 concentration while the fuel rate of
pressure-type burner s was in rn o st cases constant. The COl CO
2
pro-duction ratio of the wick-type burners was fairly constant whereas pressure-burners tended to show a rnar k.ed increase in CO/C0
2 ratio
after a concentration of 1 or 1 1/2 per cent had been reached. Catalytic
c ornbustion heaters gave generally high initial COl CO
2 production ratios
but both COl CO
2
ratio and fuel rate decreased generally with increasingCO2 c onc errtra tion, The naphtha lantern and stove (curves H and I) appeared to be the only two pressure-type appliances with low CO
production whose CO/C02 ratios were not affected by increasing CO
2 concentration.
FLAME IMPINGEMENT TESTS
The irnp ing erraent of the fl.arrie fr om a fuel-fired appliance upon
a relatively cold surface such as the bottom of a water-filled pot or
kettle has long been suspected of producing quantities of carbon rn onoxid e
in excess of the normal amount for the open unobstructed flame. To
determine the quantity of CO that rnight be expected from such cooking
operations, tests were conducted with a half-filled kettle of water, an empty cast iron frying pan, and a galvanized steel plate 0.034 in. thick, all thr ee having a 7 3/4 - in. diameter circular exposur e to the fl.arn e, The "standard" flame used for all tests was obtained by burning lighting naphtha in a single burner of the pressure-burner stove No 2 with fuel pressure regulated to 25 psi giving a fuel rate of 4 lb/hr and a flame
with tips extending 1 in. above the grill in its normal position. The
cover assembly and stand of the stove were r ernov ed and the stove was fitted with special adapters (Figure 3) for resetting the height of the
cooking grill fr orn the nor ma.l position to a total of 1 5/8 in. above
normal in increments of l/4 in. The tests were otherwise conducted in
the s arrre rnanne r as the regular series, with CO and CO
2 concentration
The results of the flame impingement tests are shown in
Figure 17 where the initial COl CO2 production ratio is plotted
against an exaggerated scale of distance representing the height of
the grill above its normal position. It is apparent that of the three
types of obstruction the kettle gave the highest ratio for all positions of the grill. the frying pan slightly les s and the plate the smallest
ratio. It will also be noted that for anyone obstruction the CO output
is about the same for the first 3/8 of elevation above the normal position, then cuts back sharply at grill positions between 3/8 and 7/8 above normal and is virtually no greater than for the unobstructed flame after the obstruction has been raised above the point of contact
with the flame tips. It is significant, however, that with a kettle half
full of water on the normal stove the CO output is ten times as much as with the open unobstructed flame before the kettle was placed on
the stove. An empty frying pan gave almost nine times the normal CO
output and a simple galvanized steel plate about five times the normal.
It is believed that the high thermal capacity of the obstruction, particularly
the half-filled kettle, was instrumental in "cooling" the flame and that this cooling of the flame and its environment promoted greater CO
production. It is significant that the placing of such an obstruction in
a flame can raise the COl CO
2 ratio of the appliance approximately
.01. This means that an appliance whose burner might normally operate
in the CO/C02 ratio range of .01 to .02 would be able, by the
intro-duction of a kettle, to exceed the limiting value of 0.02 set by the British Standards Institution.
CIGARETTE SMOKE TESTS
It was known that cigarette smoking in a poorly ventilated space
will increase the carbon monoxide content of the atmosphere. To obtain
some quantitative comparison with the CO output of the various ap-pliances, a single cigarette from a popular brand package and after-wards four similar cigarettes were lit and allowed to burn on a stand within the test room, followed by four cigarettes made by rolling machine
from a popular brand of tobacco. The initial CO/C02 ratios based on
the time of consumption were respectively 0.1000, 0.1650 and 0.2200,
similar in magnitude to the miniature charcoal stove. To carry the
test still further two men occupied the test room, each smoking a
package-type cigarette in a normal fashion. The CO and CO2 readings
and 0.04 per cent respectively to O. 0020 and 0.13 per cent. A further test of interest with regard to smoking was conducted with the same two persons merely occupying the room after having each just smoked
a cigarette outside. From original room conditions of 0.0002 per cent
CO and 0.05 per cent CO
2 the readings after 15 min of occupancy were
O. 0004 and 0.12 per cent respectively. The increase of 0.0002 per cent
carbon monoxide in the atmosphere after the two men entered is thought
to have been due to the gradual release of this gas from their blood
through the lungs, or pos sibly from their clothing. The possibility of
carry-over from absorption or adsorption of gases in the materials of
the room had been eliminated by prior ventilation. Thus the net effects
of the smoking were to raise the CO content from 0.0004 to 0.0020 per cent,
or an increase of 0.0016 per cent, and the CO2 from a difference of 0.07
per cent for normal breathing to a difference of 0.09 per cent with smoking, or an increase of 0.02 per cent.
LANTERN EXTINGUISHMENT TESTS
From preliminary tests involving kerosine -burning appliances in a mock-up of a fallout shelter (4), it was observed that the flame of a wick-type kerosine lantern, adjusted at first to burn properly with
adequate oxygen, would gradually diminish in size as oxygen was replaced with carbon dioxide during a test, and that the point of flame extinguishment
appeared to be when the CO2 concentration in the room reached approximately
3 per cent. Such a kerosine lantern could thus be used as a rough guide to
those in a fallout shelter during an emergency to indicate when the atmosphere
was in need of increased ventilation due to too high a CO2 accumulation.
To corroborate this observation of the flame extinguishment at about 3 per
cent CO
2 concentration, and to determine whether or not the carbon monoxide
content affected the point of flame extinguishment, a series of three tests
was run with relatively low CO, medium CO and high CO concentrations.
For the test with low CO, a pressure lantern was used (Figure 4); for medium
CO, a pressure burner stove; and for high CO, the same pressure burner
stove with a kettle of water. In all cases the appliances burned lighting
naphtha and the small "wick-type" lantern used for the tests burned special
kerosine. The concentrations of carbon dioxide at which the wick-type
lantern flame was finally extinguished where found to be 2.84, 2.85 and 2. 82 per cent, with corresponding carbon monoxide concentrations of
0.0023, 0.0053 and 0.0224 per cent respectively. In all three tests the
wick-type lantern flame was reduced to about
t
size with correspondingreduction in brilliance, at a CO
Experiments by Schaefer (5) show that in an atmosphere of 1. 5 per cent CO 2 the performance and basic physiological functions of human
subjects are not affected and that this level of CO2 can be tolerated for
prolonged periods. This is a much higher value than the usual maximum
allowable concentration (MAC) of 0.5 per cent for prolonged exposure.
Thus a kerosine -burning wick-type appliance such as a lantern could be used as a guide in an emergency shelter, giving a warning at half -flame that the limit of CO 2 toleration had been reached, for all situations in which the ratio of oxygen depletion to the carbon dioxide produced is roughly the same as for kerosine -burning appliances.
DISCUSSION OF RESULTS
There are a number of different appliances on the market for the use of campers and picnickers in the heating of small quarters such
as a tent or cabin and for cooking and lighting. Most of the se will do
the job intended by their designer and manufacturer. but some could be considered more dangerous than others from the standpoint of emission
of toxic gases. In general the amount of carbon dioxide will be in proportion
to the fuel burned and the carbon monoxide generated will be Ie s s when
the burner design is such that the fuel and air are properly mixed, vaporized and ignited and when the heat intensity of the combustion process is greater. Catalytic heaters would seem to be somewhat of an exception to this general rule.
In the case of catalytic combustion heaters it appears that little CO is given off when the appliance is operated at a low capacity. as can be obtained with a "slow" start using a limited amount of starting alcohol. But when ample alcohol is used for a "quick" start the ensuing fuel consump-tion may be doubled and a considerable amount of CO and unburned fuel may
be given off at the burner head. The lighted match test will easily prove
this. Of the three catalytic heaters tested one would be considered unsafe
by the standards of CO/C02 ratio used by the British Standards Institution
in connection with kerosine-burning heaters.
Of the kerosine -burning appliances the wick-type stoves gave lower CO/C02 production ratio than the pressure-type stove except at
reduced fuel rates. For overnight operation the larger heater such as
the reflective heater tested might be the best choice because of the larger fuel storage capacity, but low fuel rates should be avoided with this type of heater.
Of the two alcohol-burning appliances tested the wick-type heater
was superior to the vaporiser stove with all types of alcohol. The CO
output was between
*
andt
of that of the vaporiser -type except with pureisopropyl alcohol. a fuel which would not normally be available.
Of the gasoline - and naphtha -burning appliances - not including the catalytic cornbu st ion units - the pressure lantern and pressure burner
stove No 2 showed low CO output on either lighting naphtha or aliphatic
solvent regardless of CO2 concentration. The pressure-burner stove
No 1 when operating on its proper fuel. leaded gasoline, operated with low CO output except at the higher CO2 concentrations. Miniature stoves
performed well with reasonably low CO/C02 ratios.
The small picnic stove operating on LP gas showed a very low CO output. but its total heat capacit y was less than half that of a single burner
of the pressure-burner stoves. Thus if used as a space heater. the large
number of cartridges required to be equivalent in heat output to other appliances would make its operation costly.
The charcoal-burning stoves should be confined to outdoor operation or if used indoor s should be placed in a fir eplace so that the
products of combustion can be vented to the outdoors. The production of
CO is so large that even in a relatively large. well ventilated room the CO
concentration could easily reach the danger point. Their use in tents or
cabins should be prohibited unless special venting arrangements are made.
The alcohol jelly stoves. intended for short -term cooking like the LP gas cartridge stove are relatively expensive to operate but give a reasonably low CO/C02 ratio with an open flame.
In summary. there are many types of appliances on the market
which could be used for heating of relatively confined areas, most of which will operate satisfactorily and safely under ordinary circumstances. They will consume the fuel for which they were designed more or less
efficiently with little unburned fuel and, except for a few cases, with only
small amounts of carbon monoxide generated as long as oxygen supply is
adequate. The effect of reduced oxygen on the increased production of
carbon monoxide. is quite substantial, however, in s orrie models. the use
of which would require special precautions with regard to adequate ventilation. Certain models are known to consume a greater weight of fuel than can be
accounted for by calculations based on carbon dioxide production. Some
under ordinary atmospheric conditions, that is with no reduction in
oxygen concentration. Further study is necessary to determine a
simple method of measuring unburned fuel.
Another potential hazard with certain appliances with valve-operated fuel supply is that under conditions of reduced oxygen the rate of fuel supply might exceed the rate of fuel consumption and a fuel flooding situation could occur, presenting a distinct fire hazard.
Finally, there is the hazard from. carbon monoxide when cooking
operations are carried out with insufficient ventilation. Users should be
aware that an appliance that normally produces insignificant amounts of CO with an open and free flame can become a menace when the flame is
allowed to impinge upon a cooking vessel. Stoves which are designed for
partial immersion of the cooking utensil in the flame should be accompanied by a warning with respect to the use of the appliance within a tightly closed space.
If the manufacturer were able to supply figures for the normal fuel
burning rate and the CO/C0
2 production ratio of his products, it is
theoretically possible for the user to calculate the production rates for both carbon dioxide and carbon monoxide, using the method outlined in Appendix A, and, relating these to the size of the room or space to be heated, to calculate the ventilation rate necessary to stay within the
maximum allowable concentrations for the toxic gases. Unfortunately
it is very difficult to tell when one achieves such a ventilation rate in practice and it is doubtful if manufacturers would be able to supply meaningful figures for the CO/C0
2 ratio, especially when such ratio
could readily be upset by cooking operations. At the present stage one can
merely allow in a general way for the hazards of toxicity by increasing
ventilation when conditions are suspected to be critical. About the only
tangible guide is the flame of a wick-type appliance which will indicate roughly by its relative size the extent of oxygen depletion.
1. A. D. Kent and N. B. Hutcheon. Basement Fallout Shelter
Climate Studies, 1961. DBR Internal Report No. 243.
2. Specification for Kerosine, 3 -GP-3, 31 December 1963 of
the Canadian Government Specifications Board.
3. British Standard 3300: 1963 "Specification for Kerosine
(Paraffin) Un£1ued Space Heaters, cooking and boiling
appliances for domestic use, " published by the British
Standards Institution, London.
4. A. D. Kent and N. B. Hutcheon. Variations in Air
Temperature and CO 2 Concentration in a Heated Family
Fallout Shelter. DBR Internal Report No. 322. October 1965.
5. Schaefer, K. E. A Concept of Triple Tolerance Limits
Based on Chronic CO 2 Toxicity Studies. Proceedings of the meeting on Environmental Engineering in Protective
Shelters, 8, 9, 10 February 1960. National Academy of
SCHEDULE OF TESTS
(a) Kerosine -Burning Appliances
Double Flat Wick Stove (No.1, Figure 5)
1. Type 2 Special Kerosine
2. Type 1 (Standard) Kerosine
3. No. 1 (Stove) Oil
4.. No. 2 (Furnace) Oil
Circular Wick Stove (No.2, Figure 5)
5. Type 2 Special Kerosine
6. Type 1 (Standard) Kerosine
7. No. 1 (Stove) Oil
8. No. 2 (Furnace) Oil
Reflective Heater (No.3, Figure 5)
9. Type 2 Special Kerosine
10. Type 1 (Standard) Kerosine
11. No. 1 (Stove) Oil
12. No. 2 (Furnace) Oil
Pressure Burner Stove (No.4, Figure 5)
13. Type 2 Special Kerosine
14. Type 1 (Standard) Kerosine
15. No. 1 (Stove) Oil
16. No. 2 (Furnace) Oil
(b) Alcohol-Burning Appliances
Vaporizer Stove (No. 1, Figure 6)
17. Methyl Alcohol
18. Ethyl Alcohol
19. Methyl Hydrate
20. Isopropyl Alcohol (pure)
21. Isopropyl Alcohol (commercial)
Wick-Type Heater (No.2, Figure 6)
22. Methyl Alcohol
23. Ethyl Alcohol
24. Methyl Hydrate
25. Isopropyl Alcohol (pure)
(c) Gasoline -Burning Appliances
Pressure Burner Stove (No.1. Figure 7)
27. Lighting Naphtha
28. Aliphatic Solvent
29. Marine (white) Gasoline
30. Automobile (leaded) Gasoline
Pressure Burner Stove (No.2. Figure 7)
31. Lighting Naphtha
32. Aliphatic Solvent
33. Marine (white) Gasoline
34. Automobile (leaded) Gasoline
Pressure Lantern (No.3. Figure 7)
35. Lighting Naphtha
36. Aliphatic Solvent
37. Marine (white) Gasoline
38. Automobile (leaded) Gasoline
(d) Catalytic Combustion Heaters
(No.6. Figur e 7) 39. Lighting Naphtha 40. Aliphatic Solvent (No.4. Figure 7) 41. Lighting Naphtha 42. Aliphatic Solvent (No.5. Figure 7) 43. Lighting Naphtha 44. Aliphatic Solvent
(e) Miscellaneous Stoves
Stove (No.5. Figure 6)
45. L. P. Gas
Stove (No.3. Figure 6)
46. Jellied Alcohol
Stove (No.4. Figure 6)
47. Jellied Alcohol
Miniature Stove No. 1
Miniature Stove No. 2
49. Aliphatic Solvent
Charcoal Stove
INITIAL CO/CO
2 PRODUCTION RATIOS AND FUEL RATES FOR VARIOUS APPLIANCES AND FUELS
Special Kerosine Std. Kerosine No.1 (Stove) Oil No. ,(Furnace) Oil Full capacity セ capacity
!
capacity Full capacity Full capacity Full capacity CO/CO_ Fuel CO!C02 Fuel CO!C02 Fuel CO/CO2 Fuel CO/cq Fuel CO/CO Fuel ratio " rate ratio rate r atto rate ratio rate ratio rate ratio G rateIb/hr. Ib/hr. Ib/hr. Ib/hr. Ib/hr. Ib/hr.
Double flat wick stove .0046 .092 .0052 .060 .0072 .046 .0050 .058 .0036 .074 .0060 .062 Circular wick stove .0019 .253 .0019 .190 .0025 . 141 .0012 .2,1 .002, .245 .0013 .231 Reflective heater .0034 .278 .0061 .190 .0148 .145 .0032 .318 .0037 .180
*
.0048 .238 Pressure burner stove .0023 .258 .0020 .190 .002, .136 .0016 .269 .0014 .268 .0012 .290Methyl alcohol Ethyl.alcohol Methyl hydrate Isooroovl alcohol Jellied alcohol (Pure) ( Commercial)
Full capacity Full capacity Full capacity Full c apa city Full capacity Full capacity Vaporizer stove .0114 .345 .0030 .370 .0050 .370 .0027 .450 .0048 .450
-
-Wick-type heater .0028 .280 .0016 .252 .0017 .247 .0023 .186 .002,:; .239-
-No. 3 stove
-
-
-
-
-
-
-
--
-
.0023 .298No.4 stove
-
-
-
-
-
-
-
-
-
-
.0130+ .188Lighting naphtha Aliphatic solvent Marine (white) gasoline Auto (leaded) gasoline L. P. gas Charcoal Pressure burner stove No. 1 .0042 .325 .0039 .278 .0051 .267 .0012 .274
-
-
-
-Pressure burner stove No. 2 .0011 .400 .0013 .32<:: .0016 .2,0= .0017 .390
-
-
-
-Pressure lantern .0002 .124 .0005 .114 .0007 • 121 .0008 .126
-
-
-
-No. 6 catalytic heater .0014 .043
=
.0073 .106-
-
-
-
-
-
-
-No. 4 catalytic heater .0245 .117 .0220 .115
-
-
-
-
-
-
-
-No. 5 catalytic heater .0148 .216 .171 .263
-
-
-
-
-
-
-
-No.5 stove
-
-
-
-
-
-
-
-
.0004 .154-
-Miniature stove No. 1 .0010 .304
-
-
-
-
-
-
-
-
-
-Miniature stove No. 2
-
-
.0026 .330-
-
-
-
-
-
-
-Charcoal stove
-
-
-
-
-
-
-
-
-
-
.1620 .065Notes:
*
Estimated value Half capacityFigure 2. CO and CO 2 recording apparatus and temperature recorder.
II
.._._
-Figure 4. Lantern extinguishment
Figure 5. Kerosin e -burning appliances .
Figure
6.
Alcohol-burning appliancesheaters in foreground.
2
1
3
Figure 8. Catalytic combustion heaters with
'"
3.0I 3.0
SPECIAL KEROSINE oe STANDARD KEROSINE
a> '" ....I 2.8 2.8 <D
..
; ....I ...""
2.6 .... 2.6 --'" ... ....I""
UJ 2.4 '" 2.4 6 ::J ....I "- UJ oZ.2 0 ::J 2.2 - 0 0 "- ::::::
'" セ x2. 0 5セ x g2. 0 I X-
'" --'- ;::'" > ....I ... Iu.._ 0 " - I >':1.8 >-01.8 ZZjセ ::J ... a>> uu.. U >-0 .::J ...セQN 6 4 ::> a» 4 oU ... >-1.6 o U0 U ... 0 _a> "'0 2 " , 0 セ ... 1.4 o -1. 4 0..0 -- 0.. 0 UU '" NIX 2 "'0.. 0 00.. セセQNRM 30 GZNNNセ 1. 2 - U o u o u U 00 U 81.0 uU 1.0 0 U O.8 -CO/C02 Prod 00 ;:::: O.6""
",X BLセ O. 4 -8> ; >-O. 2 ua> 0 0 0 2 3 4 6 0 3 4 5 6TI ME, HOURS TIME, HOURS
3. 2 .----,....---...,...---...,....--...- - - r - - - - , 8 o o 2 IX S::r:x ;::IX u..::r: ::>;:: u"-4 .:::> o U o IX 0 ' 0.. 0 NIX _ 3 0 0.. U o U 5 4 3 TIME, HOURS 2 - 7 6 NO.2 (fURNACEI OIL
. . . . - - - . - - - - . - - - , r - - - - r - - - , - - - . 8 2.6 IX 3.2 :t: a:> 3.0 ....I セ 2.8
""
IX ....I '" セ Z.4 1.0 O. 8 o --'x セ .... 2.0 o ;;; > I.8 >-tl'-a:> W...I.6 z XセQNT -" , 0 o u 1., u o U 0 0 ;:::: O. 6""
" , x "'.... O. 4 0 0 u> - >- O. '-8a> o o -"'>< :r-'"
... :r u.._ ZZ^セ u 4 0;:; o " , 0 0..0 '" - 3 0""'-u o u - 6 4 3 TIME, HOURS 2 \ -- CO/ C0 2Prod Ratio \ NO.I (STOVE)oI L 2.2 o 2.8 2.6 2.4 3.0-2.0 1.8 1.6 0.2 0.8 0.6 0.4 ....I UJ ::> u.. '" ::r: a:> ....I セク >--'o >-> a:> >-tl'-a:> o o UJ ... ""'" o _ 0 ... 0 " , , -"'x "'....I 0 0 u> 0>-Ua:>""
SI'ECIAL KEROSINE eo CV2 Cone eo CO2Cone --' 2.8 --' 2.8 .: .... .... .... セNV « 2.6 « "" 0= --' 2.4 6 --' 2.4 6 .... .... => 0 => u.. "- 0 2.2 0 oZ. (. 0 0 セ 0 o=x 0 o=x 2. 0 :r --' : 2.0 :r --' x _ 0=-""
0--, セ]] 0>--' .... :ru.._ > 0 .... .... » 1.8 => "- ^セQNX =>"-co> u=> co> u =>
セ・ッ I.h 40·u If'.eo1.6 .4 0·u
Nセ Fuel Rate o · Nセ o .
セuGu 0 = 00..0 U 0 = 0
Z U'I. 4 0..0
0= 0=
O Z
C02 Prod NQ.. ° z Rate No..
u o 30 u o 0 ,-."u 1.2 .- uO NUI. 2 uO 00 u 0u O CO2 Prod u Uu 1.0 u 1.0 00 0.8 2 0.8 2 - 0 00 ....セ セ^\ \).6 ;::;:: 0.6 CO Cone --' CO Cone セク Gセo ;3> 0.4 N--' 0.4 0 0 CO Prod - > u >
°co --- CO/C02 Prod Ratio
u O.2 - > O.<:
°eo u
0 0
0 3 4 5 6 0 2 3 4 6
TI ME, HOURS TI ME, HOURS
0
3. 2 8 0 3.2 8
0= 3.0
NO.1 (STOVEIOll CO2 Cone "" 3.0 NO.2 (FURNACE) Oil
:r :r C02 Cone eo eo - ' 2.8 --' 2. 8 .... .: .... •. 6 - .... 2.6 «
""'
0= 0= --' 2. 4 \ - 6 --' 1.4 6 .... .... => \ 0 => u.. 2. 2 \ 0 "- 2.2 0;:: 0 \ セ 0 ;:: \""
0 0= x \ :rX セ --' se 2. 0 '- ;:::"" --'OX 2.0 :r- 0= 0 '- ,,-:r .... :r >-' "- >--' " -0 1.8 -,... :=; .... >0 1.8 =>::: » u ... co => eo> u > セ セ I. 6 => セcd 1.6 4o'u 4 o'u a 0u·lf'. C02 Prod o=c::i U'lf'. " , , 0
z • I. 4 0..0 Z . I. 4 0..0 OU Fuel Rate
""'"
a u 0= Uz 00.. u z No.. ",'a I.セ U o NO1.2 0 OU u OU Fuel Rate UOu u o Uo u 1.0 u 1.0 C02 Prod 0.8 2 O. 8 2 セ gO. 6 セ 00 6 ....セ CO Cone ....0 . « ᆱセ CO Cone 0= ><0 4 0= x 0.4 N--' . "'--'0 0 00 CO/C02 Prod Rati
u >0.2 CO Prod セ > 0.2
- > CO Prod
8
eo CO/C02 Prod Ratio 0>0 U eo 0
0 セ 3 4 6 0 3 4 6
TI ME, HOURS TI ME, HOURS
FIGURE 10 CIRCULAR WICK STOVE
CO2Cone '" セ 2' a> a> 2.8 - 7 ... 2.8 ... ....; SPECIAL KEROSINE LU
...
2.6...
2. 6 «: « 0:: 0:: ... 2.4 6 ... 2.4 6 LU LU ::> ::> 0 セ 0 セ 2. 2 <::> 4. •.: <::> -<::>-
<::> "'>< <::> セZ 2. 0 5 "'>< <::> 52'", ::t: ... - 2.0 -'" I-::t:> ... Fuel Rate ....I-::t:
-
0>< " セM>c;1.8
,
I-セ '; 1.8 ZZ^セ,
::> .... セ^"
U U,
" ::> r!'>- ::> 4 ·u .a>1.6 4 oU r!'>-1.6 "" Fu el Rate 0 a> o . Ur!' 0 セBLZQNT C02 Prod " , 0 セオᄋQNT 0::0 Q.o Q.O cc u z '" o u ""-[Gセ I.2 .. 0"'Q. セセ 1.2 - 3セ 0 CO Cone uo U Uo U OU CO Cone UI.0 U 0 I. 0 U 0 0 0.8 2 O. 8 - 0 I - _ セ^\ 0 ... 0.6 ;:: gO. 6 "'0 セ^ C.4 «:-'" >< O. 4 CO Prod ->- "'--' セ。^Ratio 00 CO/C0 2 Prod Ratio
O.c セ > O. 2
0>-0 U a> 0
0 2 3 4 6 0 3 4 6
TI ME, HOURS TI ME. HOURS
o o cc ::t: >< ;':::0:: .... ::t: ::>1-uu. .::> a U o " ' 0 ' Q.o ",a:: oQ. U o U 6 ... 7 - 2 I I 4 I I I Ralio I I I 2 3 TIME. HOURS I NO.2 (FURNACE) 01L I-_ CO/C02 Prod
17
C02 Cone セ CO Cone I IFuel Rate (appr ox l ':" C02 Prod 2.2 '" 3.0 -::t: セ 2.8-... 2.4 LU ::> ... ::; 3.2
r---...,,...---,.---...---...,..----..---...,
セ 2.6..,
'"
0.8 0 0 ;::::; 0.6 セ^\ "'C;0.4 0 > セ >- 0.2 0 " , U o ... ::; 2.0 -0>< > ...1.8 ->-0 a» r!'>-1.6 a> .:r!'I. 4 z o ' u セ 1. 2 .;'8 I - coProd uol.Of· U 2 6 o <::> -5 セ x ;:::'" ... ::t: ::>1-U .... 4 .::> a U o "'a Q.o",,,, oQ. U o U o 6 4 RatioNO.1 (STOVE) OIL
C02 Cone CO2Prod TIME. HOURS I ' / CO/C02 Prod
,
I I,,
I I I I I I I CO Prod I I I I I CO Cone " I,
I I I I I I I,
I I J I I I o Z. 2 セ 2.8 <::> 3. 2r---"'T'"----r-:----,----r---...,----, 8 '"::t: 3.0 ... 2.4 LU ::> .... セ 2.6..,
'" a U ">-1.6 a> セ .. 1.4 0::> U U BGセ I. { °uU o ;::gO. 6..,-:':0.4
00::> セ > 0.2 0>-U a>3. 2 - spセイNial KfROSINf 8 セ 3. 2 STANDARD KEROS INE 8
""
セ 3.0 flJeI Rate '" 3.0 .., -c ... CO 2 Prod 2.8 '" 2.8....
......
« CO2 Cone .... 2.6 ""... 2.6...
<r .... 6 cs 2.4 CO2Cone 6 ::> 2.4 0 ... 0 u- 0 .... 0 " , - ::> "'-2. 2 :>Ox u- 2. 2 CO Cone '::X 0 ..." , ::;:'" 0 5u..::: 0 2. 0 ::x: ...-
2.0 0 : : l -O x ::> ... ...-
オセ > Uu.. OX ... 1.8 .::> > 1.8 ci::> >-0 ClU ... " ' > 0 >-0 OU 1.6 4"" • " ' > 1.6 4 '" rf1>--Prod Ratio a.. Cl o,Cl
'" 0
rf1.>-'" ".p
Urf1. "''''
1.4 0 ' "
z 1.4 o a.. Urf1. ua..
o . U Z U u 0 o . 0 z 1.2 Cone 3 u u u 1.2 U " ' 0 Z O u " ' 0 u O u 0 1.0 u 1.0 . U 0 U O. 8 0.8 2 '::>0 0 0 - 0 ;::セ O. 6
...
-ex: '" セ '" '"BGセ 0.4 ","'" 0.4 セ^ 0 0 u > -;>- O. 2 '-;>-0.2 0 " , 0 " , u u 0 0 0 3 4 5 6 0 2 3 4 6TI ME. HOURS TI ME, HOURS
3. 2 8 0 3. 2 8
セ
-'"::x: 3.0 - '"::x: 3.0
'" 2.8 CO2 Cone '" 2.8
... ...
.: NO.1 fSTOVO OIL
....
NO.2 IFURNACEl OIL...
...
2.6 ex: ex: '" 2.4 - . 6 '" 2.4 6 ... ... ...., .... ::> ::> 2.2 u.. 2.2 u, 0 0 0 " , -0 0 セ セ 2. 0 .. 5 ::x:>< セ 2.0 cc ... --' :r: >< O x ..." , O x ..." , > ... 1.8 . U-:r > ...I.8 u..:r: >-0 ZZ^セ >-0 ::> ... " , > Uu.. " , > uu-rf1.>- 1.6- 4 -::> rf1.>- 1.6 - 4 .::> '" Cl U '" a u 0 0 Urf1. 1.4 '" . U # 1.4 '" . z Prod a.. Cl z 0 O ' 0 o - a.. 0 UU 1.2- 30"'::: u'-' 1.2 "'" z z .. oa.. NO Cone U o "'0 U o o u o u U o 1.0 . u u 0 I.0 - u U '-' O. 8 2 0.8 セッ 0 ... 0 ;:::50.6 « - « -ClC>< 1 <r '" "'... -- "' ... 0.4 -0 -0 0 0 Prod Ratio '-'> セ^ 0>- 0>-'-'''' '-'", 0 0 0 2 3 4 6 0 2 3 4 6TI ME. HOURS TI ME, HOURS
2. 8
LEGEN D
(See Fig. 15)
2. 6
2.4
0 02. 2
K...
><
...J2. 0
0 G>
>-
1.8
m
01.6
t-<:
0:::1.4
c 0 0:::1.2
0-N1.0
0u
-
00.8
u
O. 6
0.4
O. 2
H0
1
2
3
4
5
6
TI ME, HOURS
FIGURE
13
2 '":t: 3. 2 Fuel Rate Fuel Rate co 3. 0 - ' I ST0 Ker0sin e\ No.20il \\ SP Kerosine \ \ \ NO.IOil, \ " \ ..-lo--'-'..i'.i 2 CO
2CONCENTRATION. PER CENT o 0.8 ...; 2.8I I -セ 2.6 . Cl セ 0.6 0.. NO.4f o u O. 2セ[LL[[[[[[[セセセセセ]セ[[[[[[ZZZZZI[[。セセ o u I - 1.0 ..
..
ccDOUBU FLAT WICK STOVE
.. No.I ,-STD Kerosine NO.2 OiI No.I Oil 「NZセセZゥ\セZLLZZZNZZZZZエヲZM SP Ker0sin e
:--:::=----...
セᄋMnッN 2 Oil l-:>"'---r--_lSi>
Kerosine LSTO Kerosine I 2CO 2 CONCENTRATION. PER CENT 3.2 :t: co 3.0 -' ...., 2.8 I
-..
2.6 ce - ' 2.4 ...., ::> "- 2.2 '" 2.0 :::: 1.8 -' 1.6 0 > >- 1.4 co 0 1.2 I -..
1.0 cc O.8 Cl -0 O.6 o: 0.. N 0.4 0 u O.2 :::> u 0 1.8 '" 2.0 '" Special \ Kerosine7 ). 1 / , \"
ST0 Kerosine No.2 OiI NO.2 Oi I I 2CO2CONCENTRATION, PER CENT CO/C0 2 Prod Ratio
Fuel Rate Special -\.. k・イッセヲャNャA⦅ :--... MNMZMMMNZZMZMセBBBBLM
-⦅MMBキMセM⦅M\
MセMセMMMMM \ " \"
\ ',PRESSURE BURNER" ,STOVE \ \ \ \ \ \ \ \ \ \ \ \ \ \ ;I r \ "" o 3. 6 '" 3. 4 a: 3. 2 :t: co 3.0 -' .: 2.8 I-..
2.6 a: - ' 2. 4 ...., ::> "- 2. 2 1.4 -o I. 2 1.0 セ 1.6 > >-co o u l -e<: '" c 0.8 セ 0.6 -0.. NO.4 o uO.
RセM[[[[[[[[[[[[[セ[ZZZZZ[Zセセセ '" 2.0 -'" 1.8 REFLECTIVE HEATER I 2CO2 CONCENTRATION, PER CENT NO.2 0 iI o 1.4 CO/C0 2Prod Ralio Fuel Rate 2.8 2. 6 o u c5 1.6 > >-co o 1.2 :; 1.0 '" 0.8 -0.6 Cl o '" - Special Kerosine 0..NO. 4lZセZZZZZZZZZ]]]ZZZZZZZZZZZ]MBセ[ZZZZセ
:3
O. 2 [[ZMZZMZ[MLセLNZ[ZZ]セ FIGURE 14CO/C02 PRODUCTION RATIOS AND FUEL RATES
3
C B I2
PER CENT
1
CO 2 CONCENTRATION,
t-- K2. 8
2. 6
2.4
02. 2
0...
><2. 0
...J 01.8
>
>-
1.6
a ) 01.4
セ<
1.2
0:::: N1.0
0u
-
00.8
u
O. 6
0.4
0.2
0
A Double Flat Wick Stove H Pressure Lantern
Special Kerosine Lighting Naphtha
B Circular Wick Stove I Pressure Burner Stove (No.2)
Special Kerosine Lighting Naphtha
C Reflective Heater J No.6 Catalytic Combust. Heater
Special Kerosine Aliphatic Solvent
D Pressure Burner Stove K No.4 Catalytic Combust. Heater
Special Kerosine Aliphatic Solvent
E Vaporizer Stove L No.5 Catalytic Combust. Heater
Methyl Hydrate Aliphatic Solvent
F Wick-Type Heater M No.3 Stove - Jellied Alcohol
Methyl Hydrate N No.5 Stove - L. P. Gas
G Pressure Burner Stove (No.1) 0 No.4 Stove - Jellied Alcohol
Automobile Gasoline (Without Heat Intensifier)