RESEARCH OUTPUTS / RÉSULTATS DE RECHERCHE
Author(s) - Auteur(s) :
Publication date - Date de publication :
Permanent link - Permalien :
Rights / License - Licence de droit d’auteur :
Bibliothèque Universitaire Moretus Plantin
Dépôt Institutionnel - Portail de la Recherche
researchportal.unamur.be
University of Namur
Meta-analysis of archived DNA microarrays identifies genes regulated by hypoxia and
involved in a metastatic phenotype in cancer cells
Pierre, Michael; De Hertogh, Benoît; Gaigneaux, Anthoula; De Meulder, Bertrand; Berger,
Fabrice; Bareke, Eric; Michiels, Carine; Depiereux, Eric
Published in: BMC Cancer DOI: 10.1186/1471-2407-10-176 Publication date: 2010 Document Version
Publisher's PDF, also known as Version of record Link to publication
Citation for pulished version (HARVARD):
Pierre, M, De Hertogh, B, Gaigneaux, A, De Meulder, B, Berger, F, Bareke, E, Michiels, C & Depiereux, E 2010, 'Meta-analysis of archived DNA microarrays identifies genes regulated by hypoxia and involved in a metastatic phenotype in cancer cells', BMC Cancer, vol. 10, 176. https://doi.org/10.1186/1471-2407-10-176
General rights
Copyright and moral rights for the publications made accessible in the public portal are retained by the authors and/or other copyright owners and it is a condition of accessing publications that users recognise and abide by the legal requirements associated with these rights. • Users may download and print one copy of any publication from the public portal for the purpose of private study or research. • You may not further distribute the material or use it for any profit-making activity or commercial gain
• You may freely distribute the URL identifying the publication in the public portal ? Take down policy
If you believe that this document breaches copyright please contact us providing details, and we will remove access to the work immediately and investigate your claim.
Open Access
R E S E A R C H A R T I C L E
Bio
Med
Central
© 2010 Pierre et al; licensee BioMed Central Ltd. This is an Open Access article distributed under the terms of the Creative CommonsAttribution License (http://creativecommons.org/licenses/by/2.0), which permits unrestricted use, distribution, and reproduction in any medium, provided the original work is properly cited.Research article
Meta-analysis of archived DNA microarrays
identifies genes regulated by hypoxia and involved
in a metastatic phenotype in cancer cells
Michael Pierre
1, Benoît DeHertogh
1, Anthoula Gaigneaux
1, Bertrand DeMeulder
1, Fabrice Berger
1, Eric Bareke
1,
Carine Michiels
2and Eric Depiereux*
1Abstract
Background: Metastasis is a major cancer-related cause of death. Recent studies have described metastasis pathways.
However, the exact contribution of each pathway remains unclear. Another key feature of a tumor is the presence of hypoxic areas caused by a lack of oxygen at the center of the tumor. Hypoxia leads to the expression of pro-metastatic genes as well as the repression of anti-metastatic genes. As many Affymetrix datasets about metastasis and hypoxia are publicly available and not fully exploited, this study proposes to re-analyze these datasets to extract new information about the metastatic phenotype induced by hypoxia in different cancer cell lines.
Methods: Affymetrix datasets about metastasis and/or hypoxia were downloaded from GEO and ArrayExpress.
AffyProbeMiner and GCRMA packages were used for pre-processing and the Window Welch t test was used for processing. Three approaches of meta-analysis were eventually used for the selection of genes of interest.
Results: Three complementary approaches were used, that eventually selected 183 genes of interest. Out of these 183
genes, 99, among which the well known JUNB, FOS and TP63, have already been described in the literature to be involved in cancer. Moreover, 39 genes of those, such as SERPINE1 and MMP7, are known to regulate metastasis. Twenty-one genes including VEGFA and ID2 have also been described to be involved in the response to hypoxia. Lastly, DAVID classified those 183 genes in 24 different pathways, among which 8 are directly related to cancer while 5 others are related to proliferation and cell motility. A negative control composed of 183 random genes failed to provide such results. Interestingly, 6 pathways retrieved by DAVID with the 183 genes of interest concern pathogen recognition and phagocytosis.
Conclusion: The proposed methodology was able to find genes actually known to be involved in cancer, metastasis
and hypoxia and, thus, we propose that the other genes selected based on the same methodology are of prime interest in the metastatic phenotype induced by hypoxia.
Background
One of the major causes of death by cancer is metastasis. Determining the mechanisms of metastasis initiation and growth should thus improve therapy. Cancer cells have developed many mechanisms to detach from the primary tumor, invade surrounding tissues, migrate and colonize distant organs. These mechanisms include changes in cell-cell and cell-matrix adhesion molecules, extracellular
matrix degradation enzymes, cytoskeleton regulation fac-tors and cell-cell communication through cytokines, for example [1]. Recently, high-throughput studies per-formed in several cancer cell lines identified specific metastasis pathways [2]. However, the exact contribution of these pathways in cell migration and tissue invasion still remains unclear.
Another key feature of a tumor is the presence of hypoxic areas. Hypoxic areas within a tumor are the result of the progressively increasing distance between cells and blood vessels as the tumor is growing, as well as of the abnormal new vasculature. Tumor hypoxia is a
* Correspondence: [email protected]
1 Molecular Biology Research Unit (URBM), University of Namur - FUNDP, Namur, Belgium
marker for poor prognosis. Several hypotheses have been proposed to explain this observation: (i) hypoxia initiates adaptation mediated by the transcription factor HIF-1 which enhances cancer cell survival [3]; (ii) this adapta-tion also triggers the angiogenesis process; (iii) hypoxia leads to less effective radiotherapy and chemotherapy [4] and (iv) more and more experimental data suggest that hypoxia improves metastasis and/or selects cancer cells with high metastatic potential [5]. Changes in gene expression induced by hypoxia and leading to a migratory and invasive phenotype of tumor cells have been identi-fied. The genes involved code for example for cadherins, plasminogen activators and their receptors, and matrix metalloproteinases [6].
DNA microarrays appeared more than a decade ago and are now one of the most common tools in many molecular biology and medical laboratories. The tech-nique allows the assessment of transcript levels for thou-sands of genes in one single experiment. Nowadays, thanks to progress in sequencing, an entire genome can be represented on one single microarray [7,8]. In short, a microarray is a physical support to which oligonucle-otides (the probes) representing the genes are attached. Then, the labelled mRNAs from a biological sample are incubated with the microarray, thus enabling the labelled mRNAs to hybridize to the probes. The signal is then scanned and several experimental conditions are com-pared to determine which genes are differentially expressed under a particular condition. Microarrays can differ in the way the probes are attached to the surface, in the length of the probes and in the number of probes per gene, but the principle is always the same.
Affymetrix GeneChips are the most popular type of microarrays. Affymetrix GeneChips display probes that are synthetized in situ by photolithography [9]. Typically, each gene in a genome is represented by 11 to 20 perfect match probes of 25 nucleotides and by the same number of mismatch probes differing only in the central nucle-otide [10].
Since their release, Affymetrix GeneChips and DNA microarrays in general have encountered many difficul-ties. The first derives from the fact that if there is only one replicate per condition, no statistical test can be per-formed at the gene level. Results thus only rely on ratio (fold change) between expression values obtained from different conditions [11]. On the other hand, when sev-eral replicates are available, the question can be addressed from a statistical point of view [12]. As one sta-tistical test is performed for each gene, thousands of tests are performed on a single array. This leads to a very large number of false positives (genes detected as differentially expressed when they are not) and false negatives (genes undetected when they are actually differentially expressed), compromising interpretation of the results
[13]. When applied, a correction for multiple testing decreases the threshold of significance at such a low level that the number of false negatives increases dramatically. Many statistical methods have recently emerged to solve this problem, from the classical Student t-test [14] to more sophisticated tests which fine-tune the estimate of gene variance [15-20]. However, the problem still remains fundamentally unsolved and a large number of expensive replicates are needed to gain in positive and negative pre-dictive power.
Another issue tackled over the past few years concerns the Chip Definition File (CDF), which is involved upstream of the statistical analysis. A CDF is a file devel-oped by Affymetrix that links several probes (probe set) to a given gene name. The probes representing the gene reflect the status of genomic databases several years ago. Since then, genomic information and thus the arguments used to assign given probes to a given probe set have evolved and "alternative" CDFs have emerged [21-23].
Other steps before the statistical processing itself con-cern pre-processing of the data. Pre-processing steps include background correction within each array of a same experiment, normalization (rescaling) of values between replicates [24-26] and summarization of probe values to obtain a unique expression value per probe set [27]. Scores of methods are available for each pre-pro-cessing step [28,29] and a combination of these methods can potentially generate thousands of pre-processings.
A technique's lack of biological reproducibility is not the least of the problems encountered in DNA microar-ray experiments [30]. Few genes are common to the top gene lists from several experiments, even between sub-samples of a same large dataset. Due to the small number of replicates generally used in an experiment and the very large number of genes tested, varying variance estimates lead to differences in the p values associated with any sta-tistical test such that a given gene can randomly move from the first to the thousandth place in the top list.
The fact that there are numerous methods which con-tinue to evolve, combined with the observation of unsta-ble results, constitutes an attractive challenge which can now be tackled thanks to the emergence of public data-bases such as Gene Expression Omnibus (GEO) [31] and ArrayExpress [32] which collect millions of pieces of expression data. Datasets can be reanalysed from scratch with new parameters (including alternative CDFs) and by combining several datasets relative to the same biological question in one same analysis.
In this study we have tried to find genes, and possibly pathways, that were not previously known to be involved in the metastasis induced by hypoxia. The objective of this paper is to increase our understanding of the disease using new methods to exploit the huge amount of DNA microarrays publicly available. Since the mechanisms
underlying the metastatic phenotype are identical in every cancer cell type [33], this work considered all data-sets on metastasis, regardless of the cancer cell type. Our methodology combines well-known published steps from classical analysis with new approaches to analyze several datasets at once. A similar study performed at a smaller scale on breast cancer has been published recently [34], thus validating the feasibility of this type of approach.
Methods
Datasets
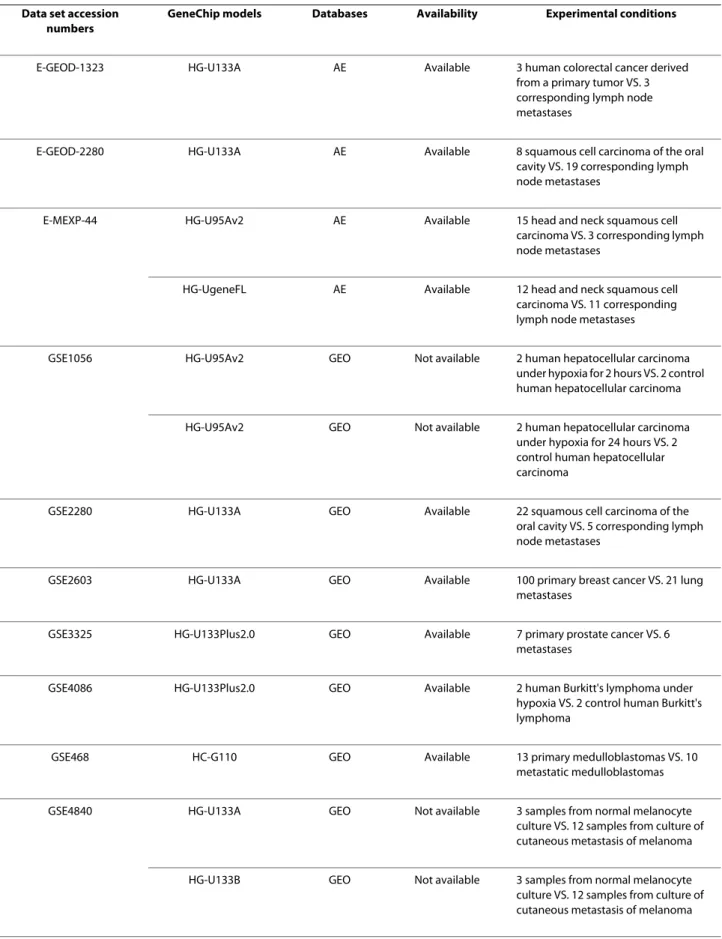
All the datasets used in this study were downloaded from two databases (ArrayExpress [32] and Gene Expression Omnibus [31]) and are all generated with Affymetrix platforms. Most of the raw data in .CEL files format were publicly available. If not, the authors were contacted directly. Datasets containing more than one GeneChip model and/or containing more than two conditions were split into sub-datasets. Table 1 presents detailed informa-tion about these datasets.
Individual analyses
To process the datasets, we used alternative CDFs from AffyProbeMiner [23]. One CDF is needed per GeneChip model and three packages are needed per CDF. We used Version 1.8.0 of the "CDF distribution" packages. We used Version 1.0.0 of the "PROBE distribution" packages. We used Version 1.1.0 of the "Annotation distribution" packages. The CDFs used were "transcript-consistent", so each probe of a probe set maps to the same set of tran-scripts. We did not choose "gene-consistent" CDFs (probes of a probe set mapping to transcripts of the same set of genes) to avoid inconsistencies as recommended by Liu et al. [23]. The CDFs were chosen based on RefSeq and GeneBank information. The minimal size of a probe set was set to five probes as recommended by Liu et al. [23]. Pre-processing was performed with GCRMA [29] with the default parameters. Processing was performed with the Window Welch t test [35]. Due to a low number of conditions or of replicates to be statistically useful, datasets GSE4843 and GSE6369 could not be analyzed individually.
These individual analyses provided one gene list for each dataset or sub-dataset. For each gene list, we ranked the genes in ascending order of the p values of their dif-ferential expression, such that the most significantly over-or under- expressed genes are located at the top of the list.
Intersections
The results from the individual analyses were grouped into 33 groups. For each group, the 50 most significant genes common to all datasets of the group were selected.
Union intersections
The results from the individual analyses for the 17 metas-tasis datasets were grouped into 30 groups, while the results from the individual analyses for the 3 hypoxia datasets were grouped in one group. Each metastasis group was considered with the hypoxia group. For each couple of groups, the 50 most significant genes common to at least one dataset of the metastasis group and to at least one dataset of the hypoxia group were selected.
Meta-analyses
The 22 datasets were merged into 14 meta-datasets. Alternative CDFs from AffyProbeMiner [23] were used. The meta-datasets were pre-processed with GCRMA [29] and processed with the Window Welch t test [35]. For each meta-dataset, the 50 most significant genes were selected.
Visualization
Genes were thus selected by three approaches: intersec-tions, union intersections and meta-analyses. Some were selected by two or three approaches. Those particular genes were submitted to the webtool DAVID (Database for Annotation, Visualization and Integrated Discovery) [36,37], version 6. The parameters of the "Functional Annotation Tool" were set to retrieve pathway maps from KEGG [38] and Biocarta [39]. And the parameters of the "Functional Annotation Clustering" (a part of the "Func-tional Annotation Tool") were set to the lowest level of stringency in order to obtain the largest number of maps.
Computer and bioinformatic resources
Individual analyses, intersections, union intersections and meta-analyses were all run with the R statistical soft-ware [40] versions 2.4.0 and 2.6.0 and packages from Bio-conductor [41] on a 64-bit computer with 4 gb of DDR (biprocessor dual-core Xeon 5160 3.0 Ghz, 8 × 500 gb RAID). Detailed scripts for every approach are provided as additional files (additional files 1, 2, 3, 4 and 5). How-ever, brief descriptions for the individual analyses, inter-sections, union intersections and meta-analyses are provided here.
For each individual analysis, expression sets were obtained with the function justGCRMA (with default parameters) from the GCRMA [29] package. The
expres-sion sets were converted into a matrix with the function exprs, then split in two: condition A and condition B. P values were calculated with the Window Welch t test [35] with the pegase function from the Pegase package. Pegase is a package created by our laboratory that is not yet pub-licly available. Its function is to process microarray data after pre-processing. It requires an expression set as input and returns lists of p values for every well-known pro-cessing method as output. Here, pegase was run with
Table 1: The datasets retrieved from GEO and ArrayExpress
Data set accession numbers
GeneChip models Databases Availability Experimental conditions
E-GEOD-1323 HG-U133A AE Available 3 human colorectal cancer derived from a primary tumor VS. 3 corresponding lymph node metastases
E-GEOD-2280 HG-U133A AE Available 8 squamous cell carcinoma of the oral cavity VS. 19 corresponding lymph node metastases
E-MEXP-44 HG-U95Av2 AE Available 15 head and neck squamous cell
carcinoma VS. 3 corresponding lymph node metastases
HG-UgeneFL AE Available 12 head and neck squamous cell carcinoma VS. 11 corresponding lymph node metastases
GSE1056 HG-U95Av2 GEO Not available 2 human hepatocellular carcinoma under hypoxia for 2 hours VS. 2 control human hepatocellular carcinoma
HG-U95Av2 GEO Not available 2 human hepatocellular carcinoma under hypoxia for 24 hours VS. 2 control human hepatocellular carcinoma
GSE2280 HG-U133A GEO Available 22 squamous cell carcinoma of the
oral cavity VS. 5 corresponding lymph node metastases
GSE2603 HG-U133A GEO Available 100 primary breast cancer VS. 21 lung metastases
GSE3325 HG-U133Plus2.0 GEO Available 7 primary prostate cancer VS. 6 metastases
GSE4086 HG-U133Plus2.0 GEO Available 2 human Burkitt's lymphoma under hypoxia VS. 2 control human Burkitt's lymphoma
GSE468 HC-G110 GEO Available 13 primary medulloblastomas VS. 10
metastatic medulloblastomas
GSE4840 HG-U133A GEO Not available 3 samples from normal melanocyte culture VS. 12 samples from culture of cutaneous metastasis of melanoma
HG-U133B GEO Not available 3 samples from normal melanocyte culture VS. 12 samples from culture of cutaneous metastasis of melanoma
default parameters. Fold changes were also calculated in the individual analyses.
A data frame was built for each dataset. The resulting
data frames contained the AffyProbeMiner's probe set IDs for every probe set of the chip. They also contained the Entrez Gene IDs [42] corresponding to the probe sets as well as the p values and the fold changes. Since several Entrez Gene IDs can sometimes correspond to the same probe set, these particular probe sets as well as the corre-sponding p values and fold changes were repeated in the
data frames with a different Entrez Gene ID each time. For each data frame, the probe sets (and therefore the gene IDs and the fold changes) were ranked in ascending order of the p values of their differential expression. Intersections were created with the intersect func-tion applied to the top lists of data frames previously described. For groups of datasets where only one GeneChip model was used, intersections were created at the probe set level. But for groups of datasets where sev-eral GeneChip models were used, intersections were cre-ated at the gene ID level.
Since the group of hypoxia datasets was built with two GeneChip models and was involved in every union
inter-section, union intersections were all created at the gene ID level. For each union intersection, gene IDs of the top lists of metastasis data frames were combined into a vec-tor and gene IDs of the top lists of hypoxia data frames were combined into another one. Then, the intersect function was applied to those two vectors.
For meta-analyses, expression sets were obtained with the justGCRMA function (with default parameters). The
expression sets were converted into a matrix with the exprs function, then split in two: condition A and con-dition B. P values were calculated with the Window Welch t test [35] (with default parameters) with the
pegase function. The probe sets were then ranked in ascending order of the p values of their differential expression, and the 50 most significant ones were selected.
Results and discussion
DNA microarrays and particularly Affymetrix GeneChips are widely used to measure the transcriptome of samples. Since the raw data can now be stored in numeric format, public databases have appeared and re-analysis of archived datasets has become common
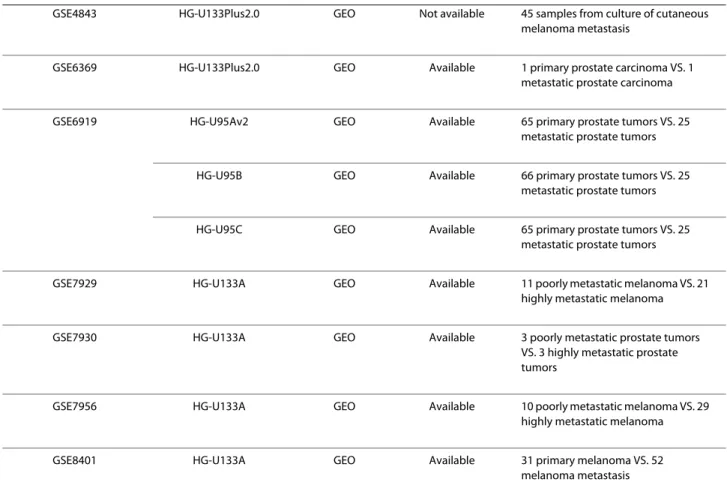
prac-GSE4843 HG-U133Plus2.0 GEO Not available 45 samples from culture of cutaneous melanoma metastasis
GSE6369 HG-U133Plus2.0 GEO Available 1 primary prostate carcinoma VS. 1 metastatic prostate carcinoma
GSE6919 HG-U95Av2 GEO Available 65 primary prostate tumors VS. 25 metastatic prostate tumors
HG-U95B GEO Available 66 primary prostate tumors VS. 25 metastatic prostate tumors
HG-U95C GEO Available 65 primary prostate tumors VS. 25 metastatic prostate tumors
GSE7929 HG-U133A GEO Available 11 poorly metastatic melanoma VS. 21 highly metastatic melanoma
GSE7930 HG-U133A GEO Available 3 poorly metastatic prostate tumors VS. 3 highly metastatic prostate tumors
GSE7956 HG-U133A GEO Available 10 poorly metastatic melanoma VS. 29 highly metastatic melanoma
GSE8401 HG-U133A GEO Available 31 primary melanoma VS. 52
melanoma metastasis The GEO or ArrayExpress accession numbers with the corresponding GeneChip model and the experimental conditions. Table 1: The datasets retrieved from GEO and ArrayExpress (Continued)
tice. Moreover, an increasing number of articles describe analyses combining several datasets. Specific methodolo-gies for such meta-analyses are even published regularly [43-45]. While some of them are large-scale meta-analy-ses, others target more specific issues especially in the field of oncology. Here, we also provide a strategy for the meta-analysis of specific archived datasets, but the origi-nality of this work is that it combines two different, but intimately related, biological processes: metastasis and hypoxia.
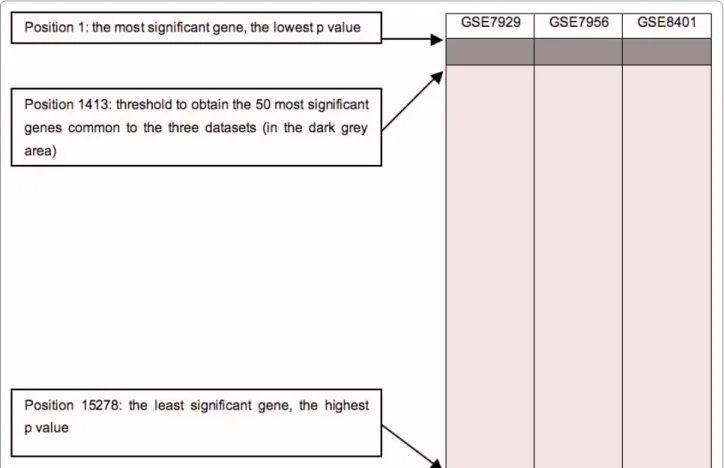
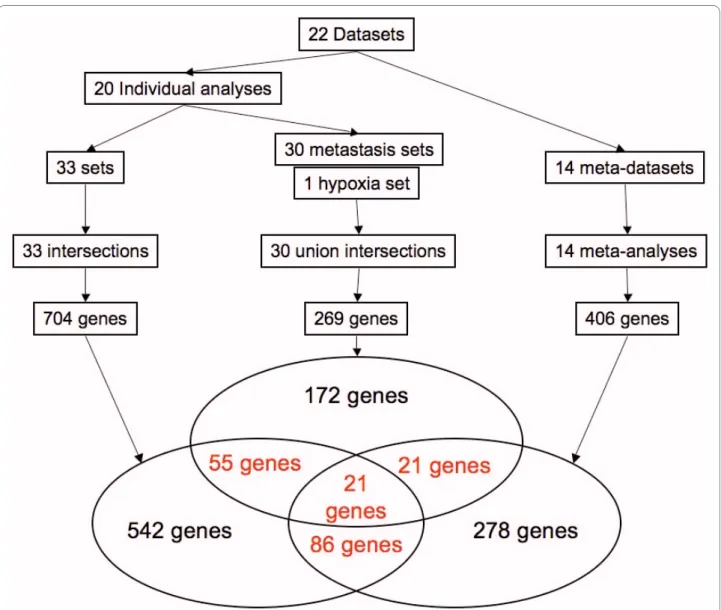
After individual analysis of the datasets retrieved from GEO [31] and ArrayExpress [32] (table 1), the results were combined in an approach called intersections. At each intersection, the 50 most significant genes common to several datasets were selected (figure 1). This arbitrary limit actually represents our upper limit for future in vitro validations. Like all statistical thresholds, this figure is arbitrary and is an attempted compromise. Indeed, a higher threshold would generate a number of genes that would be more difficult to interpret. Moreover, a higher threshold would lead to the selection of genes that are not statistically significant in the individual analyses. On the other hand, a lower threshold would allow for selection of a number of genes that would be easier to validate further and more statistically significant, but would also lead to a larger number of false negative genes. Thus, the threshold of 50 genes allows biological interpretation without selecting non significant genes. Since 33 different inter-sections were designed (Additional file 6), 1650 (33 × 50) different genes could potentially be selected. However, only 704 unique occurrences were obtained because some of them appeared in two or more lists. One advan-tage of this approach is that it uses the results from differ-ent GeneChip models. However, only few genes are common to all GeneChip models. For example, in this study, 8 GeneChip models were used but only 29 genes are represented on all 8 GeneChip models. This is due to some GeneChip models like HC-G110, U133B, HG-U95B and HG-U95C in which few and/or poorly charac-terized genes are represented. So, intersections combin-ing a large number of GeneChip models need to take a large number of genes into account to obtain the 50 most significant genes common to all the datasets considered.
A second approach combining the results from the individual analyses was the union intersections. By this approach, the 50 most significant genes common to at least one metastasis dataset and to at least one hypoxia dataset were selected at each union intersection. Thirty different union intersections were designed (Additional file 7), each combining a group of metastasis datasets and a group of hypoxia datasets. This approach ensures that every combination of results from the individual analyses takes the hypoxia datasets into account. This step was necessary since fewer hypoxia datasets than metastasis
datasets were available. Moreover, union intersections do not require that a large number of genes be taken into account to obtain the 50 most significant genes as fewer are required for a gene to be selected. Out of the 1500 (30 × 50) possible genes, 269 unique occurrences were obtained.
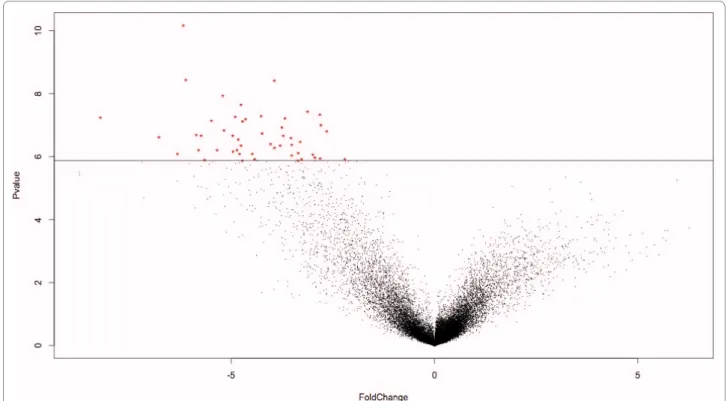
The last approach, called meta-analysis, was not based on the results from the individual analyses. Here, several datasets were merged into single datasets to artificially increase the number of replicates and thus increase the statistical power. Fourteen meta-datasets were designed (Additional file 8). A regular analysis was run on each meta-dataset and the 50 most significant genes were selected (figure 2). Since the meta-analyses were run from scratch, only datasets using the same GeneChip model could be combined. Again, a certain number of genes were present in more than one list: hence, meta-analyses provided 406 different genes out of the 700 (14 × 50) possible genes.
The genes selected by these three approaches are repre-sented in a Venn's diagram (figure 3). The 183 genes selected by more than one approach are considered as the genes of interest. They are listed in the Additional file 9. As six datasets or sub-datasets contain data obtained from melanomas and six others are from the prostate, two supplementary Venn's diagrams have been built based only on these datasets or sub-datasets (additional files 10 and 11). They highlight some genes within the 183 genes of interest. It is interesting to note that, even when half of the datasets are taken into account, so few genes are selected. This shows that the methodology is enriched by the number of datasets and thus by the diver-sity of information. Interestingly, 99 of the 183 genes of interest are described in the literature to be involved in cancer (figure 4, Additional file 9). For example, the methodology was able to find genes such as JUNB, FOS and ATF3, all members of the AP-1 complex. AP-1 is a transcription factor involved in cell proliferation and dif-ferentiation. It has often been described as a "double-edged sword" since its effect can be the repression as well as the promotion of tumorigenesis [46]. Indeed, AP-1 transcription factors are dimers composed of the JUN, FOS and ATF protein families. Depending on the exact AP-1 composition, it promotes or represses tumorigene-sis. JUNB acts as a repressor of cell proliferation through its repression activity on the cyclin D1, an essential ele-ment in the cell cycle [47,48]. On the contrary, FOS and ATF3 induce oncogenic transformation [49]. Another well-described gene in cancer selected by the methodol-ogy is TP63. TP63 is a transcription factor sharing a large degree of homology with TP53. It is involved in the devel-opment of stratified epithelial tissues [50]. TP63 has two different promoters and is the target of alternative splic-ing events leadsplic-ing to the existence of several isoforms.
For example, TAp63 is a tumor suppressor while ΔNp63 is an oncogene since it antagonizes TAp63 [51].
Of the 99 genes known to be involved in cancer, 39 have been described to regulate metastasis (figure 4, Addi-tional file 9). For example, the gene SERPINE1, coding for plasminogen activator inhibitor 1 (PAI-1), was selected by the methodology. SERPINE1 plays a central role in several key steps of metastasis. First, it is able to catalyse degradation of the extracellular matrix to allow penetra-tion of metastatic cancer cells into tissues. Second, when PAI-1 is bound to the plasminogen activator, it is able to modulate cell adhesion by decreasing its affinity for vit-ronectin and increasing its affinity for endocytic recep-tors, thus enabling cell migration. Moreover, SERPINE1 enhances cell proliferation [52]. Another example of a gene selected by the methodology and well described as involved in the metastatic process is the gene coding for matrix metalloproteinase 7 (MMP7). Matrix metallopro-teinases are enzymes that cleave the extracellular matrix in normal processes such as morphogenesis, angiogenesis and tissue repair. It was also often described in recent years to be involved in cancer processes such as tumori-genesis, invasion and metastasis [53-55].
Lastly, 21 genes of the 183 selected by the methodology are linked to hypoxia (figure 4, additional file 9). VEGFA is probably the best example of such a gene selected by the methodology. VEGFA has been largely described to act on endothelial cells to promote the development of vasculature in embryos. Moreover, through the transcrip-tion factor HIF-1, hypoxia induces the productranscrip-tion of VEGFA to stimulate angiogenesis in newly-formed organs. The same mechanisms are triggered during tumor growth. Indeed, when the tumor size increases, it becomes hypoxic, thus leading to the stabilization of HIF-1 that promotes the transcription of VEGFA. VEGFA then stimulates angiogenesis in the tumor [56,57]. ID2 is another example of genes selected by the methodology and known to be responsive to hypoxia. ID2 belongs to the family of ID proteins which are transcriptional regu-lators that inhibit basic helix-loop-helix transcription fac-tors in processes such as proliferation, differentiation, development and angiogenesis. It is interesting to note that ID2 is able to inhibit VEGFA and thus limit metasta-sis [58]. Surprisingly, however, ID2 is a target of HIF-1 since there are two HIF-1 binding sites within ID2 gene regulatory sequences. Besides, studies have shown that
ID2 expression is induced under hypoxic conditions [59].
Figure 1 Example of an intersection. In each dataset, the probe sets were ranked in ascending order of the p values. The dark grey area is where
Another strong argument in favor of the proposed methodology is the ability of DAVID [36,37] to classify 179 of the 183 genes in 24 different pathways. It is note-worthy that 8 of these pathways are clearly involved in cancer (table 2). For example, "glioma" was one of the pathways retrieved by DAVID [36,37]. Gliomas are can-cer which initiate with the oncogenic transformation of a brain or spinal cord cell. There are several types of gliomas which vary in the type of cell transformed. The most common types are those which affect ependymal cells, astrocytes and oligodendrocytes [60]. Another example is "prostate cancer". Prostate cancer is one of the most frequent types of cancer in men. It often develops in patients over the age of 50. This type of cancer is subject to metastasis, particularly in the bones and lymph nodes [61]. "Colorectal cancer" was also retrieved by DAVID [36,37]. This type of cancer is also one of the most com-mon and one of the main cancer-related cause of death. Oncogenic transformation occurs in the adenomatous polyps in the colon and cancer cells can metastasize to the liver, principally [62].
Five other pathways retrieved by DAVID [36,37] are related to proliferation and cell motility (table 2): "focal adhesion", "MAPK signalling pathway", "VEGF signalling pathway", "ErbB signalling pathway" and "regulation of actin cytoskeleton". The focal adhesions are macromolec-ular structures at the contact points between the cell and the extracellular matrix [63]. They enable tissue
remodel-ling, cell migration and embryogenesis through regula-tion of the structure of the cytoskeleton, cell adhesion sites and membrane protrusions [64]. The mitogen-acti-vated protein kinase (MAPK) signalling pathway is a cas-cade involved in the regulation of cellular processes such as cell proliferation, differentiation and stress response [65]. This regulation occurs through the phosphorylation of key proteins in these processes [66]. The VEGF signal-ling pathway is activated to ensure proliferation and migration of endothelial cells during normal processes such as vasculogenesis as well as pathological processes such as tumor growth [67]. The ErbB signalling pathway is actually composed of several transmembrane receptors able to trigger several signalling pathways when they bind to an extracellular growth factor molecule. These signal-ling pathways themselves regulate biological processes such as proliferation, differentiation, cell motility and sur-vival [68,69]. The regulation of actin cytoskeleton includes mechanisms which allow for the functions of microfilaments. Microfilaments are responsible for cell shape, intracellular transport and cell motility [70].
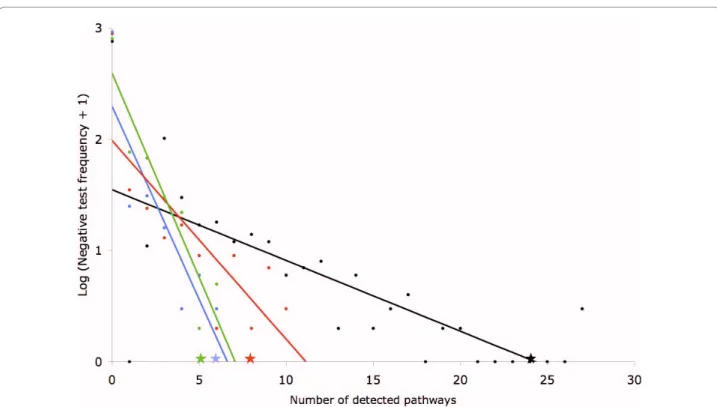
As a first negative control, 183 genes were randomly selected. Only 62 of those random genes were found in the literature to be involved in cancer, among which 11 are described to regulate metastasis and 8 are linked to hypoxia. And as a second negative control, 1000 selec-tions of 183 random genes were run. These 1000 lists of random genes were submitted to DAVID to see how
Figure 2 Result of a metaanalysis. The 50 most significant genes were selected in each volcano plot (log2 of the fold changes on the X axis and
many pathways would be highlighted by chance. This was done for the total number of pathways, for the number of pathways directly involved in cancer and for the number of pathways involved in proliferation and cell motility (figure 5). For the total number of pathways, only two tests gave better results than the 183 genes of interest selected by the methodology. For the number of pathways directly involved in cancer, only nine tests gave equal or better results than the 183 genes of interest selected by the methodology. Lastly, for the number of pathways involved in proliferation and cell motility, only five tests gave equal or better results than the 183 genes of interest selected by the methodology. This indicates that the probability of obtaining the results observed with the 183 genes of interest by chance is between 0,01 and 0,001. Taken together, these results indicate that the
methodol-ogy is able to find genes actually involved in a particular biological process or even genes involved in a combina-tion of processes (here metastasis and hypoxia).
Since the data on the involvement of the genes of inter-est in cancer, metastasis and hypoxia support the meth-odology, we propose that the 84 genes (183 - 99) not known to be involved in cancer to be good candidates for involvement in development of the cancer and in particu-lar in metastasis induced by hypoxia. Obviously, further analyses are required. However, it is already interesting to note that 6 out of the 24 pathways retrieved by DAVID [36,37] concern pathogen recognition and phagocytosis (table 2): "pathogenic Escherichia coli infection - EPEC", "pathogenic Escherichia coli infection - EHEC", "toll-like receptor signalling pathway", "fMLP induced chemokine gene expression in HMC-1 cells", "Fc epsilon receptor I
Figure 3 Summary of the methodology. The 22 datasets (or sub-datasets) were used to build several combinations in order to run intersections,
union intersections and meta-analyses. These three approaches provided 704, 269 and 406 genes respectively. A Venn's diagram was then generated using this data.
signalling in mast cells" and "T cell receptor signalling pathway". Thus, we decided to further examine the genes in these pathways and their involvement in cancer, metas-tasis and hypoxia.
Enteropathogenic Escherichia coli (EPEC) and entero-hemorrhagic Escherichia coli (EHEC) are two pathogens characterized by their ability to cause attaching and effac-ing lesions. This ability is mainly encoded by the locus of the enterocyte effacement pathogenicity island which includes four genes: Tir, Map, EspF and EspG. Interest-ingly, Tir codes for a protein that allows for the accretion of actin [71]. This pathway is thus related to regulation of the actin cytoskeleton pathway identified by the method-ology. These three pathways ("pathogenic Escherichia coli infection EPEC", "pathogenic Escherichia coli infection -EHEC" and "regulation of actin cytoskeleton") could be activated in metastasis to enable rearrangement of the cytoskeleton and migration of the cell.
The toll-like receptor signalling pathway is composed of a set of receptors able to recognize specific molecules
from pathogens. This recognition results in an innate immune response by the activation of inflammatory genes. However, every receptor is specific to a particular signal and triggers a specific cellular response, so the functions of the different toll-like receptors are not redundant [72]. "fMLP-induced chemokine gene expres-sion in HMC-1 cells" is a pathway activated in neutrophils when a bacterial infection occurs. This pathway activates NADPH oxidase that produces reactive oxygen species to kill the bacteria. It also activates genes coding for chemokines to attract other innate immune cells to fight the infection [73]. "Fc Epsilon Receptor I Signalling in Mast Cells" is a defence pathway against some parasites. When activated, mast cells can trigger inflammation [74]. The "T Cell Receptor Signalling Pathway" is a pathway activated when a T Cell Receptor binds to a peptide from a foreign organism. This event activates T cells and immunity [39].
Surprisingly, these pathways have no link with cancer, metastasis or hypoxia, but were identified by our
meth-Figure 4 Number of genes involved in processes of interest. After the data mining in the literature, the 183 genes of interest were classified in
several categories (light blue: known to be involved in hypoxia, red: known to be involved in cancer and hypoxia, yellow: known to be involved in cancer, green: known to be involved in cancer and metastasis, dark blue: known to be involved in cancer and metastasis and hypoxia, orange: not known to be involved in cancer or metastasis or hypoxia) in function of the combination of approaches (I for intersections, UI for union intersections and MA for meta-analyses).
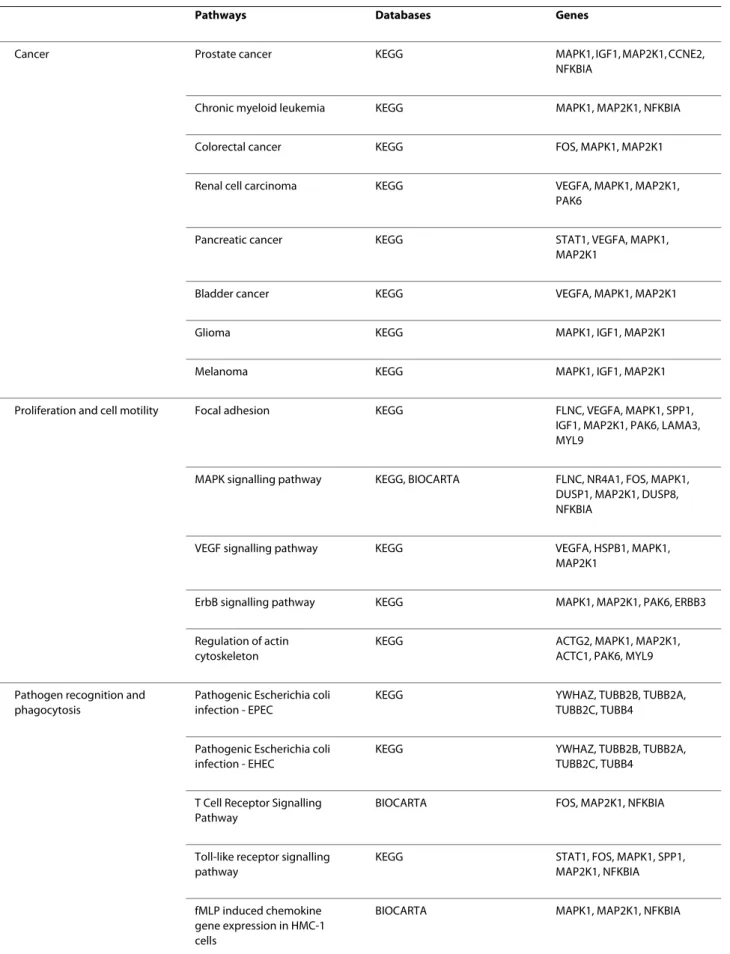
Table 2: DAVID information
Pathways Databases Genes
Cancer Prostate cancer KEGG MAPK1, IGF1, MAP2K1, CCNE2,
NFKBIA
Chronic myeloid leukemia KEGG MAPK1, MAP2K1, NFKBIA
Colorectal cancer KEGG FOS, MAPK1, MAP2K1
Renal cell carcinoma KEGG VEGFA, MAPK1, MAP2K1,
PAK6
Pancreatic cancer KEGG STAT1, VEGFA, MAPK1,
MAP2K1
Bladder cancer KEGG VEGFA, MAPK1, MAP2K1
Glioma KEGG MAPK1, IGF1, MAP2K1
Melanoma KEGG MAPK1, IGF1, MAP2K1
Proliferation and cell motility Focal adhesion KEGG FLNC, VEGFA, MAPK1, SPP1, IGF1, MAP2K1, PAK6, LAMA3, MYL9
MAPK signalling pathway KEGG, BIOCARTA FLNC, NR4A1, FOS, MAPK1, DUSP1, MAP2K1, DUSP8, NFKBIA
VEGF signalling pathway KEGG VEGFA, HSPB1, MAPK1, MAP2K1
ErbB signalling pathway KEGG MAPK1, MAP2K1, PAK6, ERBB3
Regulation of actin cytoskeleton
KEGG ACTG2, MAPK1, MAP2K1,
ACTC1, PAK6, MYL9
Pathogen recognition and phagocytosis
Pathogenic Escherichia coli infection - EPEC
KEGG YWHAZ, TUBB2B, TUBB2A,
TUBB2C, TUBB4
Pathogenic Escherichia coli infection - EHEC
KEGG YWHAZ, TUBB2B, TUBB2A,
TUBB2C, TUBB4
T Cell Receptor Signalling Pathway
BIOCARTA FOS, MAP2K1, NFKBIA
Toll-like receptor signalling pathway
KEGG STAT1, FOS, MAPK1, SPP1,
MAP2K1, NFKBIA
fMLP induced chemokine gene expression in HMC-1 cells
Fc Epsilon Receptor I Signalling in Mast Cells
BIOCARTA FOS, MAPK1, MAP2K1
Other Keratinocyte Differentiation BIOCARTA MAPK1, MAP2K1, NFKBIA
Gap junction KEGG TUBB2B, MAPK1, MAP2K1,
TUBB2A, TUBB2C, TUBB4
NFAT and Hypertrophy of the heart
BIOCARTA MAPK1, IGF1, MAP2K1
Long-term depression KEGG MAPK1, IGF1, MAP2K1
Cadmium induces DNA synthesis and proliferation in macrophages
BIOCARTA FOS, MAPK1, MAP2K1, NFKBIA
DAVID classified 179 of the 183 genes of interest into 24 pathways from KEGG or Biocarta. Column 3 presents the genes involved in each specific pathway.
Table 2: DAVID information (Continued)
Figure 5 Number of pathways detected by DAVID in negative controls. 1000 lists of 183 random genes were submitted to DAVID. The number
of pathways detected per test is presented on the X axis and the logarithm of the frequency of the tests (+ 1 to avoid log (0)) is presented on the Y axis. The black dots show the total number of pathways detected per test and the black star indicates the total number of pathways detected with the 183 genes of interest selected by the methodology. The red dots show the number of pathways directly involved in cancer detected per test and the red star indicates the number of pathways directly involved in cancer detected with the 183 genes of interest selected by the methodology. The green dots show the number of pathways involved in proliferation and cell motility detected per test and the green star indicates the number of path-ways involved in proliferation and cell motility detected with the 183 genes of interest selected by the methodology. Lastly, the blue dots show the number of pathways involved in pathogen recognition and phagocytosis detected per test and the blue star indicates the number of pathways in-volved in pathogen recognition and phagocytosis detected with the 183 genes of interest selected by the methodology.
odology. Moreover, the second negative control assessed the number of pathways involved in pathogen recogni-tion and phagocytosis and only two tests over 1000 trials gave results equal to those with the 183 genes of interest selected by the methodology (figure 5). In vitro confirma-tion of their expression in cancer cell lines with high potential would confirm the relevance of the methodol-ogy we propose and the involvement of these genes and pathways in the metastasis of cancer cells. Moreover, functional analysis of the products of these genes should provide new keys to the understanding of the mecha-nisms involved in the developement of metastases.
Conclusion
We describe a methodology able to identify new genes involved in specific conditions from several microarray datasets. This statement is supported by the fact that this methodology was able to identify genes already known to be involved in the biological processes which we studied. The next step will be in silico validation by analysing the expression profile of our genes of interest in publicly available expression profile datasets from different cancer cell lines and in vitro validation by qRT-PCR.
The first to be investigated are the genes involved in pathogen recognition and phagocytosis. Indeed, several elements indicate that these pathways may be involved in cancer and particularly in the metastatic process induced by hypoxia. Not only the genes selected by the methodol-ogy will be tested. We actually plan to test close neigh-bouring genes inside the pathways in order to validate large portions of pathways or entire pathways instead of single genes.
This is likely to improve our understanding of the mechanisms underlying this pathology and provide new opportunities to fight it.
Additional material
Competing interests
The authors declare that they have no competing interests.
Authors' contributions
MP carried out all the experiments, AG and FB participated in the development of the R scripts, BDM participated in the retrieval and the analysis of the infor-mations from DAVID, BDH and EB participated in the selection and the retrieval of the datasets from GEO and ArrayExpress, CM and ED conceived the study, participated in its design and helped to draft the manuscript. All authors read and approved the final manuscript.
Acknowledgements
M. Pierre is supported by FRIA (Belgium), B. DeMeulder is supported by Televie (Belgium) and C. Michiels is research director of FNRS (Fonds National de la Recherche Scientifique, Belgium).
We thank J.J. LaPres (Biochemistry and Molecular Biology, Michigan State Uni-versity, East Lansing) for providing the dataset GSE1056 and K.S. Hoek (Depart-ment of Dermatology, University Hospital of Zürich, Zürich) for providing the datasets GSE4840 and GSE4843.
Author Details
1Molecular Biology Research Unit (URBM), University of Namur - FUNDP, Namur, Belgium and 2Cell Biology Research Unit (URBC), University of Namur - FUNDP, Namur, Belgium
References
1. Friedl P, Wolf K: Tumour-cell invasion and migration: diversity and escape mechanisms. Nat Rev Cancer 2003, 3(5):362-374.
2. Pantel K, Brakenhoff RH: Dissecting the metastatic cascade. Nat Rev
Cancer 2004, 4(6):448-456.
3. Gordan JD, Simon MC: Hypoxia-inducible factors: central regulators of the tumor phenotype. Curr Opin Genet Dev 2007, 17(1):71-77. 4. Vaupel P: The role of hypoxia-induced factors in tumor progression.
Oncologist 2004, 9(Suppl 5):10-17.
5. Sullivan R, Graham CH: Hypoxia-driven selection of the metastatic phenotype. Cancer Metastasis Rev 2007, 26(2):319-331.
Additional file 1 R script for individual analyses. The HG-U133A
Affymetrix GeneChip was used in this example of script. The script is in R language. Some objects and values, symbolyzed here by X or Y, have to be replace according to the dataset analyzed. CDF packages can vary accord-ing to the GeneChip model analyzed.
Additional file 2 R script for data frames. The HG-U133A Affymetrix
GeneChip was used in this example of script. The script is in R language. Some objects and values like the length of some vectors have to be replace according to the GeneChip model analyzed. CDF packages can vary according to the GeneChip model analyzed.
Additional file 3 R script for intersections. The script is in R language.
Some objects and values, symbolyzed here by X have to be replace accord-ing to the datasets involved in the intersection.
Additional file 4 R script for union intersections. The script is in R
lan-guage. Some objects and values, symbolyzed here by X have to be replace according to the datasets involved in the union intersection.
Additional file 5 R script for meta-analyses. The HG-U133A Affymetrix
GeneChip was used in this example of script. The script is in R language. Some objects and values, symbolyzed here by X or Y, have to be replace according to the meta-dataset analyzed. CDF packages can vary according to the GeneChip model analyzed.
Additional file 6 Intersections. 33 groups of datasets were designed
based on the experimental conditions and/or the GeneChip model.
Additional file 7 Union intersections. 30 groups of metastasis datasets
were designed based on the experimental conditions and/or the GeneChip model. All were compared to the group of hypoxia datasets.
Additional file 8 Meta-datasets. 14 meta-datasets were designed based
on the experimental conditions.
Additional file 9 Table of references. This table reports the number of
the references in the references section for all 183 genes of interest. These are the publications where those genes were shown to be involved in can-cer (column 2), in metastasis (column 3) and/or in hypoxia (column 4).
Additional file 10 Venn's diagram for the prostate datasets. The 6
prostate specific datasets (or sub-datasets) were used to run two intersec-tions, two union intersections and one meta-analysis. These three approaches provided 87, 74 and 48 genes respectively. A Venn's diagram was then generated using these data.
Additional file 11 Venn's diagram for the melanoma datasets. The 6
melanoma specific datasets (or sub-datasets) were used to run three inter-sections, three union intersections and three meta-analyses. These three approaches provided 144, 97 and 63 genes respectively. A Venn's diagram was then generated using these data.
Received: 30 July 2009 Accepted: 30 April 2010 Published: 30 April 2010
This article is available from: http://www.biomedcentral.com/1471-2407/10/176 © 2010 Pierre et al; licensee BioMed Central Ltd.
This is an Open Access article distributed under the terms of the Creative Commons Attribution License (http://creativecommons.org/licenses/by/2.0), which permits unrestricted use, distribution, and reproduction in any medium, provided the original work is properly cited.
6. Chan DA, Giaccia AJ: Hypoxia, gene expression, and metastasis. Cancer
Metastasis Rev 2007, 26(2):333-339.
7. DeRisi JL, Iyer VR, Brown PO: Exploring the metabolic and genetic control of gene expression on a genomic scale. Science 1997, 278(5338):680-686.
8. Kronick MN: Creation of the whole human genome microarray. Expert
Rev Proteomics 2004, 1(1):19-28.
9. Fodor SP, Read JL, Pirrung MC, Stryer L, Lu AT, Solas D: Light-directed, spatially addressable parallel chemical synthesis. Science 1991, 251(4995):767-773.
10. Affymetrix: Affymetrix Microarray Suite User Guide version 5.0. Santa Clara: Affymetrix Manual; 2001.
11. Schena M, Shalon D, Davis RW, Brown PO: Quantitative monitoring of gene expression patterns with a complementary DNA microarray.
Science 1995, 270(5235):467-470.
12. Callow MJ, Dudoit S, Gong EL, Speed TP, Rubin EM: Microarray expression profiling identifies genes with altered expression in HDL-deficient mice. Genome Res 2000, 10(12):2022-2029.
13. Benjamini Y, Hochberg Y: Controlling the false discovery rate: A practical and powerful approach to multiple testing. Journal of the
Royal Statistical Society 1995, 57:289-300.
14. Student: The Probable Error of a Mean. Biometrika 1908, 6:1-25. 15. Baldi P, Long AD: A Bayesian framework for the analysis of microarray
expression data: regularized t-test and statistical inferences of gene changes. Bioinformatics 2001, 17(6):509-519.
16. Cui X, Hwang JT, Qiu J, Blades NJ, Churchill GA: Improved statistical tests for differential gene expression by shrinking variance components estimates. Biostatistics 2005, 6(1):59-75.
17. Jain N, Thatte J, Braciale T, Ley K, O'Connell M, Lee JK: Local-pooled-error test for identifying differentially expressed genes with a small number of replicated microarrays. Bioinformatics 2003, 19(15):1945-1951. 18. Opgen-Rhein R, Strimmer K: Accurate ranking of differentially expressed
genes by a distribution-free shrinkage approach. Stat Appl Genet Mol
Biol 2007, 6:Article9.
19. Smyth GK: Linear models and empirical bayes methods for assessing differential expression in microarray experiments. Stat Appl Genet Mol
Biol 2004, 3:Article3.
20. Tusher VG, Tibshirani R, Chu G: Significance analysis of microarrays applied to the ionizing radiation response. Proc Natl Acad Sci USA 2001, 98(9):5116-5121.
21. Dai M, Wang P, Boyd AD, Kostov G, Athey B, Jones EG, Bunney WE, Myers RM, Speed TP, Akil H, et al.: Evolving gene/transcript definitions significantly alter the interpretation of GeneChip data. Nucleic Acids Res 2005, 33(20):e175.
22. Gautier L, Moller M, Friis-Hansen L, Knudsen S: Alternative mapping of probes to genes for Affymetrix chips. BMC Bioinformatics 2004, 5:111. 23. Liu H, Zeeberg BR, Qu G, Koru AG, Ferrucci A, Kahn A, Ryan MC, Nuhanovic
A, Munson PJ, Reinhold WC, et al.: AffyProbeMiner: a web resource for computing or retrieving accurately redefined Affymetrix probe sets.
Bioinformatics 2007, 23(18):2385-2390.
24. Bolstad BM, Irizarry RA, Astrand M, Speed TP: A comparison of normalization methods for high density oligonucleotide array data based on variance and bias. Bioinformatics 2003, 19(2):185-193. 25. Li C, Wong WH: Model-based analysis of oligonucleotide arrays:
expression index computation and outlier detection. Proc Natl Acad Sci
USA 2001, 98(1):31-36.
26. Schadt EE, Li C, Ellis B, Wong WH: Feature extraction and normalization algorithms for high-density oligonucleotide gene expression array data. J Cell Biochem Suppl 2001:120-125.
27. Hochreiter S, Clevert DA, Obermayer K: A new summarization method for Affymetrix probe level data. Bioinformatics 2006, 22(8):943-949. 28. Irizarry RA, Hobbs B, Collin F, Beazer-Barclay YD, Antonellis KJ, Scherf U,
Speed TP: Exploration, normalization, and summaries of high density oligonucleotide array probe level data. Biostatistics 2003, 4(2):249-264. 29. Wu Z, Irizarry R, Gentleman R, Murillo F, Spencer F: A model-based
background adjustment for oligonucleotide expression arrays. Journal
of the American Statistical Association 2004, 99:909-917.
30. Yang IV, Chen E, Hasseman JP, Liang W, Frank BC, Wang S, Sharov V, Saeed AI, White J, Li J, et al.: Within the fold: assessing differential expression measures and reproducibility in microarray assays. Genome Biol 2002, 3(11):research0062.
31. Gene Expression Omnibus [http://www.ncbi.nlm.nih.gov/geo/]
32. Rocca-Serra P, Brazma A, Parkinson H, Sarkans U, Shojatalab M, Contrino S, Vilo J, Abeygunawardena N, Mukherjee G, Holloway E, et al.: ArrayExpress: a public database of gene expression data at EBI. C R Biol 2003, 326(10-11):1075-1078.
33. Hunter KW, Crawford NP, Alsarraj J: Mechanisms of metastasis. Breast
Cancer Res 2008, 10(Suppl 1):S2.
34. Chaudary N, Hill RP: Hypoxia and metastasis in breast cancer. Breast Dis 2006, 26:55-64.
35. Berger F, De Hertogh B, Pierre M, Gaigneaux A, Depiereux E: The "Window t test": a simple and powerful approach to detect differentially expressed genes in microarray datasets. Central European Journal of
Biology 2008, 3(3):327-344.
36. Dennis G Jr, Sherman BT, Hosack DA, Yang J, Gao W, Lane HC, Lempicki RA: DAVID: Database for Annotation, Visualization, and Integrated Discovery. Genome Biol 2003, 4(5):P3.
37. Huang da W, Sherman BT, Lempicki RA: Systematic and integrative analysis of large gene lists using DAVID bioinformatics resources. Nat
Protoc 2009, 4(1):44-57.
38. Ogata H, Goto S, Sato K, Fujibuchi W, Bono H, Kanehisa M: KEGG: Kyoto Encyclopedia of Genes and Genomes. Nucleic Acids Res 1999, 27(1):29-34.
39. Biocarta Pathways [http://www.biocarta.com/genes/index.asp] 40. Ihaka R, Gentleman R: R: a language for data analysis and graphics.
Journal of Computational and Graphical Statistics 1996, 5:299-314.
41. Gentleman RC, Carey VJ, Bates DM, Bolstad B, Dettling M, Dudoit S, Ellis B, Gautier L, Ge Y, Gentry J, et al.: Bioconductor: open software
development for computational biology and bioinformatics. Genome
Biol 2004, 5(10):R80.
42. Entrez Global Query Cross-Database Search System [http:// www.ncbi.nlm.nih.gov/sites/gquery]
43. Gur-Dedeoglu B, Konu O, Kir S, Ozturk AR, Bozkurt B, Ergul G, Yulug IG: A resampling-based meta-analysis for detection of differential gene expression in breast cancer. BMC Cancer 2008, 8:396.
44. Ma S, Huang J: Regularized gene selection in cancer microarray meta-analysis. BMC Bioinformatics 2009, 10:1.
45. Ochsner SA, Steffen DL, Hilsenbeck SG, Chen ES, Watkins C, McKenna NJ: GEMS (Gene Expression MetaSignatures), a Web resource for querying meta-analysis of expression microarray datasets: 17beta-estradiol in MCF-7 cells. Cancer Res 2009, 69(1):23-26.
46. Eferl R, Wagner EF: AP-1: a double-edged sword in tumorigenesis. Nat
Rev Cancer 2003, 3(11):859-868.
47. Jochum W, Passegue E, Wagner EF: AP-1 in mouse development and tumorigenesis. Oncogene 2001, 20(19):2401-2412.
48. Shaulian E, Karin M: AP-1 in cell proliferation and survival. Oncogene 2001, 20(19):2390-2400.
49. van Dam H, Castellazzi M: Distinct roles of Jun: Fos and Jun: ATF dimers in oncogenesis. Oncogene 2001, 20(19):2453-2464.
50. Tomkova K, Tomka M, Zajac V: Contribution of p53, p63, and p73 to the developmental diseases and cancer. Neoplasma 2008, 55(3):177-181. 51. Malaguarnera R, Vella V, Vigneri R, Frasca F: p53 family proteins in thyroid
cancer. Endocr Relat Cancer 2007, 14(1):43-60.
52. Fabre-Guillevin E, Malo M, Cartier-Michaud A, Peinado H, Moreno-Bueno G, Vallee B, Lawrence DA, Palacios J, Cano A, Barlovatz-Meimon G, et al.: PAI-1 and functional blockade of SNAI1 in breast cancer cell migration.
Breast Cancer Res 2008, 10(6):R100.
53. Beeghly-Fadiel A, Shu XO, Long J, Li C, Cai Q, Cai H, Gao YT, Zheng W: Genetic polymorphisms in the MMP-7 gene and breast cancer survival.
Int J Cancer 2009, 124(1):208-214.
54. Fang YJ, Lu ZH, Wang GQ, Pan ZZ, Zhou ZW, Yun JP, Zhang MF, Wan DS: Elevated expressions of MMP7, TROP2, and survivin are associated with survival, disease recurrence, and liver metastasis of colon cancer.
Int J Colorectal Dis 2009, 24(8):875-884.
55. Liu D, Nakano J, Ishikawa S, Yokomise H, Ueno M, Kadota K, Urushihara M, Huang CL: Overexpression of matrix metalloproteinase-7 (MMP-7) correlates with tumor proliferation, and a poor prognosis in non-small cell lung cancer. Lung Cancer 2007, 58(3):384-391.
56. Neufeld G, Cohen T, Gengrinovitch S, Poltorak Z: Vascular endothelial growth factor (VEGF) and its receptors. Faseb J 1999, 13(1):9-22. 57. Roskoski R Jr: Vascular endothelial growth factor (VEGF) signaling in
tumor progression. Crit Rev Oncol Hematol 2007, 62(3):179-213. 58. Tsunedomi R, Iizuka N, Tamesa T, Sakamoto K, Hamaguchi T, Somura H,
hepatocellular carcinoma by altering secretion of vascular endothelial growth factor. Clin Cancer Res 2008, 14(4):1025-1031.
59. Lofstedt T, Jogi A, Sigvardsson M, Gradin K, Poellinger L, Pahlman S, Axelson H: Induction of ID2 expression by hypoxia-inducible factor-1: a role in dedifferentiation of hypoxic neuroblastoma cells. J Biol Chem 2004, 279(38):39223-39231.
60. Chandana SR, Movva S, Arora M, Singh T: Primary brain tumors in adults.
Am Fam Physician 2008, 77(10):1423-1430.
61. Kaliks RA, Del Giglio A: Management of advanced prostate cancer. Rev
Assoc Med Bras 2008, 54(2):178-182.
62. Alberts SR: Updated options for liver-limited metastatic colorectal cancer. Clin Colorectal Cancer 2008, 7(Suppl 2):S58-62.
63. Petit V, Thiery JP: Focal adhesions: structure and dynamics. Biol Cell 2000, 92(7):477-494.
64. Mitra SK, Hanson DA, Schlaepfer DD: Focal adhesion kinase: in command and control of cell motility. Nat Rev Mol Cell Biol 2005, 6(1):56-68. 65. Tanoue T, Nishida E: Docking interactions in the mitogen-activated
protein kinase cascades. Pharmacol Ther 2002, 93(2-3):193-202. 66. Biondi RM, Nebreda AR: Signalling specificity of Ser/Thr protein kinases
through docking-site-mediated interactions. Biochem J 2003, 372(Pt 1):1-13.
67. Hoeben A, Landuyt B, Highley MS, Wildiers H, Van Oosterom AT, De Bruijn EA: Vascular endothelial growth factor and angiogenesis. Pharmacol
Rev 2004, 56(4):549-580.
68. Holbro T, Hynes NE: ErbB receptors: directing key signaling networks throughout life. Annu Rev Pharmacol Toxicol 2004, 44:195-217. 69. Yarden Y, Sliwkowski MX: Untangling the ErbB signalling network. Nat
Rev Mol Cell Biol 2001, 2(2):127-137.
70. Pollard TD: The cytoskeleton, cellular motility and the reductionist agenda. Nature 2003, 422(6933):741-745.
71. Kaper JB, Nataro JP, Mobley HL: Pathogenic Escherichia coli. Nat Rev
Microbiol 2004, 2(2):123-140.
72. Kawai T, Akira S: Antiviral signaling through pattern recognition receptors. J Biochem 2007, 141(2):137-145.
73. Dewas C, Fay M, Gougerot-Pocidalo MA, El-Benna J: The mitogen-activated protein kinase extracellular signal-regulated kinase 1/2 pathway is involved in formyl-methionyl-leucyl-phenylalanine-induced p47phox phosphorylation in human neutrophils. J Immunol 2000, 165(9):5238-5244.
74. Kitaura J, Xiao W, Maeda-Yamamoto M, Kawakami Y, Lowell CA, Kawakami T: Early divergence of Fc epsilon receptor I signals for receptor up-regulation and internalization from degranulation, cytokine production, and survival. J Immunol 2004, 173(7):4317-4323.
Pre-publication history
The pre-publication history for this paper can be accessed here: http://www.biomedcentral.com/1471-2407/10/176/prepub
doi: 10.1186/1471-2407-10-176
Cite this article as: Pierre et al., Meta-analysis of archived DNA microarrays
identifies genes regulated by hypoxia and involved in a metastatic pheno-type in cancer cells BMC Cancer 2010, 10:176