RESEARCH OUTPUTS / RÉSULTATS DE RECHERCHE
Author(s) - Auteur(s) :
Publication date - Date de publication :
Permanent link - Permalien :
Rights / License - Licence de droit d’auteur :
Institutional Repository - Research Portal
Dépôt Institutionnel - Portail de la Recherche
researchportal.unamur.be
University of Namur
Understanding the Coexistence of Formal and Informal Credit Markets in Piura, Peru
Guirkinger, Catherine Published in: World Development DOI: 10.1016/j.worlddev.2007.07.002 Publication date: 2008 Document Version
Early version, also known as pre-print
Link to publication
Citation for pulished version (HARVARD):
Guirkinger, C 2008, 'Understanding the Coexistence of Formal and Informal Credit Markets in Piura, Peru', World Development, vol. 36, no. 8, pp. 1436-1452. https://doi.org/10.1016/j.worlddev.2007.07.002
General rights
Copyright and moral rights for the publications made accessible in the public portal are retained by the authors and/or other copyright owners and it is a condition of accessing publications that users recognise and abide by the legal requirements associated with these rights. • Users may download and print one copy of any publication from the public portal for the purpose of private study or research. • You may not further distribute the material or use it for any profit-making activity or commercial gain
• You may freely distribute the URL identifying the publication in the public portal ?
Take down policy
If you believe that this document breaches copyright please contact us providing details, and we will remove access to the work immediately and investigate your claim.
Understanding the Coexistence of Formal and Informal
Credit Markets in Piura, Peru
Catherine Guirkinger
∗Center for Research in Economic Development
University of Namur, Belgium
September 2006
Abstract
This paper examines why farm households seek informal, high interest loans in Piura, Peru, while formal lenders offer loans at lower interest rate. An econometric analysis based on a unique panel data set reveals that the informal sector serves various types of clients: households excluded from the formal sector but also households that prefer informal loans because of lower transaction costs or lower risk. An in-depth analysis of contract terms and loan technologies permit an accurate comparison of effective loan cost and contractual risk across sectors and reveals that proximity and economies of scope enjoyed by informal lenders enable them to substitute information intensive screening and monitoring for contractual risk and supply these various types of clients.
∗catherine.guirkinger@fundp.ac.be. Support for data collection was provided by a grant from the BASIS
collaborative research strengthening program and the following fellowships: a Risk and Development Fellow-ship and an International Dissertation Field Research FellowFellow-ship from the Social Science Research Council with funds from the Andrew W. Mellon Foundation. I thank Steve Boucher, Scott Rozelle, Rachael Goodhue and Pierre Merel for useful comments.
1
Introduction
The existence of an informal credit market alongside a formal market where interest rates are substantially lower has long been recognized as a key feature of rural credit markets in developing countries and has received continuous attention in the field of development economics (Hoff and Stiglitz, 1990; Ray, 1998; Conning and Udry, 2005). Not only is the persistent segmentation of credit markets into an expensive informal sector and a cheaper formal sector puzzling, it is also worrying on equity grounds. As the poor typically rely on expensive informal credit to finance their economic activities, they may systematically earn a lower return from their investment and thereby be on a slower wealth accumulation path than the rich who borrow in formal markets (Conning and Udry, 2005).
Recent dramatic changes in credit policy had surprisingly little effect on the coexistence of loan sectors. The type of market-oriented rural credit policies currently in place in many developing countries began to be broadly implemented in the late 1980s. Previously, mas-sive state intervention in agricultural credit markets was the rule in the developing world. State-operated lending programs offered credit at highly subsidized interest rates and poorly enforced repayment, while interest rate ceilings were imposed in the private sector. Con-sequently, private banks were reluctant to lend, and, overall, the formal sector (including state programs and private banks) was unable to meet the large demand for the inexpensive and often low risk loans offered (Gonzalez-Vega, 1984; VonPischke et al., 1983). Households whose loan demand could not be met in the formal sector were quantity rationed in that sector and had to rely expensive informal loans to finance agricultural production. In this context, informal lenders were primarily the recipients of this “spillover” demand from the formal sector (Bell et al., 1997).
One of the hopes of liberalization was that the development of market-oriented financial institutions would displace the expensive informal sector and thereby increase equity in rural credit markets. However, empirical evidence from several countries suggests that informal credit markets persist alongside active formal credit markets several years after financial
liberalization occurred.1 The overall goal of this paper is to understand this coexistence in
the context of agricultural credit markets in Piura, one of the principal regions of commercial agriculture in Peru. Peru liberalized its financial sector in the 1990s and the rural formal credit market has shifted from being primarily state-led in the 1980s to being exclusively market-led in the late 1990s. While banks engage in rural lending, a vibrant informal credit sector continues to exist (Trivelli, 2003). Based on a unique set of data, this paper explores the reasons for this persistence.
The theoretical literature suggests alternative explanations for why households might seek an informal loan even when a market-oriented formal credit sector is active. The first explanation, mentioned above, views the informal sector as the sector of last resort for households that are quantity rationed in the more desirable formal sector. Stiglitz and Weiss (1981) show that endogenous quantity rationing may arise because formal lenders have limited local information, and thus rely on collateral to overcome moral hazard and adverse selection intrinsic in credit transactions. Those who have insufficient collateral may be involuntarily excluded from the credit market but may instead obtain an informal loan since informal lenders, due to their informational advantages, can substitute information-intensive screening and monitoring for collateral (Conning, 1996; Hoff and Stiglitz, 1990).
Several authors challenge this view of the informal sector as the sector of last resort. Based on evidence from rural India, Kochar (1992) suggests that the informal sector may also be the sector of choice. She argues that informal loans, in particular those from friends or relatives, may be cheaper than formal loans and thus preferred by borrowers. Chung (1995) and Mushinski (1999) build on Kochar’s view of the informal loan sector as the cheapest sector. They point out that high transaction costs related to loan application in the formal sector may discourage households from taking formal loans. Barham et al. (1996) call these households transaction cost rationed in the formal sector. Because informal lenders manage greater information about loan applicants, application procedures are easier in the informal sector and transaction costs are lower. As a result, the differences in transaction costs may drive the effective cost of informal loans below the effective cost of formal loans, and
households that are transaction cost rationed in the formal sector may take an informal loan despite its higher interest rate.
Finally, the informal sector may also be preferred because of risk. Boucher and Guirkinger (forthcoming) argue that informal lenders’ greater access to local information allows them to write contracts that are more state-contingent than formal contracts and thus are less risky for borrowers. Therefore, households that are risk rationed in the formal sector may seek an informal loan. A risk rationed household is one that needs funds and has access to a credit contract but does not seek it because it is not willing to assume the downside risk implied by the available contract (Boucher et al., 2005a).
This paper has three specific objectives. The first is to evaluate which of the explanations offered by the literature may account for the persistence of the informal loan sector in Piura. Using a household panel data set, I disentangle the motives behind households’ use of informal loans and show that each of the three explanations mentioned above is operational and helps understand household demand for informal loans in the region. These econometric results suggest that credit contracts offered in the informal sector differ from contracts in the formal sector in terms of effective cost and risk. The second objective of this paper is to analyze these sectoral differences in contract terms. I first use the household panel data to compare interest rates, transaction costs and collateral requirements as a proxy for contractual risk. However, as collateral requirements only partially capture contractual risk, I also explore the consequences of default based on interviews with formal and informal lenders and interviews with justices of the peace who resolve conflicts over informal contracts in rural Peru. This analysis provides a more in-depth and more accurate assessment of contractual risk than is afforded by conventional household survey data alone. The final objective of the paper is to examine how informal lenders proceed to overcome information asymmetries and alleviate quantity rationing, transaction cost rationing and risk rationing prevalent in the formal sector. To do so, I investigate the differences in lending technologies - or strategies used to address information problems - that account for the differences in contract terms across lending sectors. I argue that informal lenders substitute screening
and monitoring for contractual risk to overcome adverse selection and moral hazard. These practices are facilitated by informal lenders’ physical and social proximity to borrowers and by the economies of scope informal lenders enjoy when they interlink credit to the other activities they engage in.
2
An econometric analysis of sectoral choice in Piura.
2.1
Sample and data
The data was collected in the rural coastal area of the department of Piura on Peru’s north coast. A detailed survey was administered to 547 households in 1997, of which 499 were found and reinterviewed in 2003. The population of interest includes all households that farmed at least one-half of a hectare of irrigated land in coastal Piura in 1997.2 Agriculture
in Piura is exclusively irrigated, highly commercial and represents one of the main sources of revenue for the region, accounting for 35% of employment and 13% of GDP.3 The road
and port infrastructures are well developed, and part of the cotton, bananas and mangoes produced in Piura are exported to the United States and Europe. Rice, corn and lemon, on the other hand, are mainly sold domestically. Small farms control the majority of irrigated land. In 1997, average farm size was 3.5 ha and 90% of irrigated land was controlled by farms of a size of less than 10 ha.4
In addition to conventional demographic and production sections, the survey contains two detailed credit modules. The first module captures information about all loans that were outstanding at some point during the 12 months prior to the survey. The second credit module includes a set of qualitative questions applied to households who did not borrow from the formal sector, in order to understand the reasons for non-participation in that sector.5
Together, these two modules permit classification of a household into one of the following mutually exclusive formal sector rationing categories:6
Price rationed without loan (P Rwol): the household does not borrow in the formal sector because it has no profitable project that requires a formal loan7;
Quantity rationed (QR): the household either applied for a formal loan but was rejected or does not seek a formal loan because it believes that its application would be rejected by a bank;
Transaction cost rationed (T CR): the household has a profitable project that requires outside financing but does not seek a formal loan because the transaction costs are too high;
Risk rationed (RR): the household has a profitable project that requires outside fi-nancing but does not seek a formal loan because the risk implied by available contracts is too high.
[TABLE 1 HERE]
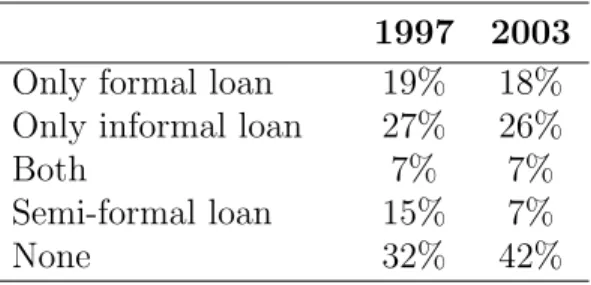
Table 1 reports the fraction of sample households that borrowed from each sector in the two survey years. The formal sector in Piura is composed of four local banks8, while the informal sector consists of a wide range of informal lenders who, in general, do not specialize in lending but manage a portfolio of activities related to agriculture, including selling inputs and marketing or processing outputs. Most informal lenders manage a few dozen loans each year, and tend to on-lend funds that they borrowed from banks.9 Table 1 reveals
that the majority of households participated in credit markets, as 68% and 58% of the sampled households had a loan in 1997 and 2003, respectively. The informal sector was the largest sector in terms of participation. Based on self-reported use of loans by survey respondents, more the 85% of informal loans and more than 95% of formal loans were invested in agricultural production. This high dependency on outside finance for farming is related to the high input requirements of the crops farmers grow.10
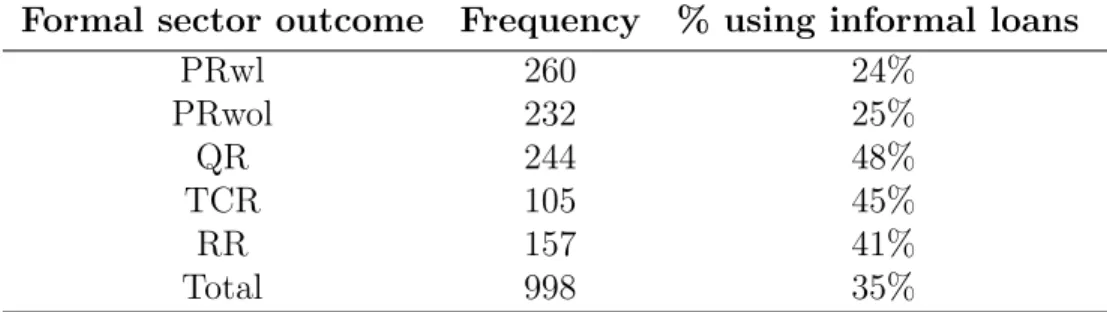
Table 2 reports the frequencies of formal sector rationing categories, and the percentage of households who use informal loans in each category. It reveals that, while only about a quarter of households who either borrow in the formal sector (P Rwl) or have no project to finance with a formal loan (P Rwol) use an informal loan, more than 40% (41% to 48%) of households in the other categories (QR, T CR and RR) use an informal loan.11 This
suggests that households who lack access to formal loans (QR) as well as households who are discouraged by either the transaction costs (T CR) or the risk (RR) of formal loans are more likely to seek informal loans than price rationed households. All three explanations identified in the literature seem therefore to contribute to the coexistence of an informal credit sector alongside the formal credit sector in Piura. However, to formally test this hypothesis, it is necessary to control for factors influencing credit supply and demand and I now turn to a multivariate analysis of the probability of using an informal loan.
2.2
Empirical strategy, estimation, and results
2.2.1 Empirical strategy
Consider the following binary outcome model where the dependent variable Iittakes value
one if household i has an informal loan at time t and zero otherwise:
Iit= α1+ α2QRit+ α3T CRit+ α4RRit+ βWit+ γ0Xit+ δi+ εit (1)
QRit, T CRit and RRit are dummy variables indicating the rationing category of the
house-hold. Price rationed households who either have a formal loan (P Rwlit = 1) or no
prof-itable project requiring a formal loan (P Rwolit = 1) constitute the omitted category.
α1, α2, α3, α4, β, and γ0 are parameters to be estimated. δi is a time-invariant, individual
specific unobserved effect and εit is a mean zero error term. Wit is the value of household
wealth including the value of the household’s durable goods, animals, machinery, and land. Xit is a vector of household characteristics that affect loan demand and supply in the
infor-mal sector. It includes farm size, dependency ratio, number of household members, level of education of the household head and dummy variables controlling for the valley the house-hold lives in and indicating whether or not the househouse-hold farms, cultivates any bananas, has any annual crops or uses a semi-formal loan. The definition and means of all regressors are given in Table 3.
[TABLE 3 HERE]
The primary parameters of interest are α2, α3, and α4, as they identify the motives
be-hind households’ participation in the informal credit market. If the informal sector supplies those excluded from the formal sector, households who are quantity rationed in the formal sector (QRit = 1) should be more likely to borrow in the informal sector than price rationed
households (the omitted category.) Consequently, the parameter α2 should be strictly
pos-itive. Similarly, if the informal sector is preferred over the formal sector because of lower transaction costs and lower risk, α3 or α4 should be strictly positive.
The coefficient on wealth, β1, indicates whether wealth is a determinant of the use of
informal loans. There is an extensive theoretical literature on the relationship between wealth and credit constraints which shows that, in the presence of information asymmetries, the poor are more likely to face all three forms of non-price rationing (Carter, 1988; Barham et al., 1996; Boucher et al., 2005a). This suggests that both formal and informal sector outcomes may be a function of household wealth. Holding the formal sector outcome constant, the poor may be more likely to be constrained in the informal sector, and therefore less likely to use informal loans. However, among those who are constrained in the formal sector, the poorest may also have a greater need for informal loans. Wealth may thus have opposing effects on the probability of using an informal loan and the net impact of wealth must be resolved empirically.
The parameter estimate on bananas is expected to be negative because, in contrast to other crops grown in Piura, bananas provide relatively high monthly income, so that households who grow bananas are likely to have a relatively low credit demand. In contrast,
the parameter estimate on annual crops is expected to be positive as annual crops have high variable input needs in comparison to banana or fruit trees.12 Households who abandoned
farming between 1997 and 2003 as well as those who have a semi-formal loan are expected to be less likely to need informal loans and therefore the parameter estimates on these variables are expected to be negative.13
2.2.2 Estimation technique
I use two different econometric specifications to estimate Equation 1: a logit with random effects and a logit with fixed effects. Both specifications assume a logistic distribution for the error term εit, but they differ with respect to the assumptions regarding the time-invariant
individual effect, δi. The random effects specification assumes no correlation between δi and
the explanatory variables, while the fixed effects specification allows δi to be correlated with
explanatory variables. The logit fixed effects estimation is thus not subject to potential biases due to time-invariant omitted variables. However, the fixed effects logit has a major drawback for small samples: identification of the parameters is based on households that switch their value of the dependent variable (informal loan use) across time periods. Consequently, only 196 out of 499 households are included in the estimation.
2.2.3 Results
Columns (i) and (ii) in Table 4 report the results of the random effects and fixed effects estimations of Equation 1. Note that the parameter estimates on formal sector outcomes are very similar across specifications in terms of their sign, significance and size. To choose the preferred specification, I use a Hausman test (1978).14 It suggests that the random effect
assumption holds so that the random effects estimation is the focus of the ensuing discussion. [TABLE 4 HERE]
In Column (i), the coefficients on formal sector outcomes, QR, T CR, and RR are all positive and statistically different from zero. The parameter estimate on wealth is not
statistically significant, which suggests that no systematic correlation between wealth and the use of informal loans exists.15 As expected, households who use semi-formal loans are
significantly less likely to borrow in the informal sector, while those cultivating annual crops are more likely to do so. The parameter estimate on bananas has the expected sign (negative) but it is not significant.
Column (iii) reports the marginal effects of the formal sector outcome variables on the probability of using an informal loan for the model estimated in Column (i). The results suggest that households who do not borrow in the formal sector because they are denied access are 33% more likely to use an informal loan than households who are price rationed in the formal sector. Similarly, households who are discouraged by the high level of transaction costs are 26% more likely to use an informal loan, while households discouraged by the risk-sharing rules of formal contracts are 23% more likely to use an informal loan than households in the base category. The relative sizes of these marginal effects are in line with the descriptive evidence reported in Table 2 and confirm that households excluded from the formal sector and households discouraged by the high transaction costs or risk of a formal loan are all more likely to use an informal loan than households whose loan demand is met in the formal sector.
This econometric analysis sheds light on the multiple motives explaining household use of informal loans rather than formal loans and suggests that there is no single valid explanation for the persistence of the informal sector but that, informal lenders overcome various forms of non-price rationing in the formal sector. It indirectly reveals differences across loan sectors in the transaction costs and risk-sharing rules of credit contracts. I now turn to examining how deep these differences are, before analyzing how informal lenders manage to overcome quantity, transaction cost and risk rationing prevalent in the formal credit market.
3
An exploration of sectoral differences in loan terms.
In order to evaluate average loan costs across sectors, I use household data on interest rates, the costs of loan applications, and the amount and maturity of loans. I then take up the issue of the measurement of contractual risk. I compare collateral requirements between sectors, since collateral is an indicator of what borrowers might lose if they default. However, collateral only imperfectly captures the risk of a loan. On one hand, a positive collateral requirement may overstate the risk born by the borrower since lenders do not typically foreclose as soon as a borrower fails to comply with the initial repayment schedule. On the other hand, an absence of collateral may understate this risk since default may have negative consequences for reputation or future loan access. In order to compare risk between sectors, it is therefore necessary to understand what the real consequences of default are. Therefore, I complement the quantitative survey data with qualitative information from interviews with lenders, justices of the peace, and farmers.
3.1
A first look at contract terms using the household panel data
Table 5 reports key contract terms in the two sectors for the two years of the survey. The differences between formal and informal loans in terms of amount, interest rate, and maturity are large. In both years, formal loans are about four times as large as informal loans. In 2003, for example, the average formal loan is$1560 while the average informal loan is only $350. Formal loans also have significantly longer maturities. The average maturity of an informal loan is 6 months, which corresponds to the duration of a crop cycle, while, on average, formal loans were granted for 9 and 13 months, respectively, in 1997 and 2003.16
[TABLE 5 HERE]
The mean interest rates reported in the table are striking for two reasons. First, the annual interest rates in the informal sector are nearly double the rates in the formal sector. Second, both are exceptionally high. In calculating the interest rate in the informal sector, loans with
zero explicit interest rates were excluded.17 The reason is that the majority are interlinked
transactions that combine a credit transaction with either the purchase of inputs or the sale of outputs. Part of the loan cost born by borrowers is then the over-pricing of inputs or under-pricing of outputs, and implicit interest rates cannot be calculated for these loans.18
By excluding them from the calculation of average interest rates, I assume that their cost is similar to loans with explicit interest rates.19
The contractually stipulated interest rates do not capture the full cost of a loan, if borrowers incur transaction costs. These transaction costs, in turn, may vary across sectors. Table 5 reports means of borrowers’ self-reported transaction costs associated with loan application for the 1997 survey.20 These costs include travel and legal cost, such as hiring
notaries and obtaining the certification that the property serving as collateral is free of lien. Taken together, the cost of application represents$75, or 3.7% of the average loan amount in the formal sector, and about $6, or 2.0% of the average loan amount in the informal sector. This is consistent with the view that transaction costs are lower in the informal sector. However, note that for a loan of an amount equal to the average informal loan amount, effective loan cost (the sum of average interest payments and transaction costs) remains lower in the formal sector. For very small loans though, the informal sector may be cheaper since transaction costs have a large fixed component.21
Finally, the last row of Table 5 compares the frequency of collateral use across sectors. While 58% of formal loans require a mortgage, fewer than 10% of informal loans do.22 At
first sight, this difference suggests that formal loans are riskier than informal ones since borrowers from the formal sector may lose their land. However, as mentioned above, the stated collateral requirement may not capture the true contractual risk. It was thus necessary to collect additional data on the exact consequences of default, which I present and analyze in the next section.
3.2
A deeper look at contractual risk
The qualitative data that allow a more in-depth analysis of the risk-sharing rules of credit contracts were collected from three main sources: 1) interviews with formal and informal lenders; 2) interviews with justices of the peace; 3) interviews with eight farmers from the sample who defaulted on a loan in 2003.
The main objectives of interviews with formal and informal lenders were to collect in-formation about key characteristics of their agricultural loan portfolios and to understand their lending technology. Special attention was devoted to the actions they take in case of delinquent debt. I interviewed 20 informal lenders as well as bank managers and several agricultural loan officers in each of the four local banks operating in the study area. The second qualitative data source consists of interviews conducted with the 23 justices of the peace (juez de paz ) operating in the survey communities. Justices of the peace are members of these communities and are the elected, local representative of the judicial system in rural Peru. One of their primary responsibilities is to resolve conflicts over debt, and they have the authority to seize borrowers’ assets.23 As such, justices of the peace are an invaluable
source of information for evaluating the risk associated with informal loans. Finally, I revis-ited eight farmers who reported having defaulted on a loan in the 2003 household survey, in order to determine the reasons and consequences of not repaying their loan on time.
[TABLE 6 HERE]
Table 6 provides a brief synthesis of what these data reveal about the consequences of default across loan sectors. In the remainder of this section, I detail and discuss these consequences successively in the formal and informal loan sectors.
Informal sector
Interviews with lenders and farmers reveal that, in the informal sector, most cases of default lead to a restructuring of delinquent debt. The terms of the agreements are relatively standard across informal lenders. The main source of variation is the amount of additional
time the borrower is granted to repay his debt which depends upon the lender’s evaluation of the borrower’s repayment capacity. In general, it is at least the length of an agricultural cycle (6 to 12 months), and the borrower is typically required to repay after the next harvest.24 A surprising feature, common to all the informal lenders I interviewed and confirmed by farmers, is that no interest is charged during the loan extension. The debt is said to be “frozen.”
If lender and borrower do not reach an agreement over the repayment of the delinquent debt, typically because the lender considers that the borrower has the capacity to repay but refuses, the lender takes one of two actions. Either he writes off the debt or he appeals to a justice of the peace.25 The judicial process involving a justice of the peace is both fast
and cheap. Justices of the peace call a mediation meeting with both parties within a week of the appeal. The total cost of the procedure incurred by the lender does not exceed $4.26 Before calling a meeting between borrower and lender, the justice of the peace conducts an investigation to confirm the story of the lender in terms of the amount of the loan and to evaluate the repayment capacity of the borrower. The terms of the agreements reached during the mediation meeting are similar to the agreements resulting from the direct negotiation between borrowers and lenders. No interest is charged for the time in delinquency, so that the borrower is only liable for the amount he owed when the loan entered into delinquency. Again, the greatest source of variation across agreements is the repayment schedule, which depends on the reasons for default and the income flow of the borrower.
Justices of the peace are allowed to seize goods equivalent to the value of the debt if the delinquent borrower does not comply with the agreement signed during the mediation meeting. However, only one of the justices of the peace surveyed had confiscated borrowers’ assets in the twelve months prior to the survey. This was not the only case of non-compliance with the agreement reached during mediation, but often lenders do not seek asset seizure as it may be perceived by other community members as a severe and excessive response. The lender’s social and business relationships may suffer if he is regarded as exploitative by members of his community, and therefore he may prefer to give up on a debt rather than
entering an open conflict with a borrower. For the same reason, an informal lender may be unwilling to appeal to a justice of the peace and may choose to write off a debt instead.
Formal sector
As in the informal sector, in the formal sector, a negotiation process follows default and the lender typically offers to restructure the delinquent debt. The crucial difference between informal and formal loan restructuring is cost. While an informal debt is “frozen” at the end of the original term, in the formal sector, interest continues to accumulate and penalties are charged so that the price of a formal loan may be quickly driven above that of an informal loan.27
This suggests that, while a formal loan is cheaper than an informal loan when the borrower repays on time, it is more expensive when the borrower does not. This raises questions about the difference in expected loan cost across sectors: if default is frequent, informal loans may be on average cheaper than formal loans, even if reported interest rates are higher in the informal sector. This does not appear to be the case in Piura. In fact, formal and informal lenders report very similar and low default rates, of about 3% on average.28 As a consequence,
even if informal loans are cheaper in case of default, they remain more expensive in expected cost terms.
If the negotiation has not been successful, or if the borrower does not repay his restruc-tured loan, the bank may initiate a judicial process to seize the borrower’s collateral. Yet cases of collateral seizures are rare. One local bank manager estimated that less than a dozen cases had been carried out by all banks in Piura between 1998 and 2004.29 Collateral seizure
is the result of a judicial procedure that is both long and complex compared to the cases settled by justices of the peace. The procedure is as follows. First a judge decides that the lender has the right to proceed with foreclosure. Then a government auction is organized and announced in the official newspaper. During this auction, the collateral is sold to the highest bidder. A common problem is that there may be no buyer for the land under these circumstances: given the agrarian structure in Piura and the small size of parcels, the pool
of potential buyers is typically limited to neighbors or members of the same community who are reluctant to enter into conflict with the borrower. As a result, foreclosure can take many years. An additional difference between sectors is that default in the formal sector is auto-matically reported to credit bureaus. This information becomes available to other formal lenders, and it may affect future credit access.30
To summarize, even though formal lenders rarely foreclose, default in the formal sector is systematically punished via financial penalties associated with loan restructuring. Default in the informal sector also leads to loan restructuring but with radically different conditions. In fact, in the informal sector, the average effective interest rate is lower when the borrower defaults than when he pays on time. Consequently, instead of being punished in case of default, the borrower is given a “discount.” If, in some instances, a delinquent borrower may suffer damages in terms of reputation and future access to informal loans, this occurs only in those few cases of default that lead to a conflict between borrower and lender. Thus, while punishing default is the rule in the formal sector, it is rare in the informal sector. All in all, if a farmer is hit by an adverse shock and unable to repay a loan, he is better off with an informal debt than with a formal one.
4
Differences in lending technologies and the ability
of informal lenders to alleviate quantity, transaction
cost and risk rationing.
The analysis in the previous section raises questions about how informal lenders over-come moral hazard and adverse selection. Indeed, in the formal sector, punishing default discourages those who have a high probability of defaulting from applying and therefore limits adverse selection. In addition, the threat of punishment prevents moral hazard and it provides strong incentive for those who borrow to work hard and repay on time. In contrast,
the lack of punishment in the informal sector may increase problems of moral hazard and adverse selection. Still, default rates in the informal sector are as low as in the formal sector. This suggests that informal lenders are able to directly screen out undesirable applicants and both monitor borrowers and directly enforce repayment. To confirm this conjecture, I now explore how formal and informal lenders select, monitor, and enforce repayment in Piura and show how differences in lending technologies explain that informal lenders alleviate quantity rationing, transaction cost rationing and risk rationing in the formal sector.
4.1
Selection of loan applicants
The selection process in the formal sector is more standardized than in the informal sector. It is based primarily on a series of institutionally set requirements such as owning at least one hectare of titled land, having no negative entry in one’s credit history, and having paid the irrigation water bill.31 In contrast, informal lenders select their borrowers based on their prior knowledge of the person and on the information they obtain during a careful investigation of the activities of the applicant. Recall that most informal lenders manage businesses related to agriculture, primarily the sale of inputs and the purchase of crops. Similar to what Conning (1996) describes in Chile and Aleem (1993) in Pakistan, these lenders typically accept loan applications from the pool of their clients in these complementary businesses, as their direct observations of crop yields or input use enable them to accurately evaluate the profitability of their clients’ farm. They also often know neighbors of the applicant, whom they can consult as character references. An additional screening device is to “test” borrowers by giving them small loans at first and progressively offering them larger loans and better terms. Gosh and Ray (2001) explore this practice theoretically and show that it can be an equilibrium outcome when information is imperfectly shared by lenders. Progressive lending enables lenders to identify “bad borrowers” (or “natural defaulters”) to whom they immediately stop lending.32
that households who are excluded from the formal sector may be able to obtain an informal loan: the lack of property title or a bad formal credit history are not taken as sign of credit unworthiness by informal lenders. Furthermore, differences in the selection process also explain why informal loan applications imply lower transaction costs for the applicant than formal applications. In the formal sector, applicants must pay fees to register their mortgages with the Public Registry, and complete lengthy paperwork, while in the informal sector, they just need to manifest their demand.33
4.2
Loan monitoring and recovery
Two key lending practices enable informal lenders to control the use of their loans and to update their expectation of the borrower’s repayment capacity. First, they actively seek information about their borrowers’ production after the first installment. They ask the borrower’s neighbors about the borrower’s crop or they directly visit the borrower’s farm. This enables informal lenders to gauge the borrower’s future output and to adjust loan sizes and disbursement dates. In addition, information collected during the season is useful in case of default, as it helps lenders to distinguish between voluntary and involuntary default. As documented above, voluntary default has more severe consequences as it may lead to a conflict between borrower and lender. Second, informal lenders generally disburse part of the loan in-kind which limits the diversion of credit to non-production uses. The most common practice is to provide borrowers with inputs, such as fertilizer and, in some cases, hired labor. Both active information seeking and in-kind disbursement raise the probability that a borrowers’ farm revenue is high enough to cover his debt. In other words, these monitoring techniques help informal lenders overcome ex-ante moral hazard.34 While formal lenders also monitor borrowers, they do so significantly less than informal lenders. Loans are always disbursed in cash, so formal lenders have no direct control over input use. Still, they try to time loan disbursements to match the farmers’ need for liquidity over the course of the season.35
Loan recovery technologies also vary greatly across sectors. In the formal sector, borrow-ers are expected to visit the bank to repay their loan. If they do not repay on time, the loan immediately enters into delinquency and the procedure described in section 3 is initiated. While there is a variety of loan recovery practices within the informal sector, repayment is often in-kind, especially when the lender is a trader, and the lender picks up the crop in the farmer’s field at harvest. The latter practice is a common feature of informal credit market (Ray, 1998) that considerably limits the scope for voluntary default as the lender gets to place first claim on the product . It thereby helps informal lenders overcome ex-post moral hazard.36 Finally, as informal lenders need not rely on contractual risk to overcome information asymmetries, they can offer loans that entail lower risk than formal loans and thereby informal lenders may alleviate risk rationing in the formal sector.
Two key elements emerge and explain the ability of informal lenders to overcome moral hazard and adverse selection without relying on contractual risk. First, informal lenders are closer to borrowers both physically and socially. Because they live in the same community as their borrowers, they have prior knowledge about loan applicants and it is easy for them to gather additional information. Second, informal lenders enjoy economies of scope. They tend to interlink credit with the other activities they engage in, which help them screen, monitor, and enforce loan repayment at low cost. Recall that proximity and the fact that informal lenders engage in other business activities with members of their borrowers’ communities also prevent them from enforcing repayment with measures that would be perceived as exploitative.37 As a result, while proximity and economies of scope enjoyed by informal lenders contribute to raising efficiency in the credit market by helping lenders overcome information asymmetries, they also limit lender’s use of coercive methods. To conclude, proximity and economies of scope contribute to explain the differences in lending technology, in contract terms, and ultimately the coexistence of loan sectors.
5
Conclusion
The description of the lending technologies adopted by formal and informal lenders in Piura fits a textbook picture. More geographically and socially distant formal lenders rely on contractual incentives, in the form of harsh punishment in case of default, to overcome information asymmetries, whereas more informed informal lenders substitute information intensive lending technologies for contractual risk. While these contrasts across sectors have been reported in other contexts, their full consequences on household’s choice of loan sec-tor have been largely overseen in the empirical literature on credit markets. In addition to enabling informal lenders to supply those excluded from the formal sector, screening, mon-itoring and recovery techniques adopted by informal lenders enable them to offer contracts that are preferred by some households, despite their larger interest rate. First, screening methods in the informal sector do not require an expensive loan application process. As a result, transaction costs in the informal sector are lower than in the formal sector, which may drive the effective cost of an informal loan below that of a formal loan. For some households, an informal loan may thus be the cheapest option, in terms of effective cost. Second, efficient direct screening, monitoring and loan recovery techniques enable informal lenders to offer loans with more generous restructuring conditions in case of default, and thus lower, risk than formal loans. Consequently, risk averse households may prefer an informal loan, even if it is more expensive.
In order to design appropriate instruments that would strengthen the formal sector and raise efficiency and equity, it is essential to first understand the various reasons why house-holds use informal loans. This paper shows that the existence of an expensive informal credit market cannot be equated with problems of access to the formal credit market. It suggests that land titling programs that have been initiated in various countries with the hope of enabling farmers to use their land as collateral may have disappointing results if households are discouraged by the transaction costs or the risk implied by a formal loan. The inability of farm households to insure themselves against the myriad risks that they face, combined
with the high cost of formal loan application and the inability of banks to offer low risk loans to borrowers, reduces households’ participation in formal credit markets. Appropriate policy responses may include improvements in insurance mechanisms that rural households have access to and improvement in the efficiency of legal systems that would reduce the cost of collateral registration.
References
Aleem, I. (1993). Imperfect informatoin, screening and the costs of informal lending: study of a rural credit market in Pakistan. In Hoff, K., Braverman, A., and Stiglitz, J., editors, The economics of rural organization: theory, practice and policy, chapter 10. Oxford University Press for the World Bank, Oxford; New York; Toronto and Melbourne.
Barham, B., Boucher, S., and Carter, M. (1996). Credit constraints, credit unions, and small scale-producers in Guatemala. World Development, 24(5):792–805.
Bell, C., Srinivasan, T., and Udry, C. (1997). Rationing, spillover, and interlinking in credit markets: The case of rural Punjab. Oxford Economic Papers, 49:557–585.
Boucher, S. (2000). Information Asymmetries, Risk and Non-Price Rationing: An Explo-ration of Rural Credit Markets in Northern Peru. PhD thesis, University of Wisconsin. Boucher, S., Carter, M., and Guirkinger, C. (2005a). Risk rationing and activity choice.
Working Paper 05-010, Department of Agricultural and Resource Economics, University of California - Davis.
Boucher, S. and Guirkinger, C. (Forthcoming). Risk, wealth and sectoral choice in rural credit markets. American Journal of Agricultural Economics.
Boucher, S., Guirkinger, C., and Trivelli, C. (2005b). Direct elicitation of credit constraints: Conceptual and practical issues with an empirical application. mimeo, University of Cal-ifornia - Davis.
Carter, M. (1988). Equilibrium credit rationing of small farm agriculture. Journal of Devel-opment Economics, 28(1):83–103.
Chung, I. (1995). Market choice and effective demand for credit: The roles of borrower transaction costs and rationing constraints. Journal of Economic Development, 20(2):23– 44.
Conning, J. (1996). Financial Contracting and Intermediary Structures in a Rural Credit Market in Chile: A Theoretical and Empirical Analysis. PhD thesis, Yale University. Conning, J. and Udry, C. (2005). Rural financial markets in developing countries. In Evenson,
R., Pingali, P., and Schultz, T., editors, The Handbook of Agricultural Economics, Vol.3. Esevier, North-Holland.
Feder, G. (1985). The relation between farm size and farm productivity. Journal of Devel-opment Economics, 18(2-3):297–314.
Fort, A., Boucher, S., Cortez, R., and Riesco, G. (2001). La peque˜na agricultura piurana: Evidencias sobre ingreso, cr´edito y asistencia t´ecnica. Universidad del Pacifico, Cipca, Lima.
Gonzalez-Vega, C. (1984). Credit-rationin behavior of agricultural lenders: The iron-law of interest-rate restrictions. In Dale W. Adams, D. H. G. and Pischke, J. V., editors, Undermining Rural Development with Cheap Credit, chapter 7. Westview Press, Boulder and London.
Gosh, P. and Ray, D. (2001). Information and enforcement in informal credit markets. mimeo.
Hausman, J. (1978). Specification tests in econometrics. Econometrica, 46:1251–1271. Hoff, K. and Stiglitz, J. (1990). Imperfect information and rural credit markets: Puzzles and
policy perspectives. World Bank Economic Review, 5:235–250.
Jappelli, T. (1990). Who is credit constrained in the U.S. economy? Quarterly Journal of Economics, 105(1):219–234.
Kochar, A. (1992). An empirical investigation of rationing constraints in rural credit markets in India. mimeo, Stanford University.
Mosley, P. (1999). Micro-macro linkages in financial markets: the impact of financial lib-eralization on access to rural credit in four African countries. Journal of International Development, 11:367–384.
Mushinski, D. (1999). An analysis of loan offer functions of banks and credit unions in Guatemala. Journal of Development Studies, 36(2):88–112.
Ray, D., editor (1998). Development Economics. Princeton University Press.
Simwalla, A., Pinthong, C., Poapongsakorn, N., Satsanguan, P., Nettayarak, P., Mingma-neenakin, W., and Tubpun, Y. (1990). The Thai rural credit system: Publich subsidies, private information, and segmented markets. The World Bank Economic Review, 4:271– 295.
Stiglitz, J. and Weiss, A. (1981). Credit rationing in markets with imperfect information. American Economic Review, 73(3):383–410.
Trivelli, C. (2003). Non formal credit for rural agricultural areas: new evidence for an old problem. Latin American Studies Series, 2:11–27.
VonPischke, J., Adams, D., and Donald, G., editors (1983). Rural Financial Markets in Developing Countries. The Johns Hopkins University Press, Baltimore.
Wooldridge, J. M. (2001). Econometric analysis of cross section and panel data. The MIT Press, Cambridge.
Notes
1Coexistence of formal and informal credit markets has been reported for example by
Conning (1996) in Chile, Trivelli (2003) in Peru and Mosley (1999) in four different African countries.
2Boucher (2000) provides a detailed description of the sample and of its construction. 3Fort et al. (2001)
4This figure was computed using the lists of water users maintained by the local irrigation
commissions.
5This credit module expands on the Jappelli (1990) and Feder (1985) method of direct
elicitation of credit constraints.
6 Boucher et al. (2005b) provide a methodological discussion of the classification used
here.
7Price rationing is the equilibrium outcome in a market with perfect information cleared
by price. Households that are price rationed in the credit market have their loan demand met in that market, whether or not they borrow.
8These banks are the Caja Municipal de Ahorro y Credito (CMAC) Piura, the CMAC
Sullana, the Caja Rural de Ahorro y Credito (CRAC) Paita, and the CRAC San Martin.
9The semi-formal sector corresponds to NGOs and government programs offering
sub-sidized loans to targeted groups of farmers. These programs have been largely shut down between 1997 and 2003 due to the deterioration of their financial situation when many farm-ers were not able to repay their debt after El Ni˜no in 1998. The vast majority of households in Piura have no access to these loans, and thus this sector is largely ignored in the ensuing analysis.
10To cultivate one hectare of rice, farmers spend about $1000 on fertilizer, pesticides,
machinery rental and labor. For a farmer cultivating three hectares, these expenses represent 70% of the average sampled household income in 2003.
demand for formal loan - seek informal finance. A plausible answer is that, since formal loans are nearly exclusively granted for a planed investment, borrowers in the formal sector may still rely on informal finance for small immediate cash needs.
12I do not examine loans for the establishment of perennial crops, since these loans are
extremely rare in the sample.
13There is no clear prediction about the sign of parameters on the remaining variables in
Xit as they are likely to impact both supply and demand in opposite direction and have an
ambiguous impact on the dependent variable.
14The null hypothesis states that the difference in parameter estimates across specifications
is not statistically significant. A statistically significant difference would be interpreted as evidence against the random effects assumption, since the fixed effects specification is consistent when the individual is correlated with other explanatory variables, but the random effects specification is not. For a discussion of the test, see Wooldridge (2001).
15However, note that the potential offsetting effects of wealth on the demand and supply
of informal loans cannot be identified with this reduced form model.
16This increase in the average maturity in the formal sector is, at least in part, due to the
long-term refinancing of a few loans on which farmers defaulted in 1998 following El Ni˜no.
17As a consequence, 30% and 21% of informal loans are excluded from the computation
of interest rates in 1997 and in 2003, respectively.
18Note that, in contrast to what has been described in other contexts (for example Kochar,
1992), few loans correspond to unlinked transactions with zero interest rate made by family and friends (3.4% and 3.8% in 1997 and 2003, respectively.)
19The analysis of specific contracts for rice shows that indeed these implicit interest rates
are very similar to the explicit rates. In 2003, for example, a common contract between a rice mill and a farmer was to deliver 1.5 bags of rice for each bag of urea lent 3 months before the harvest. The bag of urea was worth 38 soles at that time while the rice sold for 25 soles at harvest. The corresponding simple interest is 11% per month and is in line with the mean explicit interest rate from the household survey.
20The 2003 household survey did not precisely capture transaction costs. If anything,
transaction costs have decreased between 1997 and 2003 as reforms of the legal system have reduced the costs of registering mortgages.
21In addition to monetary transaction costs, the process of applying for a formal loan may
also generate social discomfort or feelings of shame. This was often brought up by farmers during interviews. In a society such as rural Peru where class structures are very rigid and rural farming populations are at the bottom of the social scale, it is not surprising that illiterate farmers associate strong discomfort with dealing with highly educated employees of formal, urban institutions. This feeling is absent from transactions with informal lenders who are much closer socio-economically to them. While not quantifiable, the discomfort associated with formal loans contributes to raising the utility cost of formal loans.
2298% of the mortgages in the formal sector are in the form of agricultural land; the
remaining 2% are mortgages on houses. Interviews with loan officers at local banks suggest that the percentage of formal loans that require collateral is even higher than that suggested by the household reported figures. Loan officers claim that unsecured loans are very rare, and by no means amount to 40% of all formal sector loans. One explanation for the difference between the collateral requirements reported by borrowers and by lenders is that the same mortgage can be used for several subsequent loans from the same bank. Consequently, some borrowers reported the mortgage in the survey only when they had gone through its registration when applying for the particular loan that was discussed. Thus, the survey provides a lower bound of the percentage of loans that required a mortgage.
23According to Peruvian law, justices of the peace can resolve conflicts on debt up to$1000.
Their other primary responsibilities include resolving conflicts over alimony and domestic disputes.
24If the borrower’s household has monthly income, the borrower may be asked to pay
monthly installments.
25Twelve out of twenty informal lenders have appealed to a justice of the peace and, in all
remains rare, though. Informal lenders reported that, generally, less than 1% of all the loan they ever gave out led to the appeal to a justice of the peace. Similarly all but six lenders reported having written off debt, but not for less than 2% of the all loans they made.
26The calculation is based on lenders’ surveys. This amount includes potential travel
expenses of the justice of the peace when he investigates the case and paperwork expenses, such as the letters sent to the delinquent borrower. The justice of the peace is not paid by the parties for his services, and, to my knowledge, there is no bribe.
27To illustrate the difference in restructuring costs between sectors, consider the following
case based on the agricultural loan policy of one local bank. Imagine that a farmer took a loan of $1000 for 6 months. However, his harvest failed, so he cannot repay. The borrower would likely be given an additional 12 months to repay the loan with his next harvest. While the annual interest rate on the original $1000 loan is 57%, the bank charges a penalty so that the restructured annual interest rate reaches 117%. Thus, for the first six months the farmer owes 26.5% of the principal in interest payment and this, added to the principal, defines the amount restructured ($1265.) For the last 12 months, he is charged 117% of the restructured amount in interest. After 18 months, total interest payments on the original loan represent $1745. Now imagine that the same loan of $1000 was made by an informal lender for 6 months but with the average informal interest rate of 121% (Table 5.) When the loan reaches its term and it is clear that the borrower cannot repay, lender and borrower agree on restructuring the loan for the same additional term of 12 months. In that case, since interest freezes, total interest payments after 18 months are only 60.5% of the principal, or$605, which is less than half the total interest payments in the formal sector.
28These default rates are based on information given by formal and informal lenders during
interviews. They correspond to the average percentage of loans that are not fully recovered on time each agricultural season. These low default rates imply that, even if informal lenders would forgive debts when borrowers default, informal loans would still be more expensive than formal ones.
period.
30Credit bureaus in Peru are well developed. They provide information about individual
credit history and debt status in any bank as well as in many unregulated microfinance institutions. In addition, credit bureaus maintain information about denunciations filed at the chamber of commerce and unpaid taxes or utility bills.
31The water bill (plan de cultivo de riego) is paid annually to the irrigation district to
guarantee right to irrigation water.
32In addition, progressive lending helps to guarantee repayment in a context of competition
because it makes termination costly for borrowers. Even if defaulters find a new loan, they will have to go through a lengthy testing period before having access to better terms.
33Note that I omit from this discussion the “building of trust” that may be necessary to
obtain a loan in the informal sector. If applicants in the informal sector need to engage first in non-credit transactions before obtaining a loan, the application process may actually be long and expensive. It is difficult to directly assess this non-monetary cost, but two pieces of evidence suggest it is not an obstacle to obtaining informal loans. First, my discussions with farmers suggest that they generally have no difficulties finding an informal lender willing to offer them a loan. Second, the ease of the application process was cited as a major advantage of the informal loan sector compared to the formal sector during focus group meetings with farmers.
34Ex-ante moral hazard occurs when the lender cannot control borrowers’ actions that are
taken between loan disbursement and maturity and that may influence the repayment of the loan. Ex-post moral hazard would corresponds to voluntary default once the loan reaches maturity.
35As in the case of informal loans, the average number of disbursements for formal loans
was 2.5 in 1997. Loan officers visit each borrower at least once during the agricultural season, but their visits are extremely short, and only enable them to detect major problems.
36Similarly to what Conning (1996) describes in Chile, the challenge for lenders adopting
traders. Crop pick-up in the field is therefore an efficient loan recuperation method for crops that have a short and well defined harvest period, as in the case of rice in Piura. In the case of cotton that is picked four times over a two-month period, pirate sales are more difficult to avoid and loans from traders are small and rarer. This observation is consistent with what Simwalla et al. (1990) reports for manioc and sugar cane in the Philippines.
37Lenders worry all the more about their reputation when borrowers have a choice of
lenders. The existence of harsh competition in the informal loan sector as well as in the input and output markets therefore contribute to reduce the use of coercive recuperation methods.
Table 1: Household credit market participation (499 households)
1997 2003
Only formal loan 19% 18%
Only informal loan 27% 26%
Both 7% 7%
Semi-formal loan 15% 7%
Table 2: Informal loan use by formal sector outcome (sample pooled across years)
Formal sector outcome Frequency % using informal loans
PRwl 260 24% PRwol 232 25% QR 244 48% TCR 105 45% RR 157 41% Total 998 35%
Table 3: Definition and summary statistics of explanatory variables (pooled sample)
Variable Definition Mean St. dev.
wealth total wealth (constant 2003$) 3908.67 8498.68
farm size farm size in hectares 4.36 5.40
education education of household head in years 4.69 3.77
hh size number of household members 5.26 2.46
dep dependency ratio, # children(<15)/# hh members 0.26 0.27
semiformal =1 if household has a semi formal loan 0.13 0.33
banana =1 if household has bananas 0.22 0.41
ancrop =1 if household has annual crops 0.75 0.43
BajP =1 if household is in valley Bajo Piura 0.27 0.44
AltP =1 if household is in valley Alto Piura 0.14 0.35
Chira =1 if household is in valley Chira 0.42 0.49
SanLo =1 if household is in valley San Lorenzo 0.07 0.25
Table 4: Parameter estimates from the use of informal loan regression (standard errors in parentheses)
(i) (ii) (iii)
Variable Random Effects Fixed Effects Marginal of (i) PRwo QR 1.390∗∗∗ 1.495∗∗∗ 0.333∗∗∗ (0.231) (0.338) (0.053) RR 0.978∗∗∗ 1.009∗∗∗ 0.233∗∗∗ (0.243) (0.373) (0.059) TCR 1.077∗∗∗ 1.365∗∗∗ 0.257∗∗∗ (0.275) (0.407) (0.066) wealth 0 0 (0.000) (0.000) farm size 0.044 0.027 (0.030) (0.110) semiformal −1.060∗∗∗ −1.283∗∗∗ (0.278) (0.389) ancrop 0.830∗∗∗ 0.218 (0.246) (0.386) banana −0.097 −0.352 (0.242) (0.489) nofarm −1.459∗∗ −1.042 (0.723) (0.771) hh size 0.082∗∗ 0.071 (0.037) (0.070) dep −0.145 −0.822 (0.338) (0.708) education 0.036 (0.025) BajP 0.657∗ (0.361) AltP 0.706∗ (0.400) Chira 0.377 (0.345) SanLo −0.881 (0.594) t 0.159 (0.168) Constant −2.950∗∗∗ (0.466)
∗∗∗,∗∗ and∗ indicate that the parameter estimate is significantly
different from 0 at 1%, 5%, and 10%, respectively. Marginal effects are computed at the mean value of continuous variables, for a household who farms, has no semiformal loan, has no bananas, has annual crops, and lives in Chira.
Table 5: Comparison of mean contractual terms between sectors 1997 2003 Loan size (2003 US$) Formal sector 2900* 1560* Informal sector 490 350 Maturity (month) Formal sector 9* 12* Informal sector 6 5
Annual interest rate
Formal sector 58%* 69%*
Informal sector 101% 121%
Transaction costs ($ and % of loan size)
Formal sector 74.5 (3.7%)
Informal sector 5.5 (2%)
Mortgage requirement
Formal sector 59%* 58%*
Informal sector 2% 9%
∗ Term significatively different (at 5%) from the same term in the
Table 6: Summary of the consequences of default in the formal and informal loan sectors
Formal sector Informal sector
Refinancing common common
term ≥1 crop cycle ≥1 crop cycle
interest rate charged? YES NO
financial penalties charged? YES NO
Judicial action relatively rare relatively rare
authority in charge civil judge justice of the peace
length of the procedure several months, years couple of days
results collateral foreclosure refinancing (common)
asset seizure (rare)