Publisher’s version / Version de l'éditeur:
Vous avez des questions? Nous pouvons vous aider. Pour communiquer directement avec un auteur, consultez la première page de la revue dans laquelle son article a été publié afin de trouver ses coordonnées. Si vous n’arrivez pas à les repérer, communiquez avec nous à [email protected]. Questions? Contact the NRC Publications Archive team at
[email protected]. If you wish to email the authors directly, please see the first page of the publication for their contact information.
https://publications-cnrc.canada.ca/fra/droits
L’accès à ce site Web et l’utilisation de son contenu sont assujettis aux conditions présentées dans le site LISEZ CES CONDITIONS ATTENTIVEMENT AVANT D’UTILISER CE SITE WEB.
Building Science Insight 2006/07 - Sustainable Infrastructure: Techniques, Tools
& Guidelines [Proceedings], 2006-09-01
READ THESE TERMS AND CONDITIONS CAREFULLY BEFORE USING THIS WEBSITE. https://nrc-publications.canada.ca/eng/copyright
NRC Publications Archive Record / Notice des Archives des publications du CNRC :
https://nrc-publications.canada.ca/eng/view/object/?id=300d4de2-1cba-4aa2-a37b-3e6518f2e8ae https://publications-cnrc.canada.ca/fra/voir/objet/?id=300d4de2-1cba-4aa2-a37b-3e6518f2e8ae
NRC Publications Archive
Archives des publications du CNRC
This publication could be one of several versions: author’s original, accepted manuscript or the publisher’s version. / La version de cette publication peut être l’une des suivantes : la version prépublication de l’auteur, la version acceptée du manuscrit ou la version de l’éditeur.
Access and use of this website and the material on it are subject to the Terms and Conditions set forth at
Risk-based maintenance optimization of aging highway bridge decks
http://irc.nrc-cnrc.gc.ca
Risk -Ba se d M a int e na nc e
Opt im izat ion of Aging H ighw a y
Bridge De ck s
N R C C - 4 8 3 8 3
Z o u b i r L o u n i s
S e p t e m b e r 2 0 0 6
Building Science Insight 2006
Sustainable Infrastructure: Techniques, Tools & Guidelines
A version of this paper is published in / Une version de ce document se trouve dans:
Proceedings of an international conference on advances in engineering structures, mechanics & construction, held in Waterloo, Ontario, Canada, May 14-17, 2006, pp. 723-734
RISK-BASED MAINTENANCE OPTIMIZATION OF AGING HIGHWAY BRIDGE DECKS
By Zoubir Lounis
Research Officer & Group Leader, Institute for Research in Construction National Research Council, Ottawa, Ontario, Canada
E-mail: [email protected]
Abstract
This paper presents a practical approach for maintenance optimization of a network of aging highway bridge decks that integrates a stochastic deterioration model based on Bogdanoff’s cumulative damage theory with an effective multi-objective optimization approach. The multi-objective maintenance optimization takes into account all relevant objectives, such as improving bridge deck condition, minimizing maintenance costs, and minimizing traffic disruption and associated user costs. The consideration of these three objectives enables to take full advantage of the available bridge inspection data and implicitly lead towards the minimization of the risk of failure due to bridge deck deterioration and maintenance activities. A multi-objective optimality index is proposed as an optimality criterion for priority ranking of the deficient bridge decks for maintenance. The obtained optimal maintenance project prioritization strategy achieves a satisfactory trade-off or compromise between the selected relevant and competing optimization objectives. The proposed approach is illustrated on a small network of ten bridge deck projects that are optimized for maintenance.
Introduction
The deterioration of reinforced concrete bridge decks due to reinforcement corrosion is recognized as the main cause of failure of bridge decks and it is estimated that one-third to one-half of the projected bridge rehabilitation costs in North America are related to bridge deck deterioration (Weyers 1998; Lounis and Mirza 2001). The corrosion of the reinforcing steel is caused by the chlorides (from deicing salts), which penetrate the concrete cover and destroy the protective passive film on the steel reinforcement. As the corrosion products accumulate, they generate high tensile stresses, which eventually lead to irreversible damage such as concrete cracking, delamination and spalling. Furthermore, corrosion leads to reduction of concrete and reinforcement cross sectional areas, loss of bond between steel and concrete, reduction in strength, and ductility. The effects of corrosion are compounded by other deterioration factors, such as initial damage (e.g. due to shrinkage cracking), increased traffic loads, freeze-thaw cycles, poor workmanship, and inadequate maintenance.
The extensive deterioration of highway bridge decks in North America and the limited funds allocated for their maintenance present considerable technological and economic challenges for bridge owners and managers, namely: (i) which bridge decks to maintain; (ii) when to maintain them; and (iii) how to maintain them (i.e. identify the most effective maintenance strategy, which could be a patch repair, overlay, partial depth replacement and overlay, cathodic protection, total replacement, etc.). The importance of a pro-active maintenance policy is confirmed by the study carried out by Dunker and Rabbat (1990) on the performance of highway bridges included in the U.S. National Bridge Inventory (NBI), which showed that bridge deterioration varied considerably from state to state with the highest deterioration level being observed in the central and southeastern states, while the lowest deterioration was observed in the southwestern states. This considerable difference in structural deficiency between the different states was attributed to differences in design, construction, inspection, funding and most importantly maintenance policies.
Different approaches to maintenance optimization have been implemented in the different bridge management systems ranging from simplified economic models to advanced Markovian decision processes. In the literature on bridge management, the main optimization objective used for maintenance optimization is the minimization of the present value life cycle cost, which represents all
the costs incurred throughout the life cycle of a bridge structure, including, the costs of design, construction, maintenance, repair, rehabilitation, replacement, demolition, and in some instances users’ costs, and possibly costs of failure. Most of these systems are based on a single-objective optimization , namely, the minimization of the maintenance costs.
Given the importance and high consequences of failure of highway bridge structures, a risk-based maintenance management methodology can be more effective and objective as it enables the optimization of different types of structures and systems from different bridges within a network by considering not only their probability of failure but also their consequences of failure. The implementation of a quantitative risk-based bridge maintenance management, however, is very complex task due to the difficulties of assessing quantitatively the probability and the consequences of failure, especially for a large network of bridge structures.
The failure modes of bridge decks may include the loss of serviceability (e.g. excessive cracking, concrete delamination and spalling, and deformation), loss of functionality (e.g. poor traffic conditions, inadequate deck geometry/approach roadway alignment, limited clearance, etc.), and possibly the partial or total collapse. As mentioned earlier, the loss of serviceability and loss of functionality, although not catastrophic or life-threatening, are by far the most frequent failure modes for bridge decks and involve significant cumulative costs. The consequences of failure of highway bridges are multiple and may include loss of life, injury, excessive maintenance costs, user costs, traffic disruption, environmental impacts, etc. It is clear that some of these consequnces are incommensurable and cannot be evaluated in monetary terms.
To overcome the above difficulties, a multi-objective maintenance optimization approach that enables to consider all relevant criteria of a risk-based approach, namely the maximization of condition rating, minimization of maintenance costs, and minimization of user costs is presented in this paper. The proposed approach can address the requirements of many decision-makers (bridge owners/ managers/ engineers) seeking to satisfy implicitly and/or explicitly several objectives at the same time in planning the maintenance of a large network of aging bridge decks. The proposed approach enables a better evaluation of the effectiveness of maintenance strategies in terms of several criteria and determines the optimal solution that achieves the best trade-off between all criteria (including conflicting ones, such as condition and cost).
Methodology for Risk-Based Maintenance Optimization
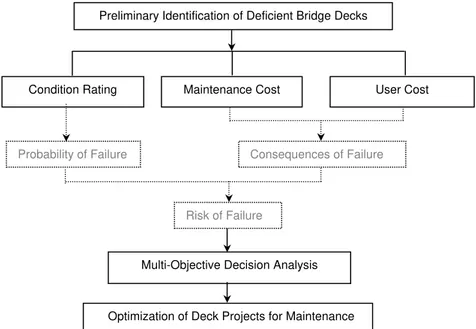
The proposed methodology for network-level bridge deck maintenance optimization is based on the simultaneous satisfaction of three relevant and competing criteria, namely: (i) maximization of condition rating; (ii) minimization of maintenance costs; and (iii) minimization of user costs. The development of such a methodology requires the integration of three simple and practical decision support models, namely: (i) qualitative condition assessment model; (ii) qualitative deterioration prediction model; and (iii) multi-objective optimization model to determine the optimal maintenance strategy for a network of bridge decks. The proposed methodology is symbolically outlined in Fig.1. The qualitative condition assessment model enables to take full advantage of the available bridge inspection data. The deterioration of bridge decks is modeled using an appropriate stochastic process that captures the time-dependence and uncertainty of the deterioration mechanism. The deterioration prediction model is compatible with the existing condition assessment procedure, and is developed based on the historical field performance data collected during bridge inspections.
As mentioned earlier, the governing failure modes for bridge decks are the loss of serviceability and loss of functionality due to corrosion-induced damage. The consequences of bridge deck deterioration can range form a simple riding discomfort to a loss of life as a result of a traffic accident on the deteriorated deck or on a detour route (with a poor condition) due to the closure of one lane or the entire bridge during its maintenance or due to its excessive deterioration. As opposed to life cycle cost or cost-benefit criteria used in most bridge maintenance optimization studies, the use of a risk of failure as a criterion for maintenance optimization is more rational and relevant, however its implementation is not easy given the complexity of assessing the consequences of failure in monetary
terms This means that monetary values need to be assigned for fatalities, injuries, and social costs which are not easily quantified, and various methods have been developed.
Optimization of Deck Projects for Maintenance Condition Rating
Preliminary Identification of Deficient Bridge Decks
Maintenance Cost User Cost
Consequences of Failure
Multi-Objective Decision Analysis Probability of Failure
Risk of Failure
Fig. 1. Schematic of multi-objective maintenance optimization approach for bridge decks
Given the difficulty of accepting the notion of placing any sort of value on human life, Starr (1969) evaluated the risk of death from various causes and identified two general categories for risk of death: (i) risk associated with voluntary activities in which the individual evaluates and adjusts his exposure to risk; and (ii) risk associated with involuntary activities, which are determined by regulations from governmental agencies. Starr (1969) indicated that the public typically was willing to accept voluntary risks 1,000 times greater than involuntary risks. Paté-Cornell (1994) proposed
different ranges of acceptable levels of risks for the public and workers ranging from 10−8 to 10−3 per
year.
The consideration of these three objectives within the multi-objective optimization framework is a practical approach for the solution of the risk minimization problem through the minimization of the probability of failure (by maximizing the condition rating) and minimization of the consequences of failure (by minimizing the maintenance costs and user costs), as indicated in Fig.1. The proposed approach overcomes the difficulties of assessing quantitatively the probability of failure and the consequences of failure for a large network of bridge decks. A detailed description of the models is
given in the next sections.
Predicting Deterioration of Bridge Decks using Bogdanoff’s Cumulative Damage Model
Different types of models, including empirical, mechanistic, statistical, and logistic haven been proposed in the literature for the prediction of bridge deck deterioration (Golabi and Shepard 1997; Frangopol et al. 1997; Weyers 1998; Stewart and Rosowsky 1998; Lounis and Madanat 2002; Morcous et al. 2003). The prediction of the deterioration and service life of bridge decks is a difficult task due to the complexity of the mechanisms involved, such as the penetration of chlorides into concrete, onset of corrosion, damage initiation, damage accumulation, and coupling effects of corrosion and other deterioration factors (e.g. traffic load, initial damage, etc.). This deterioration prediction is further complicated by the considerable uncertainty in the governing parameters of the damage initiation and accumulation models, as well as in the uncertainty in the models themselves. The fluctuations from mean performance and mean life are sufficiently large and cannot be ignored without serious consequences owing to the large fluctuations in the in-service environment, deck
design, initial damage, etc. Hence, a probabilistic modeling of the damage accumulation and service life is required to achieve reliable results. Furthermore, these models should be developed by using the available data collected during the regular or special inspections of bridge structures in the inventory of highway agencies. These models can be updated as more data become readily available and/or by using data from long term in-service exposure, accelerated laboratory testing, or from the use of fundamental mechanistic models (Golabi and Shepard 1997; Lounis and Madanat 2002; Morcous et al. 2003).
Condition Assessment Model
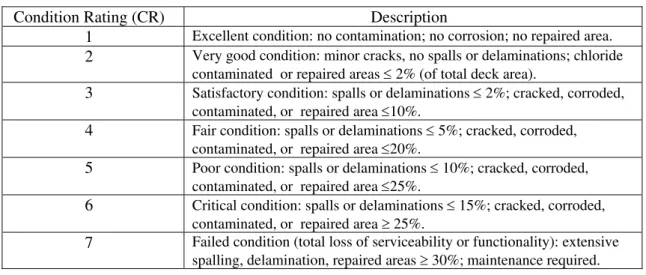
In order to ensure the implementation of the proposed methodology, it is imperative to take full advantage of the bridge inspection data collected in the bridge inventory database of different highway agencies. In general, highway bridge decks (and other bridge components) are inspected every two years on average (FHWA 1995; MTO 1989). The inspector rates the condition of the bridge deck and assigns condition ratings for the deck. This condition rating consists of mapping the level of observed damage in the structure during visual inspections and non-destructive evaluation (or predicted using empirical or statistical methods) onto a discrete (1 to 9, 1 to 7, or 1 to 5) rating scale. Concrete bridge decks are inspected for cracking, spalling, delamination, potholing, rust staining, scaling, reinforcement corrosion, chloride contamination, and partial or full depth failures. In this paper, the condition rating (CR) of concrete bridge decks is based on the following seven-state rating scale, which reflects the different damage seven-states associated with chloride-induced corrosion and is adapted from existing different condition assessment systems (Golabi and Shepard 1997; FHWA 1995; MTO 1989; Morcous et al. 2003). Table 1 provides a summary description of the adopted condition rating system.
Table 1. Condition rating system for concrete bridge decks
Condition Rating (CR) Description
1 Excellent condition: no contamination; no corrosion; no repaired area.
2 Very good condition: minor cracks, no spalls or delaminations; chloride contaminated or repaired areas ≤ 2% (of total deck area).
3 Satisfactory condition: spalls or delaminations ≤ 2%; cracked, corroded, contaminated, or repaired area ≤10%.
4 Fair condition: spalls or delaminations ≤ 5%; cracked, corroded, contaminated, or repaired area ≤20%.
5 Poor condition: spalls or delaminations ≤ 10%; cracked, corroded, contaminated, or repaired area ≤25%.
6 Critical condition: spalls or delaminations ≤ 15%; cracked, corroded, contaminated, or repaired area ≥ 25%.
7 Failed condition (total loss of serviceability or functionality): extensive spalling, delamination, repaired areas ≥ 30%; maintenance required.
Such a condition assessment system is very practical and cost-effective (in terms of inspection/evaluation costs) for the long- and short-term analysis of maintenance needs for a network of hundreds or thousands of structures, which is the case for many highway agencies. However, for safety-critical elements and for high-risk structures, a detailed and a more rigorous condition assessment may be required.
Bogdanoff’s Cumulative Damage Model
In this paper, a Bogdanoff’s cumulative damage (CD)-based model is used to predict the future condition and service life of reinforced concrete bridge decks. The proposed model assumes a probabilistic evolutionary structure of the damage accumulation process. The condition of the bridge deck is discretized into a finite state space with seven (7) damage states. A basic element of the model is the concept of duty cycle, which is a repetitive period of operation in the life of a deck in which the
damage accumulation is assumed non-negative (Bogdanoff 1978). A duty cycle is defined as one-year in which the deck is subjected to de-icing salts in winter, freeze-thaw cycles, traffic load (in addition to its own weight).
The probability distribution of damage after a duty cycle is assumed to depend only on the duty cycle itself and the damage accumulated at the start of the duty cycle; thus its is assumed independent of how the damage was accumulated at the start of the duty cycle. This represents the first-order type of stochastic process correlation underlying the Markovian process (Bogdanoff 1978). These assumptions lead to the fact that the damage process can be modeled as a time and discrete-state Markovian process (Bogdanoff 1978). The probabilistic evolution of damage is completely determined by the transition matrix for each duty cycle and initial damage state. The transition probability matrix for a duty cycle is given by:
P=[pj,k] j=1,2,……,b; and k=1,2,….,b (1a)
with pjk= P(Dt+1=k | Dt=j) (1b)
where pjk represents the probability of the deck being in state k at the end of the duty cycle given it
was in state j at the start of the duty cycle (with j < k for non-maintained systems). Damage states 1 to 6 are transient states, whereas damage state 7, denoted “state b” is called an absorbing state, which is a state that cannot be vacated without a maintenance action.
Given the adopted condition rating scale and short duration of the duty cycle or transition time (1 year), the probability of deteriorating by more than one state (i.e. multiple damage states transitions) may be assumed negligible (Golabi and Shepard 1997; Lounis 2000; Morcous et al. 2003). Therefore,
the transition matrix is greatly simplified and has only two elements per row, namely pk,k and pk,k+1,
which is referred to as the “unit jump Markov chain” (Bogdanoff 1978). Given the uncertainty in defining the end of life or failure criterion, it is possible to have different definitions of the absorbing state, depending on the requirements of the bridge owner, risk of failure, etc. The initial state of
damage D0 is identified by the vector p0=[po(i)]i=1,b, where po(i) is the probability of being in state i at
time t=0. This initial damage may arise from poor materials, inadequate design and/or construction. It follows from Markov chain theory (Bogdanoff 1978; Ross 1996) that the damage state vector at time
t, pt, is given by:
pt = po P1P2……..Pt = [pt(1) pt(2) pt(b)] (2a)
where Pj is the transition matrix for the jth duty cycle, and pt(k) is the probability of being in state k at
time t. If we assume that the duty cycles are all of constant magnitude throughout the deck lifetime, then the transition probability matrices are time-invariant and equal to P, which yields a stationary stochastic process. Therefore, Eq. (2a) simplifies to:
pt = po Pt (2b)
The above transition probability matrix is generated from the data collected during the inspections of the bridge decks. Contrary to lifetime models, the transition matrix and thus the proposed cumulative damage model can be developed from a limited set of data, which then can be further
refined using the Bayesian updating approach(Golabi and Shepard 1997; Lounis and Madanat 2002).
The probability that the deck be in damage state j at time t is given by:
P(Dt = j)= pt(j) (3a)
The cumulative distribution function of damage at time t, Dt, is defined by:
FDt(j)= P(Dt ≤ j) =
∑
(3b) = j k t k p 1 ) (The expected damage at time t, E[D(t)] is given by:
E[D(t)] =
∑
(3c) = b 1 j t(j) jpThe service life (L) of the deck may be defined as the time to absorption at state b. For the case of an
initial damage vector with p0(1)=1, its cumulative distribution function FL is given by (Bogdanoff
1978):
FL(t) = P(L ≤ t) = Pt(b) t=1, 2,…., n (4)
The expected service life E[L] is given by the mean time to absorption (Bogdanoff 1978), i.e.:
∑
(5) ∞ =−
=
1 t L(
t
)]
F
1
[
)
L
(
E
For the case of an initial damage vector with multiple nonzero elements, the cumulative distribution function of service life (or time to absorption) is given by (Bogdanoff 1978):
FT(t) = P(T ≤ t) =
∑
(6) − = 1 b 1 k Tk 0(k)F (t) pwhere FTk(t)is the cumulative distribution function of the time at which the damage state first enters
the absorbing state, given the initial damage state is k.
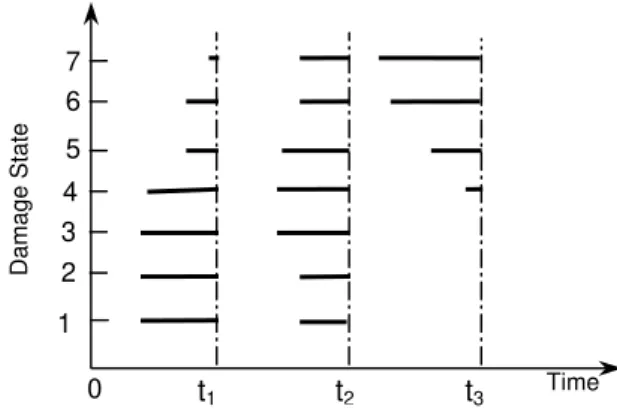
The probabilistic prediction of accumulation of damage in the bridge deck using Eq.(2a) is illustrated in Fig.2, which indicates the evolution with time of the probability mass function of the damage. In Fig.2, it is seen that in the early stages of the deck life, the probability mass of the damage is near state 1, but with aging and damage accumulation, this probability mass shifts to higher damage states. Ultimately, if no maintenance is undertaken, all the probability mass accumulates in the absorbing state 7 or state “b”.
Time Damage State 7 1 2 3 4 5 6 0 t1 t2 t3
Fig. 2. Probabilistic evolution of bridge deck deterioration using Bogdanoff’s CD model
Multi-objective Maintenance Optimization of Aging Bridge Decks
As discussed earlier, the actual maintenance optimization problem is multi-objective in nature as the bridge owner or manager seeks to satisfy simultaneously several objectives, such as the minimization of maintenance costs, improvement of safety, serviceability and functionality, minimization of maintenance time, minimization of traffic disruption, minimization of user costs, and minimization of risk of failure, etc. The solution of this maintenance management problem can be obtained using the techniques of multi-criteria or multi-objective optimization. Several approaches have been developed to solve multi-objective optimization problems, including multi-attribute utility theory (Von Neumann and Morgenstern 1947; Keeney and Raiffa 1976), weighted sum approach (Zadeh 1963), compromise programming, constraint approach, and sequential optimization (Koski 1984; Duckstein 1984; Lounis et al. 1993, 2000). In this paper, the compromise programming approach is used to solve the multi-objective maintenance optimization problem, and is presented in the next section.
Overview of Multi-objective Optimization Approach
For single-objective optimization problems, the notion of optimality is very well defined as the minimum or maximum value of some given objective function is sought. In multi-objective (or vector) optimization problems, the notion of optimality is not obvious because of the presence of multiple, incommensurable and conflicting objectives. In general, there is no single optimal (non-dominated or superior) solution that simultaneously yields a minimum (or maximum) for all objective functions. The Pareto optimality concept has been introduced as the solution to multi-objective
optimization problems (Koski 1984; Duckstein 1984). A maintenance strategy x* is said to be a Pareto
optimum if and only if there exists no maintenance strategy in the feasible set of maintenance alternatives that may yield an improvement of some criterion without worsening at least one other criterion. The multi-objective maintenance optimization problem can be mathematically stated as follows:
Find:
x
*=
[
x
*1,
x
*2,...,
x
*n]
=
optimum
(7a)Such that:
f
(
x
)
=
[
f
1(
x
),
f
2(
x
)...
f
n(
x
)]
=
min
imum
x∈Ω (7b)and max (7c) n 1 j j t , m (x ) C C ≤
∑
=}
{
x
∈
N
:
CR
(
x
)
≥
CR
th=
Ω
(7d)where: = vector of optimum solutions; f = vector of optimization objectives (e.g. condition rating,
maintenance cost, user cost, etc.); =maintenance cost of project at time t ; C
*
x
)
x
(
C
m,t jx
j max=available budget; Ω= subset of the bridge network that at time t contains deficient bridge decks having a condition rating (CR) above a specified threshold value (requiring maintenance); N= entire set of bridge deck projects within the network.
The concept of Pareto optimality mentioned above, may be stated mathematically as follows (Koski 1984; Lounis and Cohn 1993):
x* = Pareto optimum (8a)
if fi(x) ≤ fi(x*) for i=1,2,…,m (8b)
and fk(x) < fk(x*) for at least one k (8c)
In general, for a multi-objective optimization problem, there are several Pareto optima, and the problem is to select the solution that achieves the best compromise between all competing objectives. Such a solution is referred to as “satisficing” solution in the multi-objective optimization literature (Koski 1984; Lounis and Cohn 1995). The determination of this satisficing solution is discussed in the next section.
Decision-Making under Multiple and Conflicting Objectives
In compromise programming, the “satisficing” solution is defined as the solution that minimizes the distance from the set of Pareto optima to the so-called “ideal solution”. This ideal solution is defined as the solution that yields minimum (or maximum) values for all criteria. Such a solution does not exist, but is introduced in compromise programming as a target or a goal to get close to, although impossible to reach. The criterion used in compromise programming is the minimization of the
deviation from the ideal solution f* measured by the family of Lp metrics (Koski 1984; Lounis and
Cohn 1993). In this paper, a multi-criteria optimality or multi-objective index, “MOI”, is defined as the value of the weighted and normalized deviation from the ideal solution f* measured by the family
of Lp metrics: p / 1 p m 1 i i i(x) i i p i p f min ) x ( f max ) x ( f min ) x ( f w ) x ( MOI ⎥ ⎥ ⎦ ⎤ ⎢ ⎢ ⎣ ⎡ − − =
∑
= (9) 7/12This family of Lp metrics is a measure of the closeness of the satisficing solution to the ideal
solution. The value of the weighting factors wi of the optimization criteria fi (i=1,…,m) depends
primarily on the attitude of the decision-maker towards risk. The choice of p indicates the importance given to different deviations from the ideal solution. For example, if p=1, all deviations from the ideal solution are considered in direct proportion to their magnitudes, which corresponds to a group utility (Duckstein 1984). However, for p ≥2, a greater weight is associated with the larger deviations from
the ideal solution, and L2 represents the Euclidian metric. For p=∞, the largest deviation is the only
one taken into account and is referred to as the Chebyshev metric or mini-max criterion and L∞
corresponds to a purely individual utility (Duckstein 1984; Koski 1984; Lounis and Cohn 1995; Lounis and Vanier 2000). In this paper, both the Euclidean and the Chebyshev metrics are used to determine the multi-objective optimality index and corresponding satisficing solution.
Illustrative Example
The approach presented in this paper is applied for the maintenance optimization of 100 bridge deck projects from different bridges within a network of a highway agency. The objective here is to optimize the prioritization of the bridge deck projects for maintenance, considering simultaneously their condition rating, maintenance cost, and user costs, assuming a constraint on the allocated funding for the current year, which is assumed as $1.5 Million. The physical condition of the bridge decks is assessed using the 1-5 condition rating scale described earlier.
The deterioration of the bridge decks is predicted using the Bogdanoff’s cumulative damage model described earlier, assuming a unit-jump and stationary deterioration model. A constant duty cycle is assumed throughout the service life of bridge decks that consists in one-year exposure to chloride-induced corrosion due to deicing salts, freeze-thaw cycles, and traffic loading. The transition
probability matrix has the following elements (Lounis 2000): p11=0.7, p22=0.765, p33=0.85, p44=0.9,
and p55=0.98, p66=0.98, and p77=1. The probability mass function of the current network condition is
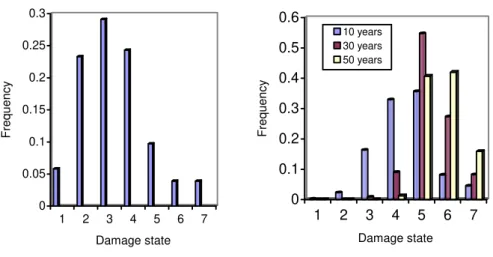
shown in Fig.3(a), and is given by the following initial condition vector:
p0=[0.06 0.34 0.31 0.19 0.08 0.01 0.01] (10a)
Using Eq. 2(b), the predicted deterioration of the bridge deck network after 10, 20 and 30 years is shown in Fig. 3(b). For example, after 30 years, the probabilistic distribution of the condition of the deck network is given by the vector:
p30=[0. 0. 0.008 0.089 0.547 0.273 0.082] (10b)
Hence, after 30 years, no deck of the network is in damage state 1 or 2 (i.e. no damage or minor damage), and about 90% of the deck network is in damage state 5, 6 or 7 (i.e. poor to failed states).
For bridge decks with condition ratings (or damage states) 1 or 2, no action or some preventive maintenance may be needed. For decks in damage states 3 and 4, some intermediate maintenance actions may be required (patch repair, asphalt overlay). For the decks with damage states 5 or higher, the possible maintenance actions include deck overlay using latex-modified concrete or low-slump dense concrete, cathodic protection, partial or complete replacement of the deck. To illustrate the application of the approach, the maintenance optimization is carried on a group of bridge decks with
damage states 5 or higher, i.e. the threshold condition rating CRth is assumed equal to 5.
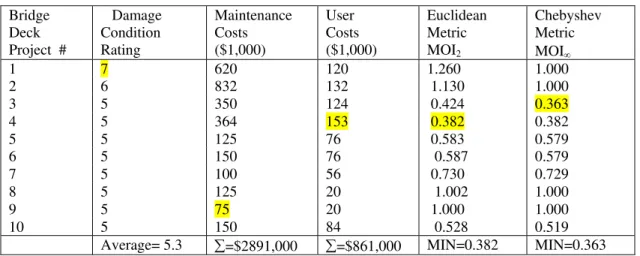
In this example, the maintenance alternatives are assumed optimized for the individual deficient bridge decks on the basis of life cycle cost minimization. The present value costs of the maintenance alternatives for the ten most damaged bridge decks are summarized in Table 2. The user costs are assumed to represent the sum of all costs incurred by the users during the maintenance activity, which include the delay costs, accident costs, and vehicle operating costs. These user costs depend primarily on the duration of the maintenance activity, average daily traffic, accident rate increase due to traffic detour or/and lane closure, and are summarized in Table 2.
0 0.05 0.1 0.15 0.2 0.25 0.3 Frequency 1 2 3 4 5 6 7 Damage state 0 0.1 0.2 0.3 0.4 0.5 0.6 Frequency 1 2 3 4 5 6 7 Damage state 10 years 30 years 50 years
(a) Current network condition (b) Network condition after 10, 30, and 50 years
Fig.3. Current and future network condition predicted using Bogdanoff CD model
The normalized values (normalized with regard to the maximum value) of the three selected objective functions are shown in Fig. 4. Table 2 and Fig. 4 illustrate the conflicting nature of these criteria and the difficulty in prioritizing, as the project with the highest urgency in terms of condition
rating (Project #1) is neither the same in terms of maintenance cost (Project #9) nor in terms of user
cost (Project #4). If single objective-based optimizations are undertaken, the bridge deck projects will
be prioritized for maintenance following these three different schemes, depending on the selected objective:
• Damage condition rating -based prioritization: the projects will be ranked in terms of decreasing condition rating, i.e. the project with the highest condition rating will given first priority, and end up with the project which exhausts the available budget;
• Maintenance cost-based prioritization: the projects will be ranked in terms of increasing cost, i.e. the project with the lowest maintenance cost will be given first priority, ending with the project at which the available budget is exhausted;
• User cost-based prioritization: the projects will be ranked in terms of decreasing user costs, i.e. the project with the highest user cost will be given first priority, ending with the project at which the available budget is exhausted.
The required total fund to address all maintenance needs for the 10 deck projects is $2.891 million, which is well in excess of the available budget of $1.5 million. From Table 2, the “ideal” (but
non-existing) maintenance solution is associated with the following “ideal” objective vector f*=[f1max f2min
f3max]T= [7, 75000, 153000]T. 0 0.2 0.4 0.6 0.8 1 Norm al iz ed V al ues of Obj e c ti v e Func ti ons 1 2 3 4 5 6 7 8 9 10 Project # Condition rating Maint. Cost User Cost
Fig. 4. Normalized values of objective functions for deck maintenance projects
Table 2. Multi-objective-based maintenance optimization of bridge decks Bridge Deck Project # Damage Condition Rating Maintenance Costs ($1,000) User Costs ($1,000) Euclidean Metric MOI2 Chebyshev Metric MOI∞ 1 7 620 120 1.260 1.000 2 6 832 132 1.130 1.000 3 5 350 124 0.424 0.363 4 5 364 153 0.382 0.382 5 5 125 76 0.583 0.579 6 5 150 76 0.587 0.579 7 5 100 56 0.730 0.729 8 5 125 20 1.002 1.000 9 5 75 20 1.000 1.000 10 5 150 84 0.528 0.519
Average= 5.3 ∑=$2891,000 ∑=$861,000 MIN=0.382 MIN=0.363
Using Eq. (9), the values of the multi-objective optimality indices MOI2 and MOI∞, corresponding
to the Euclidean and Chebyshev metrics, respectively, are determined for the bridge deck projects and
are summarized in Table 2. Using the min. MOI2 criterion, the “satisficing” solution is found to be
Project # 4, however using the min. MOI∞ criterion, the “satisficing” solution is found to be Project #
3. Fig. 5, however, illustrates the similarity between the rankings of projects for maintenance obtained
using both the min. MOI2 and min. MOI∞ criteria for the other deck projects.
0 0.2 0.4 0.6 0.8 1 1.2 1.4 MO Ip 1 2 3 4 5 6 7 8 9 10 Project # Euclidean MOI Chebyshev MOI
Fig. 5. Multiobjective-based maintenance prioritization of bridge decks
Considering now the budgetary constraint, the scheduling of projects maintenance will be as follows: (i) Euclidean metric-based prioritization: Projects #4, #3, #10,#5, #6, #8, and #9, for a total cost
of $1.439 million. The other projects may delayed until the next year; however, a detailed analysis may be required.
(ii) Chebyshev metric-based prioritization: Projects #3, #4, #10, #5, #6, #7, #8, and #9 for a total cost of $1.439 million.
From the above example, both the Euclidean and Chebyshev (or minimax) criteria for multi-objective optimization yield the same prioritization of bridge deck projects for maintenance. It should be pointed out that for both metrics, project #6 has always a higher priority than project #8, because the latter is not a “true” Pareto optimum, as it is dominated by solution (or project) #6. It is also possible to use the proposed approach by introducing different weighting factors on the different objectives, as discussed in the previous sections.
Conclusions
This paper illustrated that the bridge deck maintenance optimization problem can be formulated as a multi-objective optimization problem. The major merits of the approach are: (i) consideration of all possible (even conflicting) objective functions; (ii) ability to put more emphasis on the more relevant objectives (e.g. condition improvement); and (iii) rational decision-making regarding the selection of bridge projects for maintenance. The prioritization of the bridge decks is based on the satisfaction of several conflicting objectives simultaneously, including improving the physical condition, reducing the maintenance costs and user costs. The proposed multi-objective optimization approach provides a decision support tool for effective bridge management that enables decision-makers to select all relevant objectives in planning the maintenance of their bridge network. The development and integration of the proposed models for maintenance optimization will lead to an effective approach to bridge maintenance management, which optimizes the allocation of maintenance funds, as well as improves the risk management of bridge decks. The solutions obtained achieved a satisfactory trade-off between several competing criteria, including the maximization of the bridge deck condition, minimization of maintenance costs, and minimization of user costs. The proposed multi-objective optimality index can be used as an effective optimality criterion for the prioritization of deteriorated bridge decks for maintenance.
References
Bogdanoff, J.L.(1978). “A new cumulative damage model – Part 1.” J. Applied Mechanics, ASME, 45(2), 246-250.
Duckstein, L. (1984). “Multi-objective optimization in structural design: The model choice problem.” In New directions in optimum structural design, Atrek et al., eds., Wiley, 459-481.
Dunker, K.F., and Rabbat, B.G. 1990. “Highway bridge type and performance patterns.” J.
Performance of Constructed Facilities, ASCE, 4(3),161-173.
Golabi, K., and Shepard, R. (1997). “Pontis: A system for maintenance optimization and improvement of US bridge networks.” Interface, 27, 71-88
Federal Highway Administration (FHWA). (1995). Recording and coding guide for the structure
inventory and appraisal of the nations’ bridges. Report FHWA-PD-96-001, Washington, D.C. Frangopol, D.M., Lin, K.Y., and Estes, A.C. (1997). “Reliability of reinforced concrete girders under
corrosion attack.” J. Struct. Engrg., ASCE,123(3), 286-297.
Keeney, R.L., and Raiffa, H. (1976). Decisions with multiple objectives: Preferences and value
tradeoffs. J. Wiley & Sons, New York.
Koski, J. (1984). Multi-objective optimization in structural design. In New directions in optimum
structural design, Atrek et al., eds., Wiley, New York, 484-503.
Lounis, Z., and Cohn, M.Z. (1993). “Multi-objective optimization of prestressed concrete structures.”
J. Struct. Engrg., ASCE, 119(3), 794-808.
Lounis, Z., and Cohn, M.Z. (1995). An engineering approach to multi-criteria optimization of highway bridges. J. Computer-Aided Civ. & Infrast. Engrg., 10(4), 233-238.
Lounis, Z. (2000).“Reliability-based service life prediction of aging concrete bridge decks.” In Life
prediction and aging management, Naus, D (ed.), RILEM publications, 965-972.
Lounis, Z., and Vanier, D.J. (2000). “A multi-objective and stochastic system for building maintenance management.” J. Computer-Aided Civ. & Infrast. Engrg.,15, 320-329.
Lounis, Z., and Madanat, S.M. (2002). “Integrating statistical and mechanistic deterioration models
for effective bridge management.” 7th ASCE Conf. on Appl. of Adv. Tech. in Trans., 513-520.
Melchers, R.E. (1987). Structural reliability: analysis and prediction. Ellis Horwood, England. Ministry of Transportation, Ontario (MTO). (1989).Ontario Structure Inspection Manual.Queen’s
Printer for Ontario.
Morcous, G., Lounis, Z., and Mirza, M.S. (2003). “Identification of environmental categories for Markovian deterioration models of bridge decks.” J. Bridge Engrg., ASCE, 8(6) 353-361.
Mori, Y., and Ellingwood, B. (1993). “Reliability-based service life assessment of aging concrete structures.” J. Struct. Engrg., ASCE, 119(5), 1600-1621.
Paté-Cornell, M.E.(1994). “Quantitative safety goals for risk management of industrial facilities.” J.
Structural Safety, 13, 145-157.
Starr, C. 1969. Social benefit vs. technical risk. Science, 165, 1232-1238.
Stewart, M. and Rosowsky, D.V. (1998). “Structural safety and serviceability of concrete bridges subject to corrosion.” J. Infrast. Systems, ASCE, 4(4), 146-155.
Von Neumann, J. and Morgenstern, O. (1947). Theory of games and economic behavior. Princeton University Press, Princeton.
Weyers, R.E.(1998). “Service life model for concrete structures in chloride laden environments. J.
ACI Materials, 95(4), 445-453.
Zadeh, L.A. 1963. Optimality and non-scalar valued performance criteria. IEEE Transaction Aut.
Cont, 8(1), 59-60.