HAL Id: hal-02057637
https://hal-amu.archives-ouvertes.fr/hal-02057637
Submitted on 5 Mar 2019
HAL is a multi-disciplinary open access archive for the deposit and dissemination of sci-entific research documents, whether they are pub-lished or not. The documents may come from teaching and research institutions in France or abroad, or from public or private research centers.
L’archive ouverte pluridisciplinaire HAL, est destinée au dépôt et à la diffusion de documents scientifiques de niveau recherche, publiés ou non, émanant des établissements d’enseignement et de recherche français ou étrangers, des laboratoires publics ou privés.
Vulnerability factors shaping municipal resilience
throughout the global financial crisis: comparing Italy
and France
Céline Du Boys, Emanuele Padovani, Alice Monti
To cite this version:
Céline Du Boys, Emanuele Padovani, Alice Monti. Vulnerability factors shaping municipal resilience throughout the global financial crisis: comparing Italy and France. EGPA Annual conference, Sep 2017, Milan, Italy. �hal-02057637�
VULNERABILITY FACTORS SHAPING MUNICIPAL RESILIENCE
THROUGHOUT THE GLOBAL FINANCIAL CRISIS:
COMPARING ITALY AND FRANCE
Previous titleNATIONAL CONTEXT AND INDIVIDUAL STRATEGIES
IN LOCAL REACTIONS TO FINANCIAL CRISIS: COMPARING ITALY AND FRANCE
Emanuele PADOVANI Associate Professor
Department of Management, University of Bologna, Italy [email protected]
Céline DU BOYS Associate Professor
Aix Marseille University, CERGAM EA 4225, 13540, Puyricard, France Institut de Management Public et Gouvernance Territoriale,
[email protected] Alice MONTI Research Fellow University of Bologna, Italy
[email protected] 2017 EGPA Annual Conference
30 August – 1st September – Milano, Italy
Abstract
The global financial crisis has challenged local governments (LGs) as they are specific targets for restoring public finances in many countries. The shock has been more or less intense depending on the national context and policies, and on individual situations and strategies. Our research aims at better understanding how perceived national, local and internal factors of vulnerability have influenced the reaction of LGs to the global financial crisis. We found that (a) municipalities react to national economic trends depending on the municipality austerity policies imposed by the central state, (b) local factors seem not always significant, as they might influence long-term instead of short-term financial policies, and (c) there are similar reactions across countries on revenues and expenditures to grants variation, short-term financial distress and budget rigidity.
Summary
1. Introduction: context and research aims ... 3
2. Main concepts and theoretical model ... 4
2.1 Financial policies of LGs ... 4
2.2 Internal and external factors of vulnerability that affect financial policies ... 5
2.3 Theoretical model ... 6
3. A comparative analysis between French and Italian municipalities ... 7
3.1 National factors in France and Italy ... 8
3.1.1 Vertical dispersion of authority ... 8
3.1.2 State-level austerity policies in reaction to crisis ... 11
3.2 How to compare financial performance and condition of municipalities across boundaries 13 3.3 Selection of variables ... 14
3.4 Sample selection and description ... 17
3.5 Data analysis method ... 18
3.6 Evolution of financial policies throughout the crisis ... 18
4. Result presentation and discussion ... 20
4.1 Evolution of dependent variables ... 20
4.2 Influence of vulnerability factors on financial policy decisions ... 23
4.3 Patterns of resilience and their evolution throughout the global financial crisis ... 32
5. Conclusions ... 34
1. Introduction: context and research aims
The global financial crisis that started in 2007-2008 as a financial and banking crisis, and turned in 2010 to a governmental fiscal and debt crisis has damaged the situation of all Western governments (Kickert 2012). The different and successive types of recovery plans, austerity measures, cutback strategies, and institutional reforms implemented by States following the crisis and their influencing factors have been widely studied (Cepiku and Bonomi Savignon 2012; Kickert 2012; Klase 2011; Lodge and Hood 2012; Raudla et al. 2013; Schick 2011, 2012).
However, the global financial crisis also challenged local governments (LGs) as they are specific targets for restoring public finances in many countries (Cepiku et al. 2016). The shock has been more or less intense depending on the national context and policies, and on individual situations and strategies. As a consequence, a later but growing stream of research has studied the reactions of local actors to crisis, from the description and typology of reactions and cutback strategies, to more normative approaches, or to the analysis of factors influencing reactions to crisis (Barbera et al. 2016; Cepiku et al. 2016; Sommerfeld and Posner 2013). Evidence is brought that responses to successive crisis and shocks are to be found at the strategic rather than operational level (Boin and Lodge 2016; Cepiku et al. 2016) and the understanding and identification of the key factors or capacities that influence those strategic decisions is of major interest for research (see for example Barbera et al. 2016; Cepiku et al. 2016; Innes and Tetlow 2015; Jimenez 2013, 2014). To go further, Steccolini et al. (2017a) note a need for research that would capture the dynamic of crisis reactions and the interrelated nature of capacities in coping with the crisis. As such, researches on the resilience pattern of municipalities is a recent attempt to go further in that direction and to answer the need for understanding strategies or capacities that could make organizations more resilient (Boin and Lodge 2016). This pushes to better study the capacities and their interaction in building strategic answers to the crisis (Saliterer et al. 2017).
In that stream, our research aims at better understanding how perceived factors of vulnerability have influenced the reaction of LGs to the global financial crisis. What is the influence of internal and external factors – local and national factors –, on the financial policy decisions of LGs and how this relation is impacted by the global financial crisis?
We are set at the cornerstone of various streams of literature. First, literature on cutback budgeting and management (based on the seminal work of (Levine 1978) and reviewed by (Raudla et al. 2013)) and literature on management of austerity in LGs (Cepiku et al. 2016) that give a lighting on the effect of the crisis on revenues and expenses decisions. Second, literature on LGs financial resilience (Barbera et al. 2017; Steccolini et al. 2017a). The concept of financial resilience offers an analytic framework to study interactions between the perception of vulnerability factors by managers and their decisions in terms of revenues and expenditures, in crisis and austerity period. It permits to understand the dynamic relation between external and internal factors that shape the perception of vulnerability by managers, and their resulting decisions in terms of financial policies. These decisions in turn influence the building or use of capacities and though the internal factors and the perceived vulnerability. Third, literature on cross national comparative studies in public administration (Kuhlmann and Wollmann 2014). As such, the paper intends to answer the call for comparative studies on how different nations have reacted to global crisis (Pollitt 2010; Raudla et al. 2013) covering the specific level of municipalities.
Our research objectives are threefold. First, we want to investigate how national, local and internal factors influence expenditures and revenues decisions, and to what extent the local and internal factors have comparable influence on LGs from different countries. Second, we
want to bring to the better understanding of LGs reactions to the crisis and of their revenues and expenditures decisions, within the framework of financial resilience. Last, we want to study if these patterns have changed throughout the 2008-2015 period, assessing if LGs have changed their decision-making process in the different crisis periods.
The cross-country comparative analysis provides the opportunity to isolate the effects of the national context. Previous paper from the authors (du Boys & Padovani, 2016) shed light on the effect of the institutional context on LGs situation and on the timing of the crisis between France and Italy. It suggested that the effect of the crisis has come later in France than in Italy, and affected differently LGs. One may wonder if this is the consequence of the late decrease in French state grants, coupled with the tax guarantee on tax payment or the absence of any bankruptcy regulation, whereas in Italy, measures such as reinforcement of the internal stability pact or grants cutting have been taken very early. Here, our interest also goes beyond studying national influence and we wish to understand the influence of local and internal factors. To do so, we propose a quantitative analysis on a panel data set of 2.200 municipalities over 10.000 inhabitants in France and in Italy over an 8 years period (2008-2015).
Results show that municipalities react to national economic trends depending on the municipality austerity policies imposed by the central state. Grants represent an important mechanism, but municipalities react similarly in different countries only when there is a clear message by the central state that structural and heavy austerity policies are put in place. Local factors seem not always significant, as they might influence long-term instead of short-term financial policies that are the focus of this study. All internal factors have different impacts in terms of financial policy decision, but there are some recurring relationships: a reduction in grants is reflected on a reduction of personnel expenditures, a short-term financial distress is associated to a reduction in current other than personnel expenditures, a high budget rigidity is contrasted by increasing own resources and decreasing of personnel expenditures.
This paper is structured as follow. Section 2 discusses the conceptual framework used in this study and exposes our research model that we use in this study. In section 3, we expose the methodology and the operationalization of the quantitative study, with a particular interest in discussing the different characteristics of the French and Italian national contexts. Section 4 presents and provides a discussion of results, while conclusions are included in Section 5.
2. Main concepts and theoretical model
We first discuss expenditures and revenues choices as an interesting angle for studying financial policy decisions to cope with the crisis. The financial policy adopted by each LG represents our dependent variable. We then discuss the financial resilience as a constructive framework for the analysis of external and internal influences, what we then consider under the label “vulnerability factors”, our independent variables.
2.1 Financial policies of LGs
Financial shocks have strong and complex impacts on financial balances. On the one hand, the level of severity and length of crisis affect with different magnitude both revenues through tax base reduction, and expenditures via an increase of demand for services (Dunsire and Hood 1989; Pollitt 2012; Raudla et al. 2013). On the other hand, expenditures and revenues result from crisis management and budget decisions.
In any period, budget annual cycle remains pivotal in the decision of revenues and expenditures (Gianakis et al. 1999), as well as rebudgeting (Anessi-Pessina et al. 2012).
Budget management is a key aspect of municipalities reactions to the crisis (Cepiku et al. 2016). Previous literature, such as the one on cutback management (Cepiku and Bonomi Savignon 2012; Klase 2011; Levine 1978; Raudla et al. 2013) provides many elements showing that budget decisions are central in crisis management. Raudla et al. (2015) also underline the increased power of budget units during crisis. In that line, Cepiku et al. (2016) argue that LGs responses to the global financial crisis can be studied based on the way governments manage their budget categories.
Previous research shows that in terms of revenues and expenditures, LGs may react in several ways (Baker 2011; Cromwell and Ihlanfeldt 2015). Notably some of their financial resources are provided and decided by the central state (and other upper tier governments such as regions). During times of financial crisis, these may be reduced. The central government may not only withdraw grants, but also limit the ability of LGs to impose, raise or modify local taxes. LGs retain, however, the ability to set the price for fee-paying services. LGs may increase revenue in reaction to decreases in state grants, especially in the early phases of crisis, when the ‘tooth fairy syndrome’, that is, the idea that cutbacks are not needed, may influence decision makers (Levine 1979), or where the cutbacks provided are less than the reduction of state grants.
There is a significant body of literature focusing on the pattern of expenditure cutbacks, showing, for example, the importance of capital spending reduction and personnel expenditure reduction via a hiring freeze (Raudla et al. 2013). Capital spending is the most likely cutback during crises (Levine et al. 1981; Dunsire and Hood 1989), although not necessarily the most effective strategy in the long term (Scorsone and Plerhoples 2010). A freeze on personnel hiring is also frequently adopted, as it decreases expenditure without unpopular layoffs (Levine 1978; f 1985). Finally, the reduction of operating expenditure via cuts to programs or efficiency measures is another often adopted option.
There is also evidence to support that expenditures and revenues decisions come in answer to internal and external contingencies (Anessi-Pessina et al. 2012). Internal factors constitute an important set of forces that influence municipalities’ reaction to crisis and budget decisions (Lee et al. 2009; Pollitt 2012). But there is more at stake. The multiple type of influences on expenditures and revenues decisions is of great interest to research and can be modeled with reference to the financial resilience framework.
2.2 Internal and external factors of vulnerability that affect financial policies
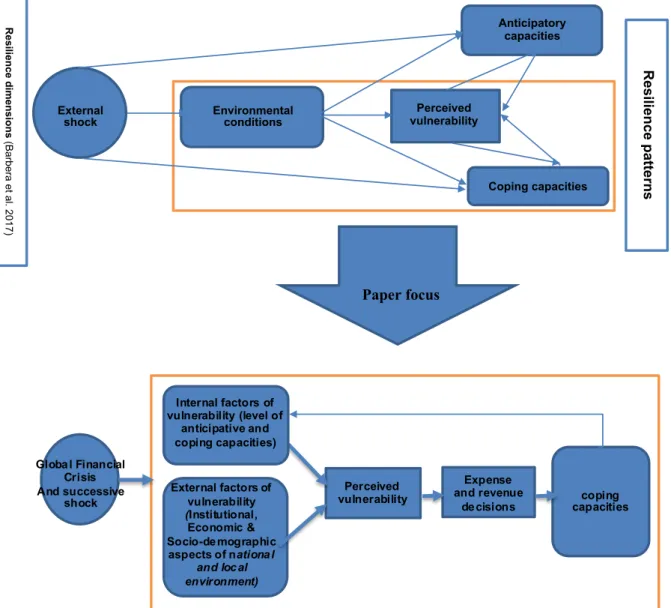
The financial resilience framework developed by Steccolini et al. (2017a) gives an interesting understanding of the effects of external and internal factors on strategies and financial decisions taken by municipalities to cope with crisis. Resilience is an established concept within crisis management studies (Duit 2016). Financial resilience is the capacity of governments to anticipate, absorb and react to shocks affecting their finances over time. It is a “dynamic combination of four interrelated dimensions, namely financial shocks, vulnerability, anticipatory capacity and coping capacity” (Barbera et al. 2017; Steccolini et al. 2017a). First part of Figure 1 portrays the different dimensions and underlines the dynamic characteristic of the model.
The resilience pattern of municipalities can explain expenses and revenues decisions. Steccolini et al. (2017a) and du Boys (2017) show that cities with greater anticipative or coping capacities can limit the amplitude of cutbacks or tax increases. Long-term anticipation and accurate perception of the municipalities’ external and internal vulnerabilities allow to limit cost cuts and fiscal and debt rise.
Financial decisions are an important element in the resilience framework, via their effect on the use or development of coping capacities, and in particular buffering ones. Coping capacities are made of three types: buffering, adaptive and transformative. Buffering capacities (i.e. the ability to absorb shocks) represent more traditional budget management techniques, and refer to elements such as increase in tax revenues, short term reduction in investment, or deferring expenditures. Adaptive capacities refer to the ability for implementing incremental changes, while transformative capacities to the ability for taking paths of more radical changes (Steccolini et al. 2017a). As a result, buffering capacities, and to a lesser extent adaptive and transformative ones, are linked to financial policies decisions. Focusing on expenses and revenues decisions enable to comprehend the deployment or development of coping capacities in reaction to the financial crisis.
Vulnerability is interpreted “as the level of exposure to a shock” (Barbera et al. 2017; Steccolini et al. 2017a). Its perception by decision-makers influences the LG’s reaction to crisis and the decisions to deploy or develop coping capacities. Vulnerability results from internal and external factors. LG’s vulnerability and its perception first result from the external environmental conditions, such as uncertainty of the environment, evolution of national grants, default or bankruptcy regulations, local economic poverty, territorial attractiveness (Barbera et al. 2017; Céline du Boys 2017). National contextual factors should also affect LGs’ vulnerability, due to different administrative culture or traditions (Loughlin 1994), different structures of the State in terms of vertical dispersion of authority (Pollitt and Bouckaert 2011), and different state-level austerity policies in reaction to crisis (Miller and Hokenstad 2014).
Perceived vulnerability then results from internal factors. It is at the center of the dynamic relations stated by the financial resilience model, in which the ex-ante level and types of capacities influence the perception of vulnerabilities, that in-turn influence the development or deployment of capacities. Internal factors are such as financial reserves, state and level of assets, diversification and importance of revenues and taxes, level of debt, doubtful liabilities, rigidity of expenditures, past financial situation such as successive deficit, subsidiaries’ situation and internal capacity to control them, misfit between funding and service responsibilities (Barbera et al. 2017; Céline du Boys 2017). Leadership and managerial capacities may enable the development of long-term strategies in answer to crisis (Céline du Boys 2017), including infrastructure development and employment retraining (Pollitt 2012). Their presence minimizes the negative effects of cutbacks (Behn 1980; Levine 1978). As such, they appear as another internal factor that shape perceived vulnerability.
Following these reflections, financial resilience seems to offers a pertinent framework to analyze the type of relations and interactions between internal and external factors and financial policies decisions.
2.3 Theoretical model
Consequently to the discussion above, we chose to refer to the financial resilience framework to study how internal and external vulnerability factors impact on financial policies over time, in times of crisis and austerity. Barbera et al.'s (2017) reflection intends to describe and characterize capacities, elements of perceived vulnerability and contextual elements in order to identify various resilience patterns. In parallel with this reflection, we propose to study the relations between different dimensions of the model: internal and external factors that shape vulnerability, and revenues and expenditures decisions that drive to the deployment or development of coping capacities in reaction to the financial crisis. In our approach, we leave aside the anticipatory capacities dimension. The positioning of our reflection with regard to the financial resilience model is schematized in Figure 1.
Figure 1– Theoretical model
In this framework, we now propose to test the relation between internal and external factors and financial policy decisions. We are interested in understanding how LGs are affected by external, both national and local, and internal factors when they decide their level of revenues and expenditures. We wonder to what extent the local and internal factors have comparable influence on LGs in different countries.
The global financial crisis is an interesting period to study these influences. There is evidence as stated by Klase (2011) that there is a “response to fiscal stress which varies depending on severity of fiscal retrenchment”. (Scorsone and Plerhoples 2010) suggest that strategies have evolved throughout time, with different combination of tax increases, spending cuts and rainy-day funds. Thus, we wonder if the influence of external and internal factors has evolved throughout the crisis.
3. A comparative analysis between French and Italian municipalities
The interaction of the national context and the individual situation in the shaping of LGs’ individual strategies makes it hard to differentiate the influence of each level on the LGs’
Coping capacities Anticipatory
capacities
External
shock Environmental conditions
Perceived vulnerability R es ilie n ce p atte rn s Paper focus coping capacities Global Financial Crisis And successive shock Perceived vulnerability Municipal External factors of vulnerability (Institutional, Economic & Socio-demographic aspects of national and local environment) Internal factors of vulnerability (level of anticipative and coping capacities) Expense and revenue decisions Resilience dimensions (Ba rb era e t a l. 2 01 7)
resulting financial situation. However, a cross-country comparative analysis provides the opportunity to isolate the effects of the national context. Thus, in order to study the influence of both national and individual factors, this paper proposes a quantitative comparative study between French and Italian LGs. We selected the municipal level of LGs.
In France, there are three levels of LGs (region, department and municipality). They have a very similar legal system, and are placed on an equal footing regarding the State. They are freely administrated by elected councils, and do not exert control on each other. In 2015, there were 36.658 municipalities (communes), but only 958 over 10.000 inhabitants, describing a highly fragmented pattern. Municipalities have extensive autonomous powers to implement national policy and are responsible to manage such services as waste collection and disposal, water and sewerage systems, roads, social services, building permits and planning.
Italy has a fragmented LGs pattern, with three main governmental levels, the State level, the regional level, and the municipal level. The previous fourth level (between regions and municipalities) has been transformed in a second tier LG, a sort of consortium amongst municipalities. In common they all have a territorial basis of action. There are about 8.100 municipalities (comuni) that are responsible for such local services as local transportation, waste collection and disposal, social services, road and school infrastructure and maintenance, amongst which 1.200 are above 10.000 inhabitants.
Before describing the precise sample and methodology of our empirical study, we first discuss the national factors that may influence financial policy decisions, illustrating the differences between French and Italian municipalities.
3.1 National factors in France and Italy
Above national economic conjuncture, national institutional contextual factors affect municipalities’ reaction to crisis. As already discussed, they can be seen at three different levels: the administrative culture or traditions, the basic structure of the State in terms of vertical dispersion of authority, and the state-level austerity policies in reaction to crisis. France and Italy can be considered similar in terms of culture or administrative traditions (Ongaro 2010), therefore we limit our analysis to the latter two variables.
3.1.1 Vertical dispersion of authority
Vertical dispersion of authority relates to the different state models in place. While usually the distinction is between unitary and federal states, some unitary states are so highly decentralized that the degree of de facto decentralization is even higher than in federal state. It is thus important to distinguish between different levels of centralization/decentralization. The concept of decentralization is multifaceted and complex in nature. Schneider (2003) defines three types of decentralization: fiscal, administrative and political. The measurement of centralization/decentralization is controversial, but amongst the most popular measures that have been used there are share of revenues or expenditures at local level compared to the public sector, percentage of local revenues controlled by LGs, and percentage share of public employment.
One element that may be considered as symptom of high level of autonomy and thus high decentralization is the presence of bankruptcy rules opposed to state takeovers (Scorsone and Padovani 2014). Bankruptcy refers to that situation where a LG’s state of insolvency is declared or imposed by a court order, and creditors are paid by clearance of assets and credits. Many countries do not have a provision for LG’s bankruptcy filing but rather a higher level, usually the central government, takes charge of the situation.
Another aspect that is important to assess the level of freedom of a LG, and thus its subjection to national policies, is its ability to decide their budget policies amongst which debt burden is pivotal. Most countries (but not all) provide restrictions to LGs borrowing. Policies affecting the debt load (by limiting borrowing so as to reduce debt load or by taking direct control of the financial load), policies affecting current primary savings (by restricting borrowing to finance capital expenditure or by increasing municipal revenues), or policies affecting the co-funding efforts (by reducing co-co-funding of investments or reducing capital expenditures) are possible strategies put in place by State governments (Cabases et al. 2007).
Fiscal and financial centralization/decentralization
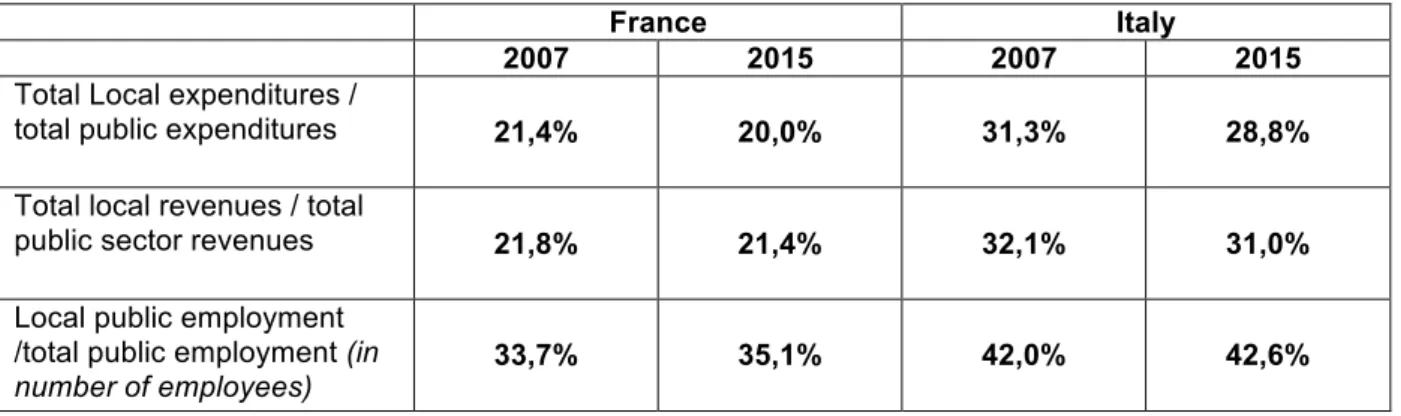
Classic measures of centralization/decentralization tend to show that Italy is more decentralized than France (see Table 1)1.
Table 1 – Comparing French and Italian level of decentralization and their evolution
with the crisis
France Italy
2007 2015 2007 2015
Total Local expenditures /
total public expenditures 21,4% 20,0% 31,3% 28,8%
Total local revenues / total
public sector revenues 21,8% 21,4% 32,1% 31,0%
Local public employment /total public employment (in
number of employees) 33,7% 35,1% 42,0% 42,6%
Sources: INSEE (France) and ISTAT (Italy).
The French Republic is a unitary State which organization is decentralized. In the early 2000’s, decentralization and LGs’ financial autonomy were registered in the Constitution. LGs are freely administered by elected councils. Municipal taxes are collected directly and indirectly from citizens and companies. Municipalities’ councils vote the rate of main direct taxes, and the State ensures tax collection and bears the risk of non-payment. The State pre-pays and guarantees the amount of taxes voted locally. Municipalities also decide service fees.
The Italian Constitution recognizes federalism and localism. As to municipalities, the constitution provides a certain level of autonomy in terms of ability to raise taxes and service fees, for which they are responsible in terms of collection, decide on the organization and performance of their functions and offices, and allocate resources to different functions and services provided. In 2009 a reform of fiscal federalism has begun. The reform has not been completed yet, and today the system appears contradictory since the central government is conferred a high power over local finances, particularly during economic crisis.
Bankruptcy rules
In France, bankruptcy procedure does not apply to LGs and their assets are exempted from seizure. Specific procedures are designed to protect creditors. Thanks to these mechanisms, the risk of insolvency does not seem to exist in LGs. Even in the worst examples of French
1 See previous research by the authors (du Boys et al. 2014) that have identified, through a qualitative study,
LGs difficulties, there has been no debt write-off. The debt has just been extended to enable the payment.
In Italy the law provides three typologies of situations of financial distress for municipalities, from the most serious default or bankruptcy (dissesto) to the intermediate pre-default (pre-dissesto), which is a sort of condition in which the LG is subjected to a series of central government continuous checks, and the least acute imbalance that occurs in the rebalancing procedure (procedura di riequilibrio). A municipality is considered in bankruptcy condition when (a) it is not able to continue its functions and essential services, or (b) it cannot pay creditors with regular resources (i.e. insolvency). Municipalities subjected to bankruptcy procedures face a financial shock and assets can be sold to pay creditors.
Municipal budget and structure
In France as in Italy, the municipal budget is divided into operating and capital revenues and expenditures. Operating section can generate a surplus, which will permit to finance the investment activities. Budget must be balanced. Any overall imbalance must be covered in the following budget cycle.
In France, the Prefect and the Court of Auditors, representing the central State, monitor and can impose measures to return to balance. In Italy, the Court of Auditors monitors or suggests measures to balance to municipalities, and starting from November 2011, it can even declare the bankruptcy status (see hereinafter) in case of sever unbalances.
Debt regulation
In both countries, debt is low, but much lower in Italy, if compared to State debt. Municipal borrowing was 2,2% of the Italian public debt compared to 3,2% in France in 2013. But while in France, it has been increasing since 2003, in Italy it has constantly decreased of 20% between 2011 and 2016.
In Italy, debt is subjected to specific restrictions by Constitution, national and regional laws with the aim to guarantee financial sustainability. The law imposes quantitative limits to borrowing related to annual revenues. LGs can take out new debt in case the new annual amount of expenses for interests (of any form of past and new debt and guarantee) does not exceed a specific amount of current revenues of the second to last previous fiscal year. The length of any debt operation (even for renegotiations) is between a minimum of 5 to a maximum of 30 years. Another important element of public finances regulation is the Internal stability pact (ISP). It reflects on LGs’ financial policies and is intended to decrease local debt, De facto, the ISP is imposed by central government as fiscal consolidation within the European framework of the Stability and growth pact (SGP). Established in 1999, this measure was introduced in answer to the decentralisation process begun in the early 90s and mirrors the SGP by requiring municipalities (and other LGs) to adopt specific measures with the final aim to improve the difference between primary revenues and expenditures and, thus, decrease the stock of debt. The ISP has changed over time, in terms of ways to implement the financial efforts and their level. This latter characteristic has substantially introduced a certain level of uncertainty amongst LGs in their financial planning, especially considering that the ISP has widely been considered not an agreement between the central government and regions and LGs, but a unilateral deed.
In France, debt regulation is more simple. Borrowing is only allowed for investments, not for operating activities. Debt repayment is mandatory and must be done from own-resources.
Many LGs suffer from a risky debt structure due to an important proportion of toxic loans2. There is no systemic risk (Observatoire des finances locales 2014), but many LGs are affected and some suffer from a high increase in their financial expenses. The loan agreement with a bank is a matter of private law, but includes a commitment to increase taxes if necessary to fulfil the annual repayments (Mouzet 2011).
3.1.2 State-level austerity policies in reaction to crisis
A level of national institutional contextual factors that can affect LGs’ perception of vulnerability is the state-level austerity policies in reaction to crisis (Miller and Hokenstad 2014). They come in different forms. Standardization of procedures, setting limits and ceilings to spending, borrowing and activities, general priority-setting by the government are the main example of state-level austerity policies that inevitably brings to a higher centralization in the relationship between central and local governments (Stanley 1980; Peters 2011; Pollitt 2010). While the rational and the deliberate goals of these procedures are set to face fiscal crisis, contradictions exist (Cepiku and Bonomi Savignon 2012) and these policies may not have the desired impact on revenues, costs and debt and thus the financial health of LGs.
State-level austerity policies
There are at least two characteristics that differentiate the Italian answer to crisis from the French one, namely its anticipation, since its most severe phase can be dated to 2011 instead of 2014-15 of France, and its complexity. The first symptoms of fiscal crisis arose in 2008, when markets and international institutions, amongst which the EU, started to convey warning signals to the Italian government. Italy then started a series of reforms to strengthen public budgeting, accounting and audit. But the worsening situation also required deep financial cutbacks for municipalities that were obtained via several policies and mechanisms, with a particular boost in late 2011 with effects starting in 2012:
- Reductions in state grants, - Increase of the ISP fiscal targets,
- Ceilings for specific current expenditures, known as “spending review” policies, - Hire freezing.
In France, after the 2008 crisis, there has been successive national economic recovery plans (26 billion euros in 2009 and 35 billion euros in 2010) that limited the economic recession, and protected LGs. In 2010, specific measures were even implemented to support local investment. But from 2011, the State froze and then decreased the “DGF”, the main general operating grant to LGs with the aim of forcing LGs to rationalize their expenses. From 2015, the strong decrease in DGF (11 billion decrease planned until 2017) has been felt as a strong and unexpected shock for most LGs. The expected overall effects in terms of cutbacks of the policies above in the two countries can be summarized as in
2 Structured debt combining traditional bank loans and derivatives. Often linked to non-traditional indexes as the
Table 2 - Cutbacks effects on Italian and French municipalities during crisis
2009 2010 2011 2012 2013 2014 2015 2016 2017 France* none none transfers freezing transfers freezing transfers freezing 0,59 1,45 1,45 0,72 Italy** 1,46 1,03 3,01 5,19 3,16 0,04 0,85 n/a n/a
Note: in billion Euros
Source: INSEE (France) and IFEL (Italy). *France: reduction in state grants (DGF).
**Italy: overall effects in terms of cutbacks policies mentioned above. Fiscal federalism reforms
Coupled with these policies, fiscal reforms that challenged decentralization have been implemented in both countries. In Italy, the central government re-introduced the municipal property tax in 2012 after 4 years of re-centralization of public finances, then in 2013 abolished the property tax on first residences and gave the possibility to raise rates of municipal personal income tax. In France, in 2010 (after years of less intense local revenues reforms) the removal of an important business tax called “Taxe professionnelle”3 resulted in a great loss of flexibility in revenues and has been a challenge for LGs.
Regarding France and Italy, we can conclude that Italy appeared to be more decentralized than France, whether it is concerning the autonomy given to LGs, the part of local expenditures, revenues or employees, or the bankruptcy rules. But local debt is much more regulated in Italy than in France. However, in both countries, the crisis has generated a recentralization trend mainly through fiscal reforms. If LGs in both countries suffers from state level austerity policies, Italians undergo much more important, long and complex ones.
Following this review of difference in national characteristics between France and Italy, we do the hypothesis that municipalities in France or in Italy are in quite different national context and it is likely that we should have different patterns of decisions making regarding expenditures and revenues.
3.2 How to compare financial performance and condition of municipalities across boundaries
Comparing the financial performance and condition of LGs has been an aspect widely discussed when the comparison is limited within nations, while less attention has been received when extended across national boundaries (Padovani and Scorsone 2011). This topic calls for several types of issues that have been already examined in literature. First of all, it should be noted that reporting of public finance is at the cornerstone of two competing approaches to accounting: “government financial statistics” otherwise called “national statistics”, i.e. that accounting system whose aim is to represent economy at a whole and articulated in its subsectors, and “government financial reporting”, whose foundational basis is entity accounts. In this study, we refer to the latter. The International Public Sector Accounting Standard Board (IPSASB) provides a set of standards (IPSAS) that have been followed by several countries around the world, but only a limited number of EU countries have applied them and with different nuances (Ernst & Young 2012, PricewaterhouseCoopers
3 Tax paid by businesses, based on the value of their fixed assets. The rate was set by LGs. It represented 44% of
LGs’ tax revenues. It has been replaced by several taxes which are smaller in amount. Moreover, some of them are very volatile and their rate is not set by the LG.
2014). French LGs have a level of proximity of their accounting information to IPSAS of 84 percent while Italian LGs got a lesser level, 30 percent (Ernst & Young 2012). In France, a full accrual accounting is applied both to general accounting and budget. In Italy, starting from 2009, the public sector accounting has been challenged by an all-encompassing reform called “harmonization of accounting systems and reports”. During the period covered by the analysis and still currently, Italian municipalities are provided by a cash/modified cash plus modified accrual bases of accounting sometimes called commitment-based accounting accompanied by an accrual basis-like set of documents.
While some researchers have argued that the comparability of financial reports and accounts may for the moment only be achieved at a rhetorical level (Heald and Hodges 2015), a recent research project has defined a common framework that make the international comparison of city governments’ financial health possible. Originating from currently used accounting information and a process of selection and legitimization of information upon which comparing LGs, the results point out that relevant information to compare city governments’ financial health is to a great extent already available but needs to be interpreted and re-shaped for purposes of making comparisons (Padovani et al. 2017). Based on that experience, we have chosen measures of the model’s variables that can be compared between France and Italy.
3.3 Selection of variables
The quantitative approach adopted in this research offers to test hypotheses on a representative sample, but obliges to simplify the measurement of the various dimensions of the model as developed by the qualitative multiple cases approach. The variables at stake here are twofold: the independent variables that describe external and internal factors that affect the perception of vulnerability, and the dependent variables explaining financial policies adopted by municipalities.
As discussed, environmental (external) conditions plays a pivotal role in shaping the perception of vulnerability. National GDP growth (National economic wealth) and evolution of grants received from central and other governments (State-level and other governments austerity policies via grants) can be considered as important independent variables to measure national economic factors. While national GDP is a quite standardized measure and derives from national statistics, the second variable requires a thorough understanding of the accounting information available from the accounting dataset. In general, while for both countries obligation-based accounting information was available (for Italy cash accounting information is also available), important differences emerged from deep discussions on the structure of information and the technicalities of these allegedly similar accounting systems. With reference to grants, for Italy we have used the data on current grants from other governments based on obligation-based accounting as this information represents the resources municipalities can rely on to fund their expenditure policies. For France, we have used the information on the “Dotation Globale de Fonctionnement - DGF” in obligation-based accounting terms. For Italy, it has also be considered the Impact of ISP on local public finances, by considering the overall levels of fiscal efforts required to municipalities at the macro level.
Another sub-set of environmental (external) factors relates to local economic and social factors. Municipal economic growth, measured by the change in natural persons income for all inhabitants of the municipality and Population growth, as percentage of population growth during the last two years, represent possible variables. These measures are quite standard and conventional variables to measure the socio-economic environment and can be obtained by statistics available at the national statistic office or at the revenue agency.
Concerning the internal factors of vulnerability, we have singled out what we consider the main four measures amongst the many aspects studied in the qualitative analysis of Steccolini et al. (2017a): the level of financial dependency from other governments’ revenue; the level of budget rigidity; the level of fiscal distress, divided into short term and long term fiscal distress levels. To select the appropriate accounting information (also for the measurement of grants), we have adopted the validity and legitimacy criteria developed by Bouckaert (1993). Validity refers to understandability, accuracy and credibility, while legitimacy reflects the idea that the accounting information is considered as valuable by its recipients (i.e., policymakers in municipalities). Municipal financial dependency from other governments is measured considering grants received from other governments using obligation-based accounting in both countries, while the current revenue are measured by using obligation-based accounting in France, where all municipal revenues cash inflows are guaranteed by the State, and cash-based accounting in Italy. In fact, while obligation-based accounting is relevant for grants (see above), it does not account for current revenue from municipal fees and taxes on the basis of fair value (IPSASB 2001, 2006). For this reason, cash accounting is considered as a better proxy. For the same reason, budget rigidity, which considers the portion of current revenue absorbed by personnel expenditure, considers cash accounting for revenue for Italy and obligation-based accounting for France. Obligation-based accounting is used for both countries for expenditure as it represents the amount of resources consumed and that therefore must be funded.
Fiscal distress has been measured by several indicators. While previous studies suggest several dimensions and variables, short term and long term dimensions seem to be a constant (Jacob and Hendrick 2013). In this study fiscal distress, short term is measured by the gross operating balance divided by current revenue. Similarly, from other variables discussed above and with the aim of accounting for the fair value of revenue, for Italy the gross operating balance has been computed by subtracting the obligation-based accounting level of current expenditure to cash-based accounting current revenue, while current revenues are measured by cash-based accounting. For France, all the variable components have been considered according to obligation-based accounting. It must be noted that gross operating balance is similar but not equal to operating balance, since it does not include depreciation (i.e., the economic value of assets usage), which is instead typical information provided by accrual accounting. Computational details for gross operating balance are included in Table 3. Fiscal distress, long term is measured by the stock of debt (long term debt does not consider accounts payable) in relation to current revenue in obligation-based accounting terms for France and cash accounting terms for Italy.
The dependent variables describe some municipal financial policies that may be adopted in reaction to perceived vulnerability and to cope with the global financial crisis and austerity. The use of these policies and their mix result from various strategies, from cutbacks (Baker 2011) to expansionist strategies, and from various resilience patterns, from fatalists to self- regulatory (Steccolini et al. 2017b). They illustrate decisions regarding the evolution of revenue, personnel expenses, other current expenditure and capital expenditure from one year to the other. We have not considered fiscal reserves (otherwise labelled ‘rainy-days’ funds) since these have been heavily affected by central government fiscal consolidation policies mechanism (for example the ISP in Italy) instead of deliberate and autonomous decisions by municipalities. We have not considered the state and level of assets, since this accrual accounting information is highly inaccurate as inventories are not regularly updated (Corte dei Conti 2016) and might be influenced by different accounting principles implemented.
For the same reasons explained above, Variation of municipal own revenue is computed considering municipal own revenue in cash accounting terms for Italy, and in
obligation-based accounting terms for France. Variation of personnel and variation of other current expenditure are computed considering obligation-based accounting. Variation of capital expenditure is computed considering the accounting basis which is the closest to the momentum in which a new asset (e.g., a new road, a new school building or any other public infrastructure) is made available: obligation-based accounting in France, cash-based accounting in Italy.
To simulate the decision made at the beginning and during the year, we use the measure of the independent variables that should be available at that moment. For example, the evolution of grants is known at the beginning of the year, whereas the GDP later. For population growth we choose to take a 2 year variation as we did the hypothesis that it was a longer trend indicator.
The data collection has been possible thanks to a cooperation with Bureau Van Dijk, Brussels. We have worked on the creation of a database grouping together all financial information available on LGs in France (PA France) and Italy (Aida PA).
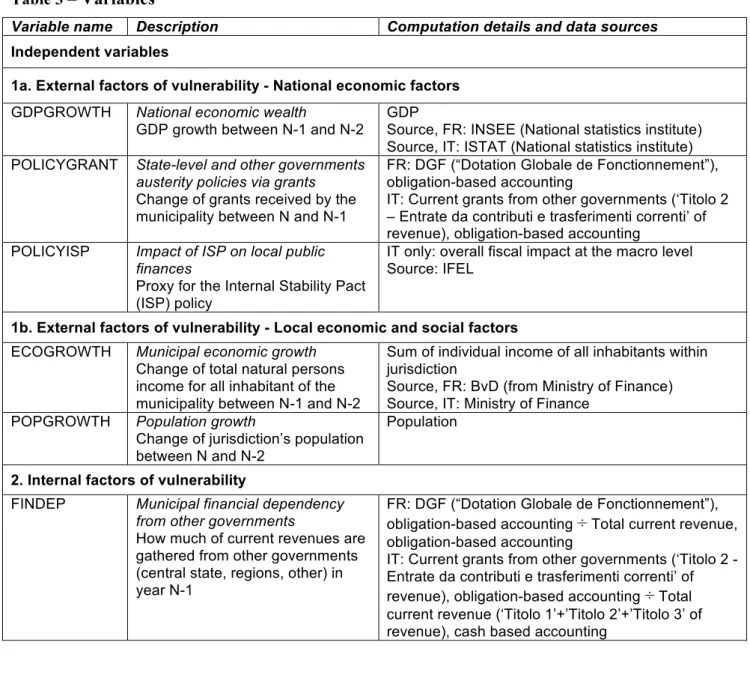
A synopsis of independent and dependent variables used in this study is available in Table 3.
Table 3 – Variables
Variable name Description Computation details and data sources
Independent variables
1a. External factors of vulnerability - National economic factors GDPGROWTH National economic wealth
GDP growth between N-1 and N-2
GDP
Source, FR: INSEE (National statistics institute) Source, IT: ISTAT (National statistics institute) POLICYGRANT State-level and other governments
austerity policies via grants
Change of grants received by the municipality between N and N-1
FR: DGF (“Dotation Globale de Fonctionnement”), obligation-based accounting
IT: Current grants from other governments (‘Titolo 2 – Entrate da contributi e trasferimenti correnti’ of revenue), obligation-based accounting
POLICYISP Impact of ISP on local public finances
Proxy for the Internal Stability Pact (ISP) policy
IT only: overall fiscal impact at the macro level Source: IFEL
1b. External factors of vulnerability - Local economic and social factors ECOGROWTH Municipal economic growth
Change of total natural persons income for all inhabitant of the municipality between N-1 and N-2
Sum of individual income of all inhabitants within jurisdiction
Source, FR: BvD (from Ministry of Finance) Source, IT: Ministry of Finance
POPGROWTH Population growth
Change of jurisdiction’s population between N and N-2
Population
2. Internal factors of vulnerability
FINDEP Municipal financial dependency from other governments
How much of current revenues are gathered from other governments (central state, regions, other) in year N-1
FR: DGF (“Dotation Globale de Fonctionnement”), obligation-based accounting ÷ Total current revenue, obligation-based accounting
IT: Current grants from other governments (‘Titolo 2 - Entrate da contributi e trasferimenti correnti’ of revenue), obligation-based accounting ÷ Total current revenue (‘Titolo 1’+’Titolo 2’+’Titolo 3’ of revenue), cash based accounting
Variable name Description Computation details and data sources
BUDRIG Budget rigidity
part of personnel expenditures in current revenues for year N-1
FR: Personnel expenditure, obligation-based
accounting ÷ Total current revenue, obligation-based accounting
IT: Personnel expenditure (‘Titolo 1 – Intervento 1’ of expenditure), obligation-based accounting ÷ Total current revenue (‘Titolo 1’+’Titolo 2’+’Titolo 3’ of revenue), cash based accounting
FHSHORT Fiscal distress, short term
Gross operating balance out of current revenues in year N-1
FR: [Total current revenues (without asset disposal) – Total current expenditures (excluding depreciation and accounting value of asset that are sold during the year), obligation-based accounting] ÷ Total current revenue, obligation-based accounting
IT: [Total current revenue (‘Titolo 1’+’Titolo 2’+’Titolo 3’ of revenue), cash based accounting – Current expenditure (‘Titolo 1 – Intervento 1’ of expenditure), obligation-based accounting] ÷ Total current revenue (‘Titolo 1’+’Titolo 2’+’Titolo 3’ of revenue), cash based accounting
FHLONG Fiscal distress, long term
Long term debt out of current revenues in year N-1
FR: Stock of debt at year end ÷ Total current revenues, obligation-based accounting IT : Stock of debt at year end ÷ Total current revenues (“Titolo 1”+”Titolo 2”+“Titolo 3” of revenues), cash based accounting
Dependent variables: decisions on revenues and expenditures MOVVAR Variation of municipal own
revenues
Change of municipal own revenues between N and N-1
FR: Total current revenues – DGF (“Dotation Globale de Fonctionnement”), obligation-based accounting
IT: Total municipal current revenue from taxes and fees (‘Titolo 1’+’Titolo 3’ of revenue), cash based accounting
PEVAR Variation of personnel expenditures
Change of personnel expenditures between N and N-1
FR: Personnel expenditure, obligation-based accounting
IT: Personnel expenditure (‘Titolo 1 – Intervento 1’ of expenditure), obligation-based accounting
CUREXPVAR Variation of other current expenditures
Change of municipal other current expenditures (current expenditures excluded personnel) between N and N-1
FR: “Achats et charges externs”, obligation-based accounting
IT: Current expenditure for service and goods provisions (‘Titolo 1, Intervento 2’+ ‘Titolo 1, Intervento 3’ of expenditure), obligation-based accounting
CAPEXPVAR Variation of capital expenditures
Change of capital expenditures between N and N-1
FR: Capital expenditure, obligation-based accounting
IT: Capital expenditure (‘Titolo 2’ of expenditure), cash-based accounting
Source: PA France for France, Aida PA for Italy, by Bureau van Dijk, datasets containing all information contained in financial reports of municipalities (plus annexes), except different information provided in boxes. All data have been retrieved on 01-05-2017.
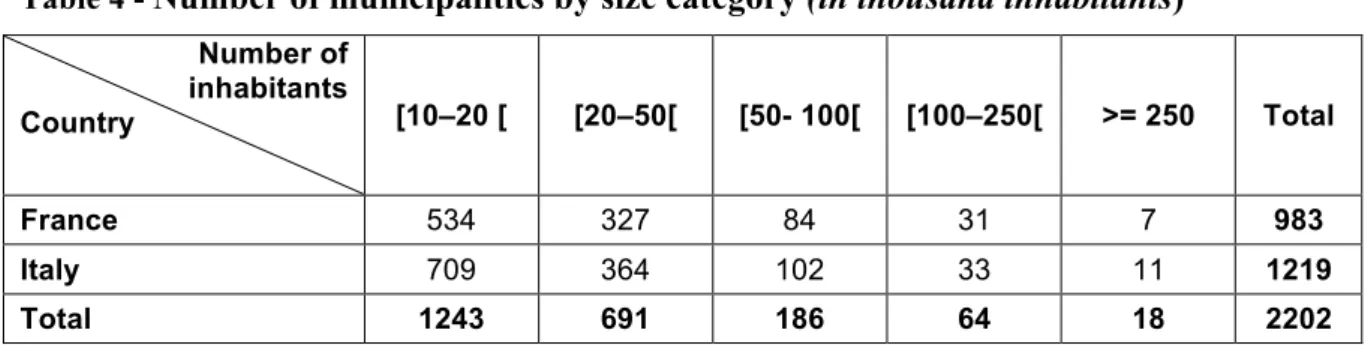
3.4 Sample selection and description
As stated above, our empirical study is based on French and Italian Municipalities. We chose to study municipalities as they represent the first tier of LGs in both countries. We collected data on all municipalities over 10.000 inhabitants (except Paris and Rome) in France and in Italy, throughout the years from 2007 to 2015, this is to say 983 French municipalities and 1219 Italian municipalities. Then we corrected the sample by winsorizing the variables at level 1% in each tail to reduce the effect of possibly spurious outliers. The sample is described in Table 4.
Table 4 - Number of municipalities by size category (in thousand inhabitants) Number of inhabitants Country [10–20 [ [20–50[ [50- 100[ [100–250[ >= 250 Total France 534 327 84 31 7 983 Italy 709 364 102 33 11 1219 Total 1243 691 186 64 18 2202
3.5 Data analysis method
To analyze the panel dataset we use a fixed-effect model, i.e. a linear regression model in which the intercept terms vary over the individual unit. Let i be the variable index for the unit 𝑖 = 1, … , 𝑁 , i.e. municipality, and t the variable index for the time period (𝑡 = 1, … , 𝑇), i.e. the year, the specification of the fixed-effect model is:
𝑦!" = 𝛼!+ 𝑥!"! 𝛽 + 𝜖 !"
where 𝛼! captures the effects of those variables that regard the unit i and are constant over time 𝑥!" is the vector of explanatory variables and 𝜖!" is assumed to be independent and identically distributed over municipalities and time with zero mean and variance 𝜎!!.
Moreover, it is usually assumed that all 𝑥!" are independent of all 𝜖!". The fixed-effect model
requires the exclusion of the variables that are time-invariant (e.g. nation, population mean) for multicollinearity problems, thus we run separate fixed-effect models for each country. In particular, for each dependent variable and for each country we run four fixed-effect models, regarding the four different time periods, with time-fixed effects since the null hypotheses of no time fixed effect is rejected. Fixed effects were chosen over random effects on the basis of the Hausman test (Hausman 1978) for each dependent variable. In addition, we use robust standard error estimates since the related test has confirmed heteroskedasticity. We exclude income variable since it is correlated with budrig variable; their correlations corresponds to -0.8227.
3.6 Evolution of financial policies throughout the crisis
To better comprehend the evolution of patterns across time, we determine the combinations of financial policies decisions, on the basis of our dependent variables, for each municipality. We encode our dependent variables depending on their evolution (negative or positive) as stated in the
Table 5 and we detect the combination of each municipality through the evolution of expenses and revenues. In particular, we assign to each municipality a code based on the combination of the four dependent variables trends, where each character corresponds to a dependent variable trend. For example, “2-2-1-1” means the financial policy characterized by increase in both municipal own revenues and personnel expenditures and decrease in both other current expenditures and capital expenditures. Then, we compute the combinations frequency for each time period and country and we classify the combinations regarding their frequency.
Table 5 – Encoding dependent variable evolution VAR 1 2 MOVVAR <=0 >0 PEVAR <=0 >0 CUREXPVAR <=0 >0 CAPEXPVAR <=0 >0
4. Result presentation and discussion
We present successively the results of our quantitative analysis. We first describe the evolution of the dependent variables means over time. Then we present the results of our panel regressions and so the effect of national, local and internal factors on the variation of municipal own revenues, personnel expenditures, other current expenditures and capital expenditures for each municipality. Last, we show the results on the evolution of main combinations of dependent variables.
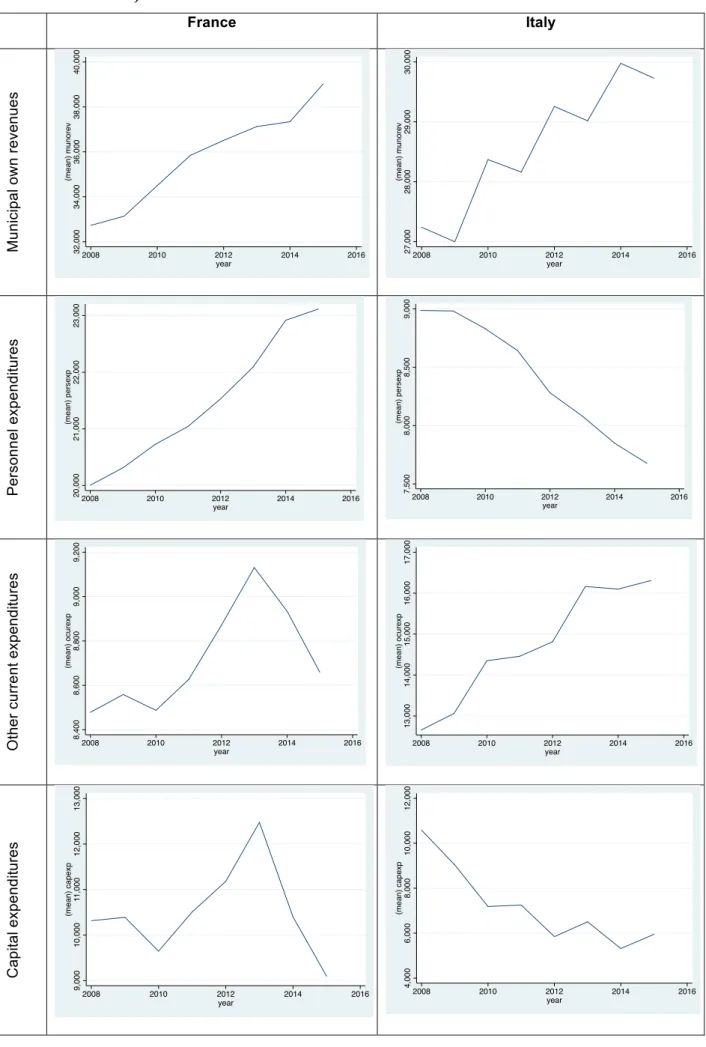
Figure 2 shows the different evolution of French and Italian municipalities on the dependent variables. If own municipal revenues face a quite comparable growing evolution, personnel expenditures vary the opposite ways, with a constant increase in France vs a constant decrease in Italy. Concerning other current expenditures, they have been growing in both countries until 2013, after they decrease strongly in French municipalities. At last, capital expenditures have permanently decreased in Italy, contrary to France, where they have increased until 2013, before dropping. These elements suggest different timing of the crisis in France and Italy, and a later reaction to the crisis in French municipalities, compared to Italy.
Figure 2 - Evolution of average municipal own revenues, personnel expenditures, other current expenditures and capital expenditures by country, from 2007 to 2015 (in thousand euros) France Italy Mu n ic ip a l o w n r e ve n u e s P er sonnel ex pendi tur es Ot h e r cu rr e n t e xp e n d itu re s Ca p ita l e xp e n d itu re s 32,000 34,000 36,000 38,000 40,000 (me a n ) mu n o re v 2008 2010 2012 2014 2016 year 27,000 28,000 29,000 30,000 (me a n ) mu n o re v 2008 2010 2012 2014 2016 year 20,000 21,000 22,000 23,000 (me a n ) p e rse xp 2008 2010 2012 2014 2016 year 7,500 8,000 8,500 9,000 (me a n ) p e rse xp 2008 2010 2012 2014 2016 year 8,400 8,600 8,800 9,000 9,200 (me a n ) o cu re xp 2008 2010 2012 2014 2016 year 13,000 14,000 15,000 16,000 17,000 (me a n ) o cu re xp 2008 2010 2012 2014 2016 year 9,000 10,000 11 ,0 0 0 12,000 13,000 (me a n ) ca p e xp 2008 2010 2012 2014 2016 year 4,000 6,000 8,000 10,000 12,000 (me a n ) ca p e xp 2008 2010 2012 2014 2016 year
4.2 Influence of vulnerability factors on financial policy decisions
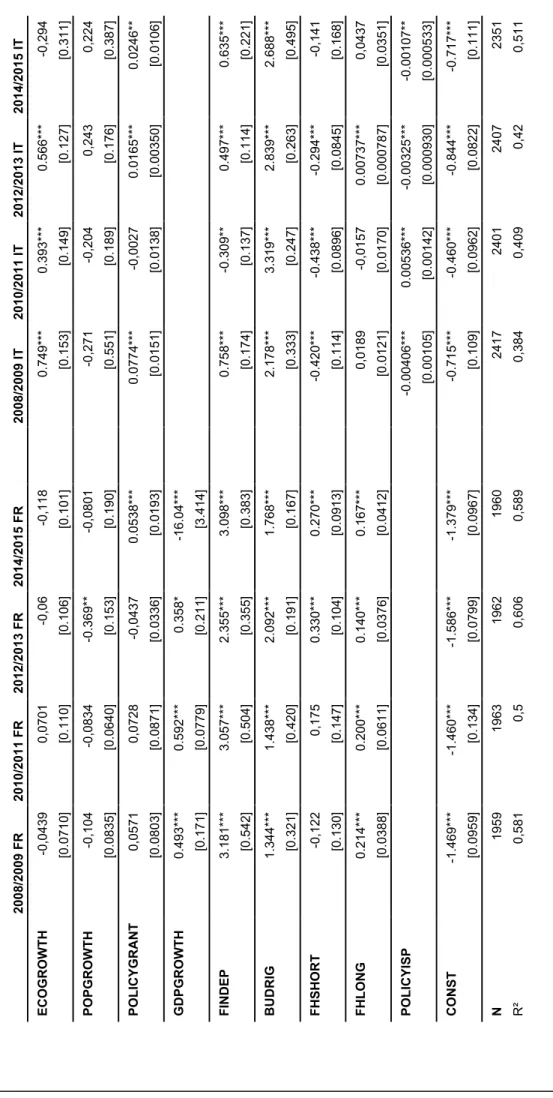
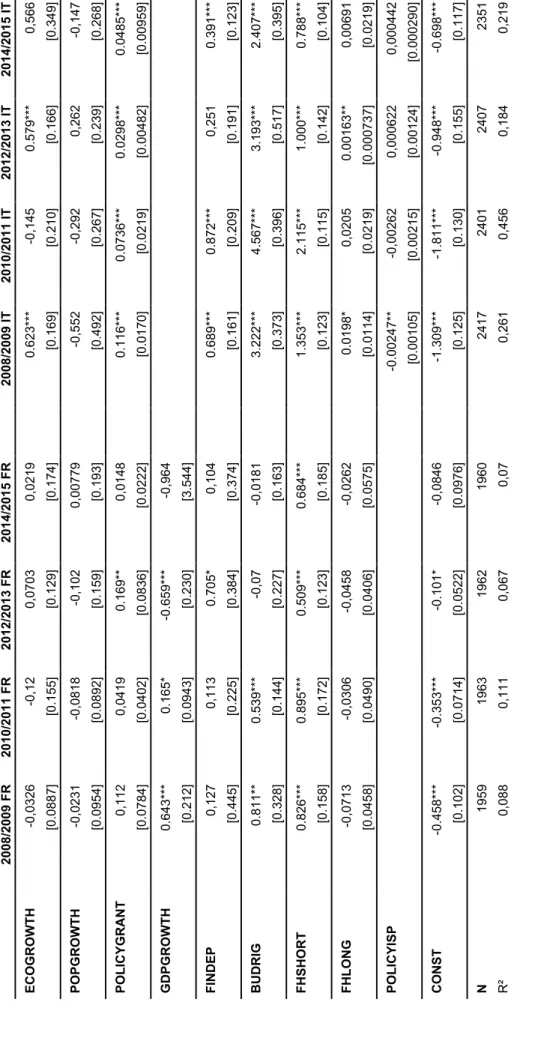
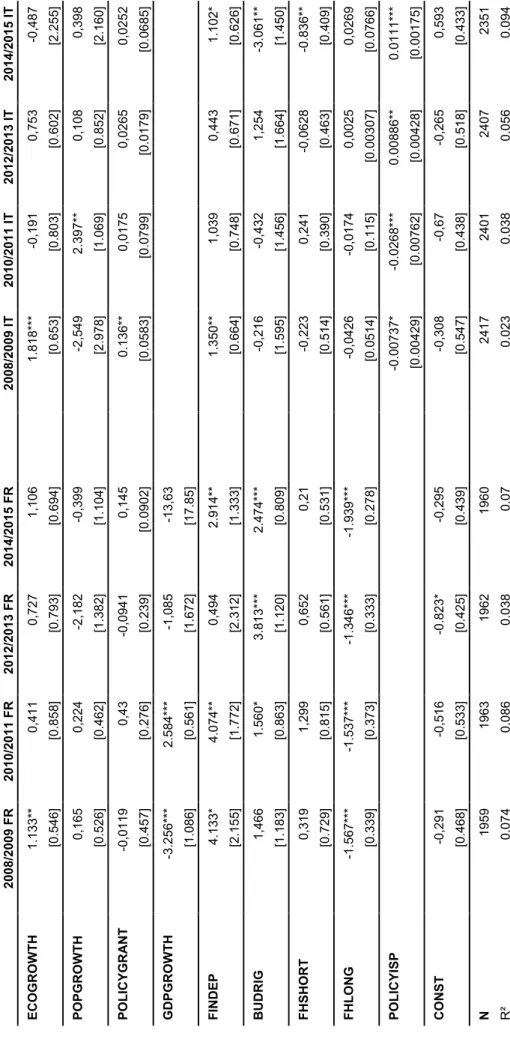
Tables 6 to 9 shows the results obtained by the panel regressions with time fixed effects for each country and each dependent variable. The standard errors in brackets represent * p<0.10, ** p<0.05, *** p<0.01. R² interpretation is not possible as instead for the linear regression. In fact, Verbeek (2004) claims that “The computation of goodness-of-fit measures in panel data applications is somewhat uncommon. One reason is the fact that one may attach different importance to explaining the within and between variation in the data. Another reason is that the usual R² or adjusted R² criteria are only appropriate if the model is estimated by OLS”. As a result, we will not comment on R².
Thanks to our regressions results, we now discuss the influence of internal, local and then national factors of vulnerability on the variation of own revenues, personnel expenses, other current expenditures and capital expenditures.
The first interesting results coming from our analysis is the existence of nation fixed effect. French and Italian municipalities decision-making on expenditures and revenues is based on two different set of factors. They are not influenced the same way by national, local and internal factors. Moreover, the existence of year fixed effect shows that their decision making has evolved throughout the post crisis years.
Table 6 – Fixed-effect model results – MOVVAR . 2008/2009 FR 2010/2011 FR 2012/2013 FR 2014/2015 FR 2008/2009 IT 2010/2011 IT 2012/2013 IT 2014/2015 IT EC O G R O W T H -0,0439 0,0701 -0,06 -0,118 0.749*** 0.393*** 0.566*** -0,294 [0.0710] [0.110] [0.106] [0.101] [0.153] [0.149] [0.127] [0.311] PO PG R O W T H -0,104 -0,0834 -0.369** -0,0801 -0,271 -0,204 0,243 0,224 [0.0835] [0.0640] [0.153] [0.190] [0.551] [0.189] [0.176] [0.387] PO L IC Y G R A N T 0,0571 0,0728 -0,0437 0.0538*** 0.0774*** -0,0027 0.0165*** 0.0246** [0.0803] [0.0871] [0.0336] [0.0193] [0.0151] [0.0138] [0.00350] [0.0106] G D PG R O W T H 0.493*** 0.592*** 0.358* -16.04*** [0.171] [0.0779] [0.211] [3.414] F IN D EP 3.181*** 3.057*** 2.355*** 3.098*** 0.758*** -0.309** 0.497*** 0.635*** [0.542] [0.504] [0.355] [0.383] [0.174] [0.137] [0.114] [0.221] BUDRIG 1.344 *** 1.438*** 2.092*** 1.768*** 2.178*** 3.319*** 2.839*** 2.688*** [0.321] [0.420] [0.191] [0.167] [0.333] [0.247] [0.263] [0.495] F H SH O R T -0,122 0,175 0.330*** 0.270*** -0.420*** -0.438*** -0.294*** -0,141 [0.130] [0.147] [0.104] [0.0913] [0.114] [0.0896] [0.0845] [0.168] FHLONG 0.214*** 0.200*** 0.140*** 0.167*** 0,0189 -0,0157 0.00737*** 0,0437 [0.0388] [0.0611] [0.0376] [0.0412] [0.0121] [0.0170] [0.000787] [0.0351] PO L IC Y ISP -0.00406*** 0.00536*** -0.00325*** -0.00107* * [0.00105] [0.00142] [0.000930] [0.000533] C O N ST -1.469*** -1.460*** -1.586*** -1.379*** -0.715*** -0.460*** -0.844*** -0.717*** [0.0959] [0.134] [0.0799] [0.0967] [0.109] [0.0962] [0.0822] [0.111] N 1959 1963 1962 1960 2417 2401 2407 2351 R ² 0,581 0,5 0,606 0,589 0,384 0,409 0,42 0,511
Table 6 – Fixed-effect model results – PEVAR 2008/2009 FR 2010/2011 FR 2012/2013 FR 2014/2015 FR 2008/2009 IT 2010/2011 IT 2012/2013 IT 2014/2015 IT EC O G R O W T H 0,00754 0,0205 -0,012 0,00248 0.269*** -0,0463 0.179*** 0,0869 [0.0318] [0.0427] [0.0330] [0.0445] [0.0666] [0.0615] [0.0437] [0 .112] PO PG R O W T H -0.0910*** -0.0551** -0.105* 0,0387 -0,0466 -0,0428 0.124** -0,0192 [0.0340] [0.0252] [0.0607] [0.0736] [0.221] [0.0818] [0.0590] [0.117] PO L IC Y G R A N T 0.0524* 0.0934*** 0.0856*** 0.0320*** 0.0326*** 0.0168*** 0.00563*** 0.00777** [0.0286] [0.0191] [0.0210] [0.00978] [0.00599] [0.00547] [0.00117] [0.00322] G D PG R O W T H 0.122* -0,0423 -0.241*** 5.601*** [0.0666] [0.0314] [0.0842] [1.815] F IN D EP 0.606*** 0.598*** 0.772*** 0.724*** 0.189*** 0.111** 0,0255 0,0295 [0.161] [0.105] [0.164] [0.235] [0.0681] [0.0501] [0.0362] [0.0337] BUDRIG -0.339*** -0.547*** -0.583*** -0.518*** -1.738*** -0.937*** -0.433*** -0.398*** [0.104] [0.0753] [0.0730] [0.0795] [0.134] [0.0961] [0.0885] [0.0893] F H SH O R T 0.1 87*** 0.124*** 0.0823** -0,0224 -0.346*** -0.0902*** -0.0861*** -0.0586** [0.0463] [0.0385] [0.0369] [0.0528] [0.0411] [0.0282] [0.0265] [0.0253] FHLONG 0.0272* 0.0514*** 0.0602*** 0.0591** 0,00105 0,00473 0,000244 0,00509 [0.0151] [0.0196] [0 .0152] [0.0239] [0.00535] [0.00785] [0.000198] [0.00530] PO L IC Y ISP 0.000912** 0,00058 -0.00158*** -0.000174* [0.000451] [0.000543] [0.000321] [0.0000961] C O N ST 0,0122 0.101*** 0.100*** 0,032 0.446*** 0.199*** 0.0612** 0.0674** [0.0298] [0.0265] [0.0193] [0.0406] [0.0431] [0.0321] [0.0267] [0.0275] N 1959 1963 1962 1960 2417 2401 2407 2351 R ² 0,133 0,179 0,18 0,36 0,301 0,12 0,079 0,041
Table 6 – Fixed-effect model results – CUREXPVAR 2008/2009 FR 2010/2011 FR 2012/2013 FR 2014/2015 FR 2008/2009 IT 2010/2011 IT 2012/2013 IT 2014/2015 IT EC O G R O W T H -0,0326 -0,12 0,0703 0,0219 0.623*** -0,145 0.579*** 0,566 [0.0887] [0.155] [0.129] [0.174] [0.169] [0.210] [0.166] [0.349] PO PG R O W T H -0,0231 -0,0818 -0,102 0,00779 -0,552 -0,292 0,262 -0,147 [0.0954] [0.0892] [0.159] [0.193] [0.492] [0.267] [0.239] [0.268] PO L IC Y G R A N T 0,112 0,0419 0.169** 0,0148 0.116*** 0.0736*** 0.0298*** 0.0485*** [0.0784] [0.0402] [0.0836] [0.0222] [0.0170] [0.0219] [0.004 82] [0.00959] G D PG R O W T H 0.643*** 0.165* -0.659*** -0,964 [0.212] [0.0943] [0.230] [3.544] F IN D EP 0,127 0,113 0.705* 0,104 0.689*** 0.872*** 0,251 0.391*** [0.445] [0.225] [0.384] [0.374] [0.161] [0.209] [0.191] [0.123] BUDR IG 0.811** 0.539*** -0,07 -0,0181 3.222*** 4.567*** 3.193*** 2.407*** [0.328] [0.144] [0.227] [0.163] [0.373] [0.396] [0.517] [0.395] F H SH O R T 0.826*** 0.895*** 0.509*** 0.684*** 1.353*** 2.115*** 1.000*** 0.788*** [0.158] [0.172] [0.123] [0.18 5] [0.123] [0.115] [0.142] [0.104] FHLONG -0,0713 -0,0306 -0,0458 -0,0262 0.0198* 0,0205 0.00163** 0,00691 [0.0458] [0.0490] [0.0406] [0.0575] [0.0114] [0.0219] [0.000737] [0.0219] PO L IC Y ISP -0.00247** -0,00262 0,000622 0,000442 [0.00105] [0.00215] [0.00124] [0.000290] C O N ST -0.458*** -0.353*** -0.101* -0,0846 -1.309*** -1.811*** -0.948*** -0.698*** [0.102] [0.0714] [0.0522] [0.0976] [0.125] [0.130] [0.155] [0.117] N 1959 1963 1962 1960 2417 2401 2407 2351 R ² 0, 088 0,111 0,067 0,07 0,261 0,456 0,184 0,219
Table 6 – Fixed-effect model results – CAPEXPVAR 2008/2009 FR 2010/2011 FR 2012/2013 FR 2014/2015 FR 2008/2009 IT 2010/2011 IT 2012/2013 IT 2014/2015 IT EC O G R O W T H 1.133** 0,411 0,727 1,106 1.818* ** -0,191 0,753 -0,487 [0.546] [0.858] [0.793] [0.694] [0.653] [0.803] [0.602] [2.255] PO PG R O W T H 0,165 0,224 -2,182 -0,399 -2,549 2.397** 0,108 0,398 [0.526] [0.462] [1.382] [1.104] [2.978] [1.069] [0.852] [2.160] PO L IC Y G R A N T -0,0119 0,43 -0, 0941 0,145 0.136** 0,0175 0,0265 0,0252 [0.457] [0.276] [0.239] [0.0902] [0.0583] [0.0799] [0.0179] [0.0685] G D PG R O W T H -3.256*** 2.584*** -1,085 -13,63 [1.086] [0.561] [1.672] [17.85] F IN D EP 4.133* 4.074** 0,494 2.914** 1. 350** 1,039 0,443 1.102* [2.155] [1.772] [2.312] [1.333] [0.664] [0.748] [0.671] [0.626] BUDRIG 1,466 1.560* 3.813*** 2.474*** -0,216 -0,432 1,254 -3.061** [1.183] [0.863] [1.120] [0.809] [1.595] [1.456] [1.664] [1.450] F H SH O R T 0,319 1,299 0, 652 0,21 -0,223 0,241 -0,0628 -0.836** [0.729] [0.815] [0.561] [0.531] [0.514] [0.390] [0.463] [0.409] FHLONG -1.567*** -1.537*** -1.346*** -1.939*** -0,0426 -0,0174 0,0025 0,0269 [0.339] [0.373] [0.333] [0.278] [0.0514] [0.115] [0.00307] [0 .0766] PO L IC Y ISP -0.00737* -0.0268*** 0.00886** 0.0111*** [0.00429] [0.00762] [0.00428] [0.00175] C O N ST -0,291 -0,516 -0.823* -0,295 -0,308 -0,67 -0,265 0,593 [0.468] [0.533] [0.425] [0.439] [0.547] [0.438] [0.518] [0.433] N 1959 1963 1962 1960 2417 2401 2407 2351 R ² 0,074 0,086 0,038 0,07 0,023 0,038 0,056 0,094