Copy-edited by LD Todd 1
2
Resistance of benthic intertidal communities to multiple disturbances
3and stresses
45
Laetitia Joseph, Mathieu Cusson* 6
7
1Département des sciences fondamentales, Université du Québec à Chicoutimi, 555 boulevard de
8
l'Université, Chicoutimi, Québec G7H 2B1, Canada 9
10
*Corresponding author: [email protected]
11
RPH: Joseph & Cusson: Benthic resistance to multiple disturbances and stresses 12
13
ABSTRACT: Many ecosystems are facing biodiversity loss and environmental change due to 14
anthropogenic activities, with these impacts occurring within the context of natural disturbance. 15
Understanding ecosystem functioning and the response of communities to these impacts is 16
necessary in order to evaluate the effects of future environmental change. The aim of this study 17
was to determine the consequences of the loss of key species on the structure and function of 18
intertidal communities in a context of nutrient enrichment, so as to ascertain the resistance of 19
these communities when disturbance and stresses are compounded. Subarctic rocky intertidal 20
communities in Quebec were subjected to an orthogonal factorial field experiment with 2 21
disturbances, macroalgae canopy loss, grazer exclusion, and the stress of nutrient enrichment. 22
Simple and interactive effects of these factors were followed for 4 mo, and responses in structure 23
(% cover and biomass) and productivity were evaluated. The communities that were not 24
subjected to canopy loss showed greater resistance and very limited effects from enrichment and 25
grazer reduction. The loss of canopy altered the community structure (e.g. reduction in richness 26
and biomass) and functioning (reduced productivity), probably due to increased temperatures and 27
desiccation. This lack of resistance was amplified through the addition of a stress. The 28
application of multiple stresses within field experiments allows for a better understanding of the 29
mechanisms affecting community structure and ecosystem functioning under situations of 30
increased natural and anthropogenic stress. 31
KEY WORDS: Community structure ∙ Functional response ∙ Multiple stressors ∙ Resistance ∙ 32
Canopy disturbance ∙ Grazers ∙ Nutrient addition ∙ Rocky intertidal 33
INTRODUCTION
34In many ecosystems, natural disturbances are coupled with human activities, affecting 35
both abiotic and biotic properties of the system (Vitousek et al. 1997b, Tilman & Lehman 2001). 36
Habitat destruction (Brooks et al. 2002, Tole 2002, Hanski 2005), pollution (McNeely 1992, 37
Oleksyn & Reich 1994) and alterations of biogeochemical cycles (e.g. carbon and nitrogen) by 38
human activities (Vitousek et al. 1997a,b, Rabouille et al. 2001) negatively impact the structure 39
and functioning of many ecosystems (Vitousek et al. 1997b, Hooper et al. 2005). Biodiversity 40
loss is a major threat to ecosystem functioning (Hooper & Vitousek 1997, Tilman 1999, Hooper 41
et al. 2005, Stachowicz et al. 2007) and may be considered equal in importance to other major 42
environmental changes (e.g. climate warming, nutrient loading) in terms of the effects on overall 43
ecosystem health (Hooper et al. 2012). Biodiversity can play an important role in countering 44
stresses on ecosystems; therefore, understanding the consequences of biodiversity loss for 45
ecosystems has prompted numerous ecological studies (Grime 1997, Loreau et al. 2002, Worm et 46
al. 2006). 47
The link between biodiversity and ecosystem stability has been well studied (MacArthur 48
1955, Elton 1958, Pimm 1984, Tilman 1996, Lehman & Tilman 2000). Greater diversity 49
generally increases the stability of ecosystems as a greater number of species will encompass a 50
broader range of functional traits and response strategies to disturbance (Tilman & Downing 51
1994, Tilman 1996, 1999, Yachi & Loreau 1999, Stachowicz et al. 2007). An essential attribute 52
of ecosystem stability is therefore resistance (or ‘inertia’ sensu Underwood 1989), which is 53
defined as the capacity of a system to remain unchanged when faced with disturbance or stress 54
(Pimm 1991, Grimm & Wissel 1997, Lehman & Tilman 2000). 55
The presence of certain key species may increase the stability (and resistance) of a 56
community (Maggi et al. 2009, Grman et al. 2010, Watson & Estes 2011). In the context of 57
biodiversity loss, the disappearance of key species will likely have a major effect on ecosystem 58
functioning. For instance, habitat-forming species (or ecosystem engineers and bioengineers, 59
sensu Jones et al. 1994) offer refuge and protection for numerous organisms and thus play a 60
crucial role in ecosystem functioning. The loss of habitat-forming species has a negative impact 61
on the surrounding community through a reduction in associated species richness and abundance 62
(Rueda et al. 2009, Pillay et al. 2010, Schein et al. 2012, Do et al. 2013, Watt & Scrosati 2013). 63
Habitat-forming macroalgae, often dominating the intertidal zone of rocky shore habitats, 64
are considered key species for their ecosystem (Hawkins & Hartnoll 1983, Raffaelli & Hawkins 65
1996). They play an important role in structuring the community (Hawkins & Harkin 1985, 66
Jenkins et al. 1999a), providing a food supply (Hawkins & Hartnoll 1983), modifying physical 67
conditions and reducing physical stress (e.g. desiccation and wave action) for the understorey 68
community (Bertness & Leonard 1997, Bertness et al. 1999). However, sweeping by canopy 69
algae may also have negative effects on the understorey (Hawkins 1983, Hawkins & Harkin 70
1985, Jenkins et al. 1999b). Currently, macroalgae (including fucoids) are undergoing a global 71
decline (Eriksson et al. 1998, Walker & Kendrick 1998, Airoldi 2003, Airoldi & Beck 2007, 72
Connell et al. 2008) caused by both climate change and other regional and local-scale human 73
impacts (Hawkins et al. 2009). This loss of fucoids will therefore have major consequences for 74
the understorey community (Jenkins et al. 1999a, Worm & Duffy 2003) by reducing species 75
richness (Schiel & Lilley 2011, Watt & Scrosati 2013) and enhancing ephemeral algae 76
recruitment (Jenkins et al. 1999a, Bulleri et al. 2002, Schiel & Lilley 2007, 2011). Moreover, 77
changes in the abundance of macroalgae could also affect community function by reducing 78
primary production (Tait & Schiel 2011a, Valdivia et al. 2012, Crowe et al. 2013). 79
Grazers are also an important element structuring intertidal communities, especially 80
during early succession, applying strong top-down control on algal recruitment (Hawkins 1981, 81
Hawkins & Hartnoll 1983, Anderson & Underwood 1997, Jenkins et al. 2005, Coleman et al. 82
2006, Aguilera & Navarrete 2012), thereby influencing the course of species succession. Grazer 83
exclusion often leads to inhibition of later successional taxa (e.g. Fucus spp.) by ungrazed, early 84
settling ephemeral algae such as Ulva spp. or Porphyra spp. (see Lubchenco 1983, Anderson & 85
Underwood 1997, Jenkins et al. 1999c). On the other hand, human activities that generate 86
nutrient enrichment in coastal environments (e.g. Paerl 1997, Allen et al. 1998) may lead to 87
increases in the abundance of ephemeral algae (Johansson et al. 1998, Korpinen et al. 2007, 88
Kraufvelin et al. 2010), that exacerbate bottom-up controls within communities. Biodiversity can 89
be an important factor buffering against this nutrient loading. For example, canopy and grazer 90
loss lead to a community more sensitive to nutrient addition, and an increased abundance of 91
ephemeral algae (e.g. Worm & Lotze 2006), while the effects on invertebrates are unknown. 92
Such removals simulate anthropogenic removal of canopies (e.g. fucoid harvesting, Ugarte & 93
Sharp 2001) or the collection of grazers (Martins et al. 2010). 94
Ecological communities are often exposed to multiple interacting disturbances and 95
stresses, both natural and anthropogenic. Studying the potential effects (synergic or antagonistic) 96
of these disturbances and stresses on communities will contribute to our understanding of the 97
cumulative impacts that shape communities. Single, isolated effects of canopy or grazer removal 98
and enrichment have been broadly studied, yet few studies have simultaneously examined the 99
coupled impacts of biodiversity loss and stress. Eriksson et al. (2007) made field manipulations 100
using multiple treatments, but their study focused only on algal community responses (e.g. 101
understorey and recruits). Multiple interactive impacts on both macroalgae and 102
macroinvertebrate assemblage structure and function have not yet been properly studied. 103
The aim of our study was to determine the in situ consequences of the loss of key species 104
(macroalgae canopy and grazers) on ecosystem structure and functioning in the presence of 105
nutrient enrichment and to evaluate the resistance of the benthic community when species loss 106
and stress are coupled. Specifically, we evaluated the response of subarctic benthic communities 107
subjected to both single and interactive effects of canopy removal, grazer exclusion and nutrient 108
enrichment on community structure and functioning (by using community productivity and 109
respiration) and the resistance of intertidal rocky shore communities. This study also provides 110
insight into the respective role of top-down controls, ecosystem engineers and bottom-up forcing 111
in shaping community structure and ecosystem functioning (see also Thompson et al. 2004, 112
Crowe et al. 2011). Such forcing is not yet understood for the subarctic ecosystem of the St. 113
Lawrence Estuary. This site was selected as it is subjected to both natural and anthropogenic 114
stressors including ice-scouring (Archambault & Bourget 1983, Bergeron & Bourget 1984), a 115
predicted increase in water movements (Savard et al. 2008), along with eutrophication 116
(Thibodeau et al. 2006, Gilbert et al. 2007) all which may affect the abundance of macroalgae 117
and grazers in benthic intertidal communities. We hypothesized that in addition to a significant 118
impact from canopy and grazer removal individually, community structure and ecosystem 119
functioning would be even more affected due to synergetic effects when these disturbances are 120
coupled with nutrient enrichment stress. 121
MATERIALS AND METHODS
122Study site
123The experiment was conducted between May and September 2012 near the village of 124
Sainte-Flavie on the south shore of the St. Lawrence Estuary, Quebec, Canada (48° 37' 42.5'' N, 125
68° 11' 55.7'' W). The study area is representative of a subarctic flat rocky shore habitat as it is 126
subjected to ice-scouring during winter and early spring (Archambault & Bourget 1983, 127
Bergeron & Bourget 1984). Temperature and salinity range from 4 to 16°C and 24 to 29‰, 128
respectively (Fradette & Bourget 1980, Archambault & Bourget 1983). The intertidal fauna and 129
flora are characteristic of a moderately wave-disturbed environment (Archambault & Bourget 130
1983). In the mid-intertidal zone, the macroalgal canopy is composed of Fucus spp. (F. distichus 131
edentatus and F. vesiculosus) and the invertebrate assemblage is dominated by gastropod grazers
132
(Littorina obtusata and L. saxatilis; see Table S1 in the Supplement at www.int-133
res.com/articles/suppl/XXXpYYY_supp.pdf for a complete list) and by filter feeder blue mussels 134
(composed of Mytilus edulis, M. trossulus and hybrids, hereafter referred to as Mytilus spp.). The 135
shores of the estuary are often covered with ice during the winter (mid-December until the end of 136
March); the ice sheet provides protection for the biological assemblages against extreme cold. 137
The ice, however, may also act as an indiscriminate disturbance factor on the flat rock surfaces 138
and exposed crevices through heavy ice-scouring (Bergeron & Bourget 1984, Åberg 1992, 139
McKindsey & Bourget 2001). 140
Experimental design
141We used an orthogonal factorial experimental design in order to evaluate the effects of 142
biodiversity loss (canopy [Ca], 2 levels; grazer [Gr], 2 levels) and nutrient enrichment (Nu, 2 143
levels) on the structure and functioning of the intertidal benthic communities ( ). All 8 144
treatments from this design, and a procedural control (for the grazer exclusion; see below) were 145
replicated 4 times (n = 4) and randomly assigned to 36 experimental plots (50 × 50 cm) on 146
emergent rocky substrates within our study area. All plots were placed at a similar height in the 147
mid-intertidal zone (average of 1.34 ± 0.20 m), in a 400 m wide area. The experimental plots, 148
marked using anchor screws, were haphazardly selected with the criteria of homogenous flat 149
substrate, lacking pools or large crevices, with a minimum of 80% cover of Fucus spp. A 150
minimum distance of 3 m between plots was respected so as to avoid treatment interaction. 151
For the canopy treatment, we had 2 treatment levels: canopy present (C+) where the 152
canopy was untouched, and canopy absent (C–) where all canopy taxa (i.e. Fucus spp.) holdfasts 153
were removed within the 50 × 50 cm area. 154
The grazer treatment also had 2 treatment levels: grazers present (G+) and grazers absent 155
(G–). In the latter, the grazers L. obtusata, L. saxatilis and L. littorea, Tectura testudinalis, 156
Margarites spp. and Jaera marina were removed by handpicking. The exclusion treatment was
157
designed using a physical barrier composed of a thin layer of natural sticky barrier (Tree 158
Tanglefoot Insect Barrier; Contech) and a small twisted wire brush (2 cm diameter) placed on 159
cleared (5 cm width) surfaces along the contour of the experimental plot. When needed, these 160
surfaces were smoothed using a small quantity of concrete (Poly-Plug Bomix; Daubois) and 161
epoxy (West Systems). Procedural controls (n = 4) with incomplete exclusions were also 162
implemented in natural communities. No difference was observed between the control plots (C+, 163
G+ and no enrichment) and the procedural controls for any response variables, with the 164
exception of richness on Date 4. At the study site, the abundance of small grazers (<2 mm) is 165
great and the use of cages with small screens would certainly have had an effect on the natural 166
communities. Moreover, the cageless grazers treatment used in this study did not have the 167
undesired effects of light and flow reduction and detritus retention commonly observed with 168
cage use (Range et al. 2008). 169
For the nutrient enrichment, 2 levels were used: natural conditions (N–) and enriched 170
conditions (N+) where a controlled addition of slow-release fertilizer pellets of 14% nitrogen 171
(NO3-N and NH3-N), 14% P (P2O5) and 14% K (K2O) (Smartcote®; Plant Prod) was used within
172
the experimental plots. Enrichment through slow-release fertilizer pellets has been tested (Worm 173
et al. 2000) and used in many habitats (Worm et al. 2000, Eriksson et al. 2006a, 2007, Korpinen 174
et al. 2007, Jochum et al. 2012). This method produces independent nutrient treatments within a 175
2 m distance from the source (Worm et al. 2000). Two mesh bags containing 100 g of fertilizer 176
pellets were screwed at the opposite corners of the 50 × 50 cm plots and replaced every month. 177
For all other experimental plots, inert control bags with washed pebbles were used to take into 178
account any bag effects (e.g. as additional substrate). When replaced, the collected nutrient bags 179
were weighed (dry weight loss) to estimate the amount of nutrient diffused into plots. An average 180
of 31 ± 0.15% of weight loss was observed, with a total estimated diffusion of 8.64 ± 0.57 g of 181
total nitrogen per month into each plot. This level of nutrient enrichment is comparable to 182
moderate eutrophication, which is anticipated for the St. Lawrence Estuary (Thibodeau et al. 183
2006, Gilbert et al. 2007). Pilot tests in the field showed a 3- to 6-fold increase in total nitrogen 184
concentrations in water samples from an enriched quadrat compared to the natural concentration 185
of the St. Lawrence Estuary. F. distichus edentatus tissues from control and nutrient-enriched 186
plots were collected at the end of the experiment and their total nitrogen content was compared 187
(analyzed at the INRS Laboratory, Quebec City). The total nitrogen content values in the Fucus 188
tissues from nutrient-enriched plots were slightly higher than those in the controls (average of 189
1.06 ± 0.05% and 0.95 ± 0.04% nitrogen, respectively; F1,20 = 7.07, p = 0.015), providing
190
evidence that the additional nutrients had been incorporated into the algae. 191
Canopy and grazer treatments were ‘press’ type perturbation (sensu Bender et al. 1984) 192
experiments, as experimental conditions of the densities of these species into plots were altered 193
and controlled every 9 to 11 d. During each inventory (see following sub-section) and during 194
maintenance (between inventory periods), new Fucus spp. juveniles and grazers were 195
estimated/counted and thereafter removed from the plots. Even when grazer abundance was 196
reduced for several days (up to 4 d; L. Joseph, M. Cusson and S. Cimon unpubl. data), the grazer 197
treatment (G–) failed to significantly reduce their abundance during the period between 2 198
maintenance sessions. However, although grazer removal efficiency failed (about 40% of the 199
time) on a bi-monthly time-scale, some statistically significant differences were observed for the 200
grazer treatments and the treatment was not removed from data analyses. Thus the treatment is 201
referred to as ‘grazers reduced’ rather than ‘grazers absent’, and was interpreted accordingly. 202
Sampling
203Structure of the community
204The community in each plot was sampled using a 30 × 30 cm quadrat placed in the centre 205
of the experimental plots. Non-destructive visual estimates of abundance as % cover of all 206
identified taxa >1 mm (usually to species level) for each plot were made at 4 distinct times: Date 207
1 (June 2 to 9, before establishment of the treatments), Date 2 (July 1 to 8), Date 3 (July 31 to 208
August 6) and Date 4 (August 29 to September 4). Inventories were performed before any 209
maintenance of the plot. The % cover of macroalgae and mussels were estimated with the 210
division of the 30 × 30 cm frame into 25 equal squares, each representing 4% of the total quadrat 211
cover. This latter procedure is common (e.g. Scrosati et al. 2011, Crowe et al. 2013), and use of 212
the same unit among abundances is necessary in order to assess the community dominance 213
profiles in our treatments. Mobile invertebrates were counted and later transformed into % cover 214
(e.g. regression to convert density in % cover with n = 129, R2 = 0.66 for Littorina sp.; arbitrary
215
value of 0.25% for each individual of L. littorea, T. testudinalis, and Nereis sp.; 0.1% for each 216
individual of Lacuna vincta and Margarites sp.; 0.01% for each J. marina). The cover was 217
estimated per species, so the total summed % in a plot often exceeded 100%. Following the last 218
visual inventory, we destructively sampled in order to collect all biomass (except crustose 219
species) in the sampled 30 × 30 cm plot. The biomass samples were sieved ( 1 mm) and all 220
individuals were identified under a microscope and weighed (±0.00005 g). Biomass was 221
converted into energy (kJ) by applying conversion factors from Brey (2004). 222
Functioning of the community
223To assess the effects of nutrient enrichment on community functioning with or without 224
canopy, measures of primary production were estimated at the end of July, near midday over 3 225
consecutive sunny days. Estimates were derived from variations in CO2 concentration (ppm)
226
using benthic chambers following the method described by Migné et al. (2002). Subsampled 227
plots in each treatment (n = 3 for control and N; n = 2 for C and CN) were randomly chosen for 228
primary production measurements and randomly ordered during the sampling days. The chamber 229
consisted of a transparent dome and a base of Plexiglas© placed over the 30 × 30 cm sampled 230
community plot, then sealed airtight to the ground using neutral silicon. CO2 variations in the
231
chamber were measured using an infrared CO2 gas analyzer (Li-800; LI-COR) and recorded on a
232
data logger (Li-400; LI-COR) every 15 s for 15 to 20 min. Measurements of CO2 concentrations
233
were conducted at ambient light (>1000 mol photon m–2 measured at PAR, 600 to 700 nm) for
net primary production (NPP) and with an opaque polyethylene sheet placed over the chamber in 235
order to measure respiration (R). The CO2 fluxes for NPP and R were calculated using the
236
following formula: 237
Flux (mmol C m–2 h–1) = b (18.2 × 60) / (22.4 × 1000 × 0.09)
238
where the slope, b, is obtained through a linear regression of the CO2 variations recorded from
239
the chambers, 18.2 = volume (l) of air in the chamber, 60 = min in an hour, 22.4 = molar air by 240
litre in molar volume. The gross primary production (GPP) of the community was then 241
calculated by adding NPP and R. Note that this method is not used for calculating a global CO2
242
budget but serves to estimate the metabolic state of the community under the same conditions 243
and for comparison among treatments. 244
Data analysis
245All analyses were performed on the associated community only (unless otherwise stated); 246
the manipulated taxa (Fucus spp. and grazer species) were excluded from the data prior to 247
analyses. 248
To test for the effects of the treatments and the interactions between and among them, 249
repeated measures of analysis of variance (RM-ANOVA) with 4 fixed factors (date: 3 levels; Ca, 250
Gr and Nu: 2 levels each) were performed on total abundance (sum of all species in % cover 251
within the 30 × 30 cm sampled plots), richness (S) and the Simpson’s index of diversity (1 – ). 252
Date 1 was not included in the latter analysis. Following this test, we also applied separate 3-way 253
ANOVAs (with factors of C, G and N) performed at each date in order to appreciate the 254
evolution of any effects over time (see Table S2 in the Supplement). A 3-way ANOVA was 255
performed for total biomass abundance, as this variable was only available for the last date. 256
Separate analyses of total abundance and richness of understorey algae and invertebrates 257
(without grazers) were also performed. ANOVA assumptions were checked by graphical 258
examination of the residuals (Montgomery & Mastrangelo 1991, Quinn & Keough 2002); no 259
transformations were necessary. When a factor was significant, a multiple comparison test 260
(Tukey’s HSD or if stated, Student’s t) was performed to look at the differences between 261
treatment levels. Comparisons of taxa abundance for some species were investigated using a t-262
test or Wilcoxon rank sum test when the assumptions of normality and equality of variances 263
were not met. 264
The effects of the treatments on the structure of the community (in % cover and biomass 265
data, based on Bray-Curtis similarities) were investigated for each date using a permutational 266
multivariate analysis of variance (PERMANOVA; Anderson et al. 2008) with 999 permutations 267
and with the same factors (C, G and N) as described above. Abundance data for % cover and 268
biomass were square-root transformed and fourth-root transformed, respectively, while data were 269
transformed into presence–absence for effects on compositional community structure. The 270
effects of the treatments were visualized using principal coordinate analysis (PCO). A similarity 271
percentage analysis (SIMPER) was used to assess the percentage contribution of each taxon to 272
the observed dissimilarities among treatments. 273
The effect of enrichment and canopy loss on GPP, NPP and R were analyzed using a 274
Kruskal-Wallis test (treatment fixed 4 levels) among control and N (n = 3) and C and CN (n = 2) 275
treatments (see Fig. 1 for treatment details). 276
Univariate analyses were made using JMP v.10.0; multivariate analyses and ordinations 277
were conducted using PRIMER+PERMANOVA v.6.1.6 (Clark & Gorley 2006, Anderson et al. 278
2008). A significance level of = 0.05 was used for all statistical tests, however, observed p-279
levels close to significance were carefully considered. 280
RESULTS
281A total of 35 different taxa were observed at our site with an average (±SE) of 9.0 ± 0.3 282
species (min. = 5, max. = 19) per sampled quadrat (30 × 30 cm). Eleven algal taxa were reported, 283
the most abundant being Fucus distichus edentatus and Ralfsia clavata, along with 24 taxa of 284
invertebrates with grazers (e.g. Littorina saxatilis, L. obtusata, Tectura testudinalis) and filter 285
feeders (e.g. Mytilus spp.) being the most common. A list of all observed taxa is presented in 286
Table S1 in the Supplement. 287
Effects of single and multiple stresses
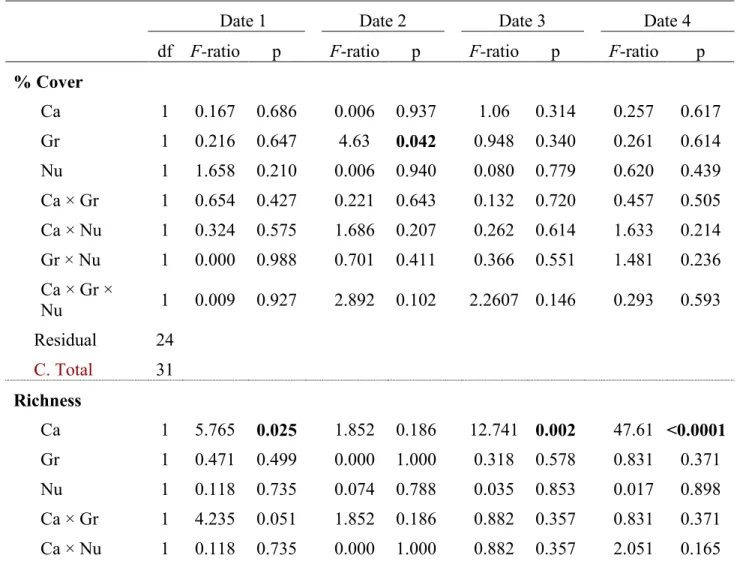
288Community abundances and diversity indices
289The canopy, grazer and nutrient enrichment treatments had different effects on the 290
associated community, and some of them varied among sampling dates. Total abundance in 291
terms of % cover was not affected by any of the treatments nor by date ( , Table S2a in the 292
Supplement), whereas in all treatments, the average values of richness and diversity were 293
affected by date (Tables 1 & S2b,c). Average richness values were significantly higher (more 294
than 2-fold) at the end of the experiment (Date 4) compared to the other dates (F3,96 = 147, p <
295
0.0001). This was due to the addition of cryptic taxa (originating, for example, from sediments or 296
in between the mussel aggregations) that had been collected during the destructive sampling 297
method after the last inventory. 298
Some significant effects were detected before the start of the experiments (Date 1; 299
annexed Table 1). This cannot be easily explained as the treatments had not been yet 300
implemented. Variation between the 2 categories of plots was, however, small in comparison to 301
the differences observed later over the course of the experiment. Plots where the canopy cover 302
was to remain had 3.75 ± 0.32 species and a Simpson’s index of diversity of 0.51 ± 0.03, while 303
plots where the canopy was to be removed had a lower richness (2.88 ± 0.10 species) and a 304
diversity of 0.39 ± 0.03. Treatments were randomly assigned to plots along a 400 m wide 305
transect along the shore where some variability among natural communities can occur. However, 306
no effects on community abundance structure were observed (see next section) and the 307
significant effects observed at Date 1 had dissipated by Date 2 (see Table 1). 308
Species richness was significantly affected by the Date × Ca treatment (Table 1) and 309
differences were seen at both Dates 3 and 4 (Table S2b). Average richness values were lower 310
when the canopy was absent than when present, with differences between C+ and C– of 1.28 and 311
3.24 at Dates 3 and 4, respectively (cf. a for Date 4). Among dates, the grazer treatment 312
affected richness differently between the enrichment treatments as shown by the significant Date 313
× Gr × Nu interaction (Table S2b, Fig. 2b). Diversity was significantly affected by the grazer 314
treatment in presence of a canopy at Dates 3 and 4, with higher values in grazer-reduced plots 315
(illustrated in Fig. 2c for Date 4, see also Table 1). 316
In contrast to total abundance as % cover, total abundance as biomass was significantly 317
affected by the canopy treatment (Table 1). When the canopy was removed, more than half of the 318
total biomass of associated taxa disappeared (Fig. 2d), with an average of 95% attributed to a 319
loss of mussel biomass. 320
When the associated community was separated into 2 groups (understorey algae and 321
invertebrates) and compared with respect to total abundance (% cover) and richness at Date 4, 322
understorey algae had a higher cover when the canopy was absent ( a; Student’s t-test, t = – 323
3.0, p = 0.016) but had similar species richness (t = 0.71, p = 0.482, with only R. clavata 324
present). Invertebrates were more abundant (t = 2.0 p = 0.05) and had higher richness (t = 6.73, p 325
< 0.0001) when a canopy was present (Fig. 3a,b). 326
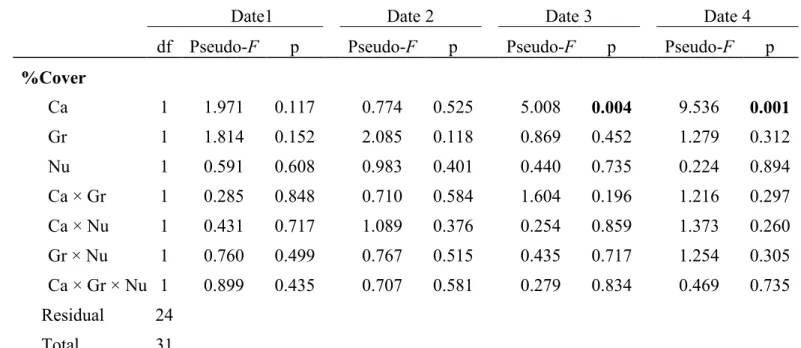
Community structure
327All communities in the experimental plot categories were similar prior to the start of the 328
experiment (Date 1). The canopy treatment significantly affected the associated community 329
structure (Pseudo-F1,24 = 5.008, p = 0.004; ) only 50 d after the start of the experiment
330
(Date 3), with differences remaining significant until the end of the experiment (Date 4; a). 331
This effect was also detected in the biomass structure (Table 2, Fig. 4b). The associated 332
community abundance structure (either as % cover or biomass) was not affected by the grazer or 333
by the nutrient enrichment treatments. We observed similar results in compositional structure (all 334
abundances transformed into presence–absence, results not shown). The composition changed 335
between dates, and a significant effect of canopy treatment was observed on Dates 3 and 4, but 336
no effect from either the grazer or nutrient enrichment treatments was observed. 337
Of all treatments (individual or in combination), those that included the canopy treatment 338
had greater average dissimilarities over time when compared to the natural assemblages (i.e. 339
control plots) ( ). Four weeks after the start of the experiments (Date 2), dissimilarities 340
between the control plots and all other treatments had generally increased. Only after 2 mo (Date 341
3) did the treatments with the canopy treatment (i.e. CG, CGN, C and CN) become significantly 342
more dissimilar from the natural communities, while the other treatments (i.e. N, G and GN) 343
became more similar to the control plots over time (smaller dissimilarity). At the end of the 344
experiment, larger dissimilarities (compared to controls) were observed with the C, CG and CGN 345
treatments (Fig. 5). At Date 3, the main species causing 90% of the dissimilarity were the 346
mussels Mytilus spp., the encrusting algae R. clavata and the sea anemone Aulactinaria stella. At 347
Date 4, those same species still accounted for the dissimilarities with an addition of Polychaeta 348
and Oligochaeta. 349
For the community structure expressed in biomass, C– treatments were significantly more 350
dissimilar from the natural communities; CG and CGN treatments had the highest dissimilarities 351
( ).
352
The grazer treatment using cageless techniques failed to significantly reduce the 353
abundance (in % cover and biomass) of grazer species except for the first month of the 354
experiment (results not shown). Yet the abundances were reduced for several days (up to 4 out of 355
9 or 10 d; L. Joseph, M. Cusson and S. Cimon unpubl. data). The non-accessibility of the plots at 356
high tides constrained constant removal and hence considerably lower abundance. 357
A closer examination of the canopy removal effect on grazers (i.e. those that were not 358
considered as part of the associated species in all other analyses) illustrated that the absence of 359
canopy (only in G+ treatment plots) had a significantly negative effect on the abundance of L. 360
obtusata and Jaera marina (reduction of 94 and 95%, respectively), but was not significant for
361
Mytilus spp. (31%). In contrast, it had a positive effect on the average abundance of the
362
gastropods L. saxatilis and L. littorea (increase of 87 and 100%, respectively) as well as for the 363
encrusting algae R. clavata, which increased its percentage cover by 6-fold when the canopy was 364
absent. Using the biomass structure data, the absence of canopy had a significantly negative 365
effect on the biomass of those species (reduction of 98% for both L. obtusata and J. marina, and 366
49% for Mytilus spp.) except for L. saxatilis and L. littorea having a higher biomass when the 367
canopy was removed (increase of 53 and 100%, respectively). 368
Community function
369Nutrient enrichment and canopy treatments had no effect on NPP (2 = 6.67, p = 0.083)
370
or R (2 = 4.36, p = 0.225) ( ), while for GPP there was a difference observed for the
371
canopy treatment but no effect from nutrient enrichment (2 = 8.13, p = 0.044) (Fig. 7).
372
However, when the canopy was removed, we observed only very small values of NPP and GPP 373
for the communities. Only positive CO2 fluxes were observed (Fig. 7) for C– treatments,
374
meaning that the productivity of the understorey algae species was negligible compared to the 375
respiration of heterotrophic organisms. 376
DISCUSSION
377Our study showed that, taken in isolation, canopy loss was the strongest single effect 378
affecting community structure and functioning, while community resistance was observed when 379
grazers were reduced and nutrients were added. When these 3 factors were added together, 380
various trends emerged, suggesting a lower resistance of the community when facing multiple 381
stressors. 382
Resistance of the community
383High resistance of the benthic community to nutrient enrichment and periodic grazer 384
reduction was observed in this study. The absence of canopy, on the contrary, strongly affected 385
the resistance of the associated species. Undoubtedly, the canopy macroalgae played a key role 386
in the stability of the structure and function of the benthic community. Interestingly, the effects 387
of the absence of canopy appeared only after 2 mo of treatment, indicating temporary resistance 388
most likely due to the large number of Fucus spp. juveniles that appeared and grew fast as part of 389
an initial resilience (with an average cover of 41 ± 24%), perhaps still providing some protection 390
for the understorey species. This ‘pulse’ perturbation (after a single event; Bender et al. 1984) 391
was not enough to induce change; maintaining the removal longer, or applying a ‘press’ 392
perturbation, provoked change. One month after impact, communities in all treatments increased 393
their dissimilarity from the controls. However, C+ treatments thereafter decreased in 394
dissimilarity, while most C– treatments continued to increase their dissimilarities. This suggests 395
less resistance to canopy removal (i.e. Fig. 5). 396
Effects on community structure
397The absence of canopy reduced species richness and affected the entire structure of the 398
associated (unmanipulated) species abundance, both in terms of % cover and biomass. The loss 399
of Fucus spp. as a habitat-forming species resulted in less facilitation and an increased stress 400
level (e.g. temperature, wave action, etc.) for the understorey species (Bertness et al. 1999, see 401
also stress as ‘lateral modifiers’ in Thompson et al. 2004). We often observed temperatures that 402
were >10°C higher on substrates when the canopy was removed (measured by an infra-red 403
camera; data not shown). The presence of the canopy cover may increase richness and diversity 404
by improving conditions, as shown by Schiel & Lilley (2007, 2011) and Watt & Scrosati (2013). 405
Settling species need to overcome the physical impacts of wave action, higher temperatures and 406
whiplash (Lewis 1964, Hawkins 1983, Jenkins & Hawkins 2003). For example, whiplash by 407
surrounding algae and higher temperatures (i.e. desiccation) can lead to a decrease in recruitment 408
and growth of algal propagules (Kiirikki 1996, Kim & DeWreede 1996, Irving & Connell 2006) 409
and to a higher mortality rate of settling species (Hawkins 1983, Kim & DeWreede 1996, 410
Ingolfsson 2008). Canopy loss may lead to bleaching of algae and the reduction of invertebrates 411
due to their exposition to light, elevated temperatures and wave action (Jenkins et al. 1999a,b, 412
Cervin et al. 2004). When the canopy was removed, more understorey algae (especially 413
encrusting algae Ralfsia clavata) and fewer invertebrates were observed (cf. Fig. 3), confirming 414
the findings of the above-cited literature. In our study, canopy absence reduced species richness 415
and negatively affected diversity, but only in the absence of grazers. In addition, the reduced 416
abundance of invertebrates (cf. Fig. 3) with canopy loss might also be caused by lower food 417
supply. Littorina obtusata, the dominant grazer in the presence of a canopy, was replaced by L. 418
saxatilis when the canopy was removed. This change could be explained by their feeding habits,
419
since although both L. obtusata and L. saxatilis feed on Fucus spp. (Watson & Norton 1987, 420
Barker & Chapman 1990, Laurand & Riera 2006), L. saxatilis also feeds on rocky surface 421
biofilms (Sacchi et al. 1977, Hawkins et al. 1989). 422
The open space created by the removal of the canopy may be colonized by other species 423
such as turf-forming or ephemeral algae (Sousa 1979, Reed & Foster 1984, McCook & Chapman 424
1993, Lilley & Schiel 2006). In our study, however, only R. clavata benefitted from the absence 425
of the canopy by extending its cover (cf. Fig. 3). Propagule availability (Reed & Foster 1984, 426
Sousa 1984) and the timing of treatment initiation in the season (Archambault & Bourget 1983) 427
are critical for recolonization. Even though Fucus spp. recruitment occurs primarily during the 428
summer (Archambault & Bourget 1983, Lamote & Johnson 2008), the delayed start of our 429
experiments (late spring) combined with a lack of efficient grazer exclusion probably explain the 430
lack of ephemeral algae. However, Archambault & Bourget (1983) observed rapid colonization 431
of substrate by ephemeral algae after removing the canopy over the same period of the year and 432
in the same region as our study. In the St. Lawrence Estuary, the abundance of ephemeral algae 433
may vary among years, as very few species were observed in our study whereas 1 yr later (i.e. 434
summer 2013), Porphyra spp. were very abundant with fewer fucoid juveniles (authors’ pers. 435
obs.). 436
No proliferation of ephemeral algae was observed in our study, although ephemeral 437
species (e.g. Porphyra spp., Ulva spp. and Chordaria spp.) may be abundant in the lower part of 438
the intertidal zone. The reduced grazer treatment in our study led to increased diversity. This 439
seemed to be mainly caused by a small evenness (J') in the G+ treatments due to the dominance 440
of the mussels Mytilus spp. (results not shown). Other species accounted for the difference in 441
diversity as the encrusted algae R. clavata, the polychaetes Nereis spp. and the sea anemone 442
Aulactinia stella were more abundant in the treatments when grazers were reduced. This
443
observation is, however, difficult to explain, as grazer treatment effects are mainly expected on 444
algae and not on invertebrates. The fact that our grazer treatment was not as efficient as we 445
expected between maintenance sessions may explain the limited effects that were observed in 446
our study. Sticky barriers have proven their efficiency reducing gastropods grazers in warmer 447
environments (e.g. Australia: 10 × 10 cm plots, Range et al. 2008; California: 10 × 10 cm plots, 448
Aquilino & Stachowicz 2012). In our study, however, the large size of the exclusion (50 × 50 449
cm) as well as the cold waters of the St. Lawrence Estuary may have reduced their efficiency. 450
Nitrogen is known to be a limiting nutrient for algae in marine habitats. High levels of 451
nitrogen in water are used by algae for growth (Wheeler & North 1980) or storage (Chapman & 452
Craigie 1977). Ephemeral algae are fast-growing species and will therefore use nutrients more 453
rapidly than perennial algae like fucoids (Duarte 1995). Even if we did observe higher nitrogen 454
content in macroalgae, the enrichment treatment did not affect the associated benthic community 455
either in richness or in structure, contrary to other studies. Indeed, higher nutrient availability 456
may enhance algal richness and diversity (Worm et al. 2002, Korpinen et al. 2007) and increase 457
the abundance of ephemeral algae (Johansson et al. 1998, Eriksson et al. 2007, Kraufvelin et al. 458
2010) and propagules or periphyton (Eriksson et al. 2006b, Korpinen et al. 2007), leading to a 459
higher food supply for the associated community. An additional input of nutrients can modify the 460
food preference of herbivores and change their competitive interactions with grazing shifts 461
(Worm et al. 1999, Russell & Connell 2005), thereby influencing the composition within the 462
assemblage. Enrichment combined with canopy loss can lead to an increase in the abundance of 463
macroalgae (Eriksson et al. 2007), or a shift in dominance towards opportunistic species and a 464
decrease in the invertebrates that had a refuge in the canopy (Benedetti-Cecchi et al. 2001). 465
Some studies have observed an increase in the abundance of either recruits or mature macroalgae 466
with nutrient enrichment when grazers were reduced (Guerry 2008, Masterson et al. 2008, Atalah 467
& Crowe 2012). Others have shown that under nutrient-enriched conditions and in the absence of 468
grazers, Fucus spp. failed to colonize the substrate and were outcompeted by fast-growing 469
ephemeral algae; with grazers present, the opportunistic algae were less abundant (Korpinen et 470
al. 2007, Korpinen & Jormamailen 2008). Neither of these observations was found in our study. 471
A delayed community response to nutrient input is possible. Kraufvelin et al. (2006) and Bokn et 472
al. (2002) observed a delayed response (16 mo to 3 yr) of fucoid species to enrichment even 473
though rapid (within a few months), relatively minor effects on the community structure were 474
detected (increase of Ulva spp. and some grazers). 475
Although the grazer reduction treatment had almost no effect on our community 476
abundance structure, when combined with the canopy treatment we observed, at the end of the 477
experiment, a trend of larger differences with the controls than that observed using only single 478
treatments (cf. Fig. 5). This suggests that multiple disturbances and stresses may act in synergy 479
leading to stronger effects than when applied alone. This highlights the need to analyze 480
interactions among treatments, as they might be important in field situations, and likewise, to 481
allow enough time to pass for these treatments to take effect. 482
Effects on ecosystem functioning
483It is known that macroalgae primary production can be positively affected by nutrient 484
additions (Ylla et al. 2007, Bucolo et al. 2008, Krause-Jensen et al. 2012, but not in Kraufvelin et 485
al. 2010). Still, we did not find an enrichment effect on primary production. If a higher storage 486
of nutrients was observed, primary production measures were not significantly higher with 487
enrichment. On the other hand, we did observe a strong negative effect of canopy loss on GPP. 488
With a community affected by canopy loss, changes in functioning were expected through lower 489
abundance and low productivity of the understorey community (Gollety et al. 2008, Tait & 490
Schiel 2011b, Valdivia et al. 2012, Crowe et al. 2013). In our study, only R. clavata was present 491
as crustose algae and its production was probably not sufficient to compensate for the respiration 492
of other heterotrophic organisms present. The lack of increasing ephemeral algae led to a non-493
significant increase in total abundance and richness of understorey algae for enriched plots (data 494
not shown), resulting in no increase in productivity. Higher diversity may lead to higher 495
productivity in many systems (Naeem et al. 1994); however, some studies in shallow marine 496
habitat systems have shown no increase in primary production with enrichment due to changes in 497
the macrophyte community (Sandjensen & Borum 1991, Nixon et al. 2001). 498
CONCLUSIONS
499In response to different disturbance or stress sources, a community may resist, or fail and 500
change. The benthic communities in our study were not resistant to canopy loss, leading to 501
significant changes in community structure and composition. Our study reconfirms the important 502
role of the dominant habitat-forming species Fucus spp. in influencing the structure and function 503
of their associated communities. Following enrichment and grazer reduction, the marine benthic 504
communities of the mid-intertidal zone of the St. Lawrence Estuary remained largely unaffected. 505
Grazer reduction combined with other treatments provoked various responses with effects on the 506
structure in terms of abundance (both % cover and biomass) but with little or no effect on 507
richness, diversity and total abundances. Therefore, in this assemblage, habitat-forming species 508
have a stronger effect than bottom-up forcing and top-down controls. Moreover, our study also 509
provided new insight into possible interactions among treatments, highlighting the importance of 510
testing for potential synergetic or antagonistic effects of multiple stresses. Natural coastal 511
communities often face multiple threats. Therefore, understanding the antagonistic and additive 512
effects of stresses may help identify the ecological mechanisms that solicit shifts in community 513
structure and function. Studying these interactions will also help policy managers establish 514
mitigation and conservation priorities. 515
Acknowledgements. We thank S. Cimon, J. Lemieux, D. A. Gauthier, S. Lavoie, G. Grosbois and
516
G. Larocque, who helped in the field maintaining treatments throughout the course of the 517
experiment. Thanks to Dr. M. B. Hay for verifying the English. We thank 3 anonymous 518
reviewers for providing constructive comments and critiques on the final version. The project is 519
a contribution to the research program of Québec-Océan. Financial support was provided by 520
grants from FRQNT (Quebec Funds for Research in Nature and Technology, New University 521
Researchers Start-up Program) and Natural Sciences and Engineering Research Council of 522
Canada (NSERC; Discovery Grants) to M.C. 523
LITERATURE CITED
524Åberg P (1992) A demographic study of two populations of the seaweed Ascophyllum nodosum. 525
Ecology 73:1473–1487 doi:10.2307/1940691
526
Aguilera MA, Navarrete SA (2012) Functional identity and functional structure change through 527
succession in a rocky intertidal marine herbivore assemblage. Ecology 93:75–89 PubMed
528
doi:10.1890/11-0434.1
529
Airoldi L (2003) The effects of sedimentation on rocky coast assemblages. Oceanogr Mar Biol 530
Annu Rev 41:161–236 531
Airoldi L, Beck MW (2007) Loss, status and trends for coastal marine habitats of Europe. 532
Oceanogr Mar Biol Annu Rev 45:345–405 533
Allen JR, Slinn DJ, Shammon TM, Hartnoll RG, Hawkins SJ (1998) Evidence for eutrophication 534
of the Irish sea over four decades. Limnol Oceanogr 43:1970–1974 535
Anderson MJ, Underwood AJ (1997) Effects of gastropod grazers on recruitment and succession 536
of an estuarine assemblage: a multivariate and univariate approach. Oecologia 109:442–453 537
doi:10.1007/s004420050104
538
Anderson MJ, Gorley RN, Clarke KR (2008) PERMANOVA+ for PRIMER: guide to software 539
and statistical methods. PRIMER-E, Plymouth 540
Archambault D, Bourget E (1983) Importance du régime de dénudation sur la structure et la 541
succession des communautés intertidales de substrats rocheux en milieu subarctique. Can J Fish 542
Aquat Sci 40:1278–1292 doi:10.1139/f83-146
543
Atalah J, Crowe TP (2012) Nutrient enrichment and variation in community structure on rocky 544
shores: the potential of molluscan assemblages for biomonitoring. Estuar Coast Shelf Sci 545
99:162–170 doi:10.1016/j.ecss.2011.12.034
546
Barker KM, Chapman ARO (1990) Feeding preferences of periwinkles among 4 species of 547
Fucus. Mar Biol 106:113–118 doi:10.1007/BF02114681
548
Bender EA, Case TJ, Gilpin ME (1984) Perturbation experiments in community ecology: theory 549
and practice. Ecology 65:1–13 doi:10.2307/1939452
Benedetti-Cecchi L, Pannacciulli F, Bulleri F, Moschella PS, Airoldi L, Relini G, Cinelli F 551
(2001) Predicting the consequences of anthropogenic disturbance: large-scale effects of loss of 552
canopy algae on rocky shores. Mar Ecol Prog Ser 214:137–150 doi:10.3354/meps214137
553
Bergeron P, Bourget E (1984) Effet du froid et des glaces sur les peuplements intertidaux des 554
régions nordiques, particulièrement dans l'estuaire du Saint-Laurent. Oceanis 10:279–304 555
Bertness MD, Leonard GH (1997) The role of positive interactions in communities: lessons from 556
intertidal habitats. Ecology 78:1976–1989
doi:10.1890/0012-557
9658(1997)078[1976:TROPII]2.0.CO;2
558
Bertness MD, Leonard GH, Levine JM, Schmidt PR, Ingraham AO (1999) Testing the relative 559
contribution of positive and negative interactions in rocky intertidal communities. Ecology 560
80:2711–2726 doi:10.1890/0012-9658(1999)080[2711:TTRCOP]2.0.CO;2
561
Bokn TL, Moy FE, Christie H, Engelbert S and others (2002) Are rocky shore ecosystems 562
affected by nutrient-enriched seawater? Some preliminary results from a mesocosm experiment. 563
Hydrobiologia 484:167–175 doi:10.1023/A:1021365307438
564
Brey T (2004) Empirical relations in aquatic populations. Population dynamics in benthic 565
invertebrates: a virtual handbook. Alfred-Wegener Institute, Bremerhaven 566
Brooks TM, Mittermeier RA, Mittermeier CG, da Fonseca GAB and others (2002) Habitat loss 567
and extinction in the hotspots of biodiversity. Conserv Biol 16:909–923
doi:10.1046/j.1523-568
1739.2002.00530.x
569
Bucolo P, Sullivan MJ, Zimba PV (2008) Effects of nutrient enrichment on primary production 570
and biomass of sediment microalgae in a subtropical seagrass bed. J Phycol 44:874–881 571
doi:10.1111/j.1529-8817.2008.00539.x
572
Bulleri F, Benedetti-Cecchi L, Acunto S, Cinelli F, Hawkins SJ (2002) The influence of canopy 573
algae on vertical patterns of distribution of low-shore assemblages on rocky coasts in the 574
northwest Mediterranean. J Exp Mar Biol Ecol 267:89–106 doi:10.1016/S0022-0981(01)00361-6
575
Cervin G, Lindegarth M, Viejo RM, Aberg P (2004) Effects of small-scale disturbances of 576
canopy and grazing on intertidal assemblages on the Swedish west coast. J Exp Mar Biol Ecol 577
302:35–49 doi:10.1016/j.jembe.2003.09.022
Chapman ARO, Craigie JS (1977) Seasonal growth in Laminaria longicruris: relations with 579
dissolved inorganic nutrients and internal reserves of nitrogen. Mar Biol 40:197–205 580
doi:10.1007/BF00390875
581
Clark KR, Gorley RN (2006) PRIMER v6: user manual/tutorial. PRIMER-E, Plymouth 582
Coleman RA, Underwood AJ, Benedetti-Cecchi L, Aberg P and others (2006) A continental 583
scale evaluation of the role of limpet grazing on rocky shores. Oecologia 147:556–564 PubMed
584
doi:10.1007/s00442-005-0296-9
585
Connell SD, Russell BD, Turner DJ, Shepherd SA and others (2008) Recovering a lost baseline: 586
missing kelp forests from a metropolitan coast. Mar Ecol Prog Ser 360:63–72 587
doi:10.3354/meps07526
588
Crowe TP, Frost NJ, Hawkins SJ (2011) Interactive effects of losing key grazers and ecosystem 589
engineers vary with environmental context. Mar Ecol Prog Ser 430:223–234 590
doi:10.3354/meps09023
591
Crowe TP, Cusson M, Bulleri F, Davoult D and others (2013) Large-scale variation in combined 592
impacts of canopy loss and disturbance on community structure and ecosystem functioning. 593
PLoS ONE 8:e66238 PubMeddoi:10.1371/journal.pone.0066238
594
Do VT, Blanchet H, de Montaudouin X, Lavesque N (2013) Limited consequences of seagrass 595
decline on benthic macrofauna and associated biotic indicators. Estuaries Coasts 36:795–807 596
doi:10.1007/s12237-013-9589-0
597
Duarte CM (1995) Submerged aquatic vegetation in relation to different nutrient regimes. 598
Ophelia 41:87–112 doi:10.1080/00785236.1995.10422039
599
Elton CS (1958) The ecology of invasions by animals and plants. University of Chicago Press, 600
Chicago, IL 601
Eriksson BK, Johansson G, Snoeijs P (1998) Long-term changes in the sublittoral zonation of 602
brown algae in the southern Bothnian Sea. Eur J Phycol 33:241–249 603
doi:10.1080/09670269810001736743
Eriksson BK, Rubach A, Hillebrand H (2006a) Biotic habitat complexity controls species 605
diversity and nutrient effects on net biomass production. Ecology 87:246–254 PubMed
606
doi:10.1890/05-0090
607
Eriksson BK, Rubach A, Hillebrand H (2006b) Community dominance by a canopy species 608
controls the relationship between macroalgal production and species richness. Limnol Oceanogr 609
51:1813–1818 doi:10.4319/lo.2006.51.4.1813
610
Eriksson BK, Rubach A, Hillebrand H (2007) Dominance by a canopy forming seaweed 611
modifies resource and consumer control of bloom-forming macroalgae. Oikos 116:1211–1219 612
doi:10.1111/j.0030-1299.2007.15666.x
613
Fradette P, Bourget E (1980) Ecology of benthic epifauna of the Estuary and Gulf of St. 614
Lawrence: factors influencing their distribution and abundance on buoys. Can J Fish Aquat Sci 615
37:979–999 doi:10.1139/f80-127
616
Gilbert D, Chabot D, Archambault P, Rondeau B, Hébert S (2007) Appauvrissement en oxygène 617
dans les eaux profondes du Saint-Laurent marin. Nat Can 131:67–75 618
Gollety C, Migne A, Davoult D (2008) Benthic metabolism on a sheltered rocky shore: role of 619
the canopy in the carbon budget. J Phycol 44:1146–1153 doi:10.1111/j.1529-8817.2008.00569.x
620
Grime JP (1997) Biodiversity and ecosystem function: the debate deepens. Science 277:1260– 621
1261 doi:10.1126/science.277.5330.1260
622
Grimm V, Wissel C (1997) Babel, or the ecological stability discussions: an inventory and 623
analysis of terminology and a guide for avoiding confusion. Oecologia 109:323–334 624
doi:10.1007/s004420050090
625
Grman E, Lau JA, Schoolmaster DR, Gross KL (2010) Mechanisms contributing to stability in 626
ecosystem function depend on the environmental context. Ecol Lett 13:1400–1410 PubMed
627
doi:10.1111/j.1461-0248.2010.01533.x
628
Guerry AD (2008) Interactive effects of grazing and enrichment on diversity; conceptual 629
implications of a rocky intertidal experiment. Oikos 117:1185–1196
doi:10.1111/j.0030-630
1299.2008.16531.x
<unknown>Hanski I (2005) The shrinking world: ecological consequences of habitat loss. 632
International Ecology Institute, Oldendorf/Luhe</unknown> 633
Hawkins SJ (1981) The influence of season and barnacles on the algal colonization of Patella 634
vulgata exclusion areas. J Mar Biol Assoc UK 61:1–15 doi:10.1017/S0025315400045872
635
Hawkins SJ (1983) Interactions of Patella and macroalgae with settling Semibalanus balanoides 636
(L). J Exp Mar Biol Ecol 71:55–72 doi:10.1016/0022-0981(83)90104-1
637
Hawkins SJ, Harkin E (1985) Preliminary canopy removal experiments in algal dominated 638
communities low on the shore and in the shallow subtital on the Isle of Man. Bot Mar 28:223– 639
230 doi:10.1515/botm.1985.28.6.223
640
Hawkins SJ, Hartnoll RG (1983) Grazing of intertidal algae by marine invertebrates. Oceanogr 641
Mar Biol Annu Rev 21:195–282 642
Hawkins SJ, Watson DC, Hill AS, Harding SP, Kyriakides MA, Hutchinson S, Norton TA 643
(1989) A comparison of feeding mechanisms in microphagous, herbivorous, intertidal, 644
prosobranchs in relation to resource partitioning. J Molluscan Stud 55:151–165 645
doi:10.1093/mollus/55.2.151
646
Hawkins SJ, Sugden HE, Mieszkowska N, Moore PJ and others (2009) Consequences of 647
climate-driven biodiversity changes for ecosystem functioning of North European rocky shores. 648
Mar Ecol Prog Ser 396:245–259 doi:10.3354/meps08378
649
Hooper DU, Vitousek PM (1997) The effects of plant composition and diversity on ecosystem 650
processes. Science 277:1302–1305 doi:10.1126/science.277.5330.1302
651
Hooper DU, Chapin FS, Ewel JJ, Hector A and others (2005) Effects of biodiversity on 652
ecosystem functioning: a consensus of current knowledge. Ecol Monogr 75:3–35 653
doi:10.1890/04-0922
654
Hooper DU, Adair EC, Cardinale BJ, Byrnes JEK and others (2012) A global synthesis reveals 655
biodiversity loss as a major driver of ecosystem change. Nature 486:105–108PubMed
656
Ingolfsson A (2008) The invasion of the intertidal canopy-forming alga Fucus serratus L. to 657
southwestern Iceland: possible community effects. Estuar Coast Shelf Sci 77:484–490 658
doi:10.1016/j.ecss.2007.10.006
Irving AD, Connell SD (2006) Physical disturbance by kelp abrades erect algae from the 660
understorey. Mar Ecol Prog Ser 324:127–137 doi:10.3354/meps324127
661
Jenkins SR, Hawkins SJ (2003) Barnacle larval supply to sheltered rocky shores: A limiting 662
factor? Hydrobiologia 503:143–151 doi:10.1023/B:HYDR.0000008496.68710.22
663
Jenkins SR, Hawkins SJ, Norton TA (1999a) Direct and indirect effects of a macroalgal canopy 664
and limpet grazing in structuring a sheltered inter-tidal community. Mar Ecol Prog Ser 188:81– 665
92 doi:10.3354/meps188081
666
Jenkins SR, Hawkins SJ, Norton TA (1999b) Interaction between a fucoid canopy and limpet 667
grazing in structuring a low shore intertidal community. J Exp Mar Biol Ecol 233:41–63 668
doi:10.1016/S0022-0981(98)00128-2
669
Jenkins SR, Hawkins SJ, Norton TA (1999c) Interaction between a fucoid canopy and limpet 670
grazingin structuring a low shore intertidal community. J Exp Mar Biol Ecol 233:41–63 671
doi:10.1016/S0022-0981(98)00128-2
672
Jenkins SR, Coleman RA, Della Santina P, Hawkins SJ, Burrows MT, Hartnoll RG (2005) 673
Regional scale differences in the determinism of grazing effects in the rocky intertidal. Mar Ecol 674
Prog Ser 287:77–86 doi:10.3354/meps287077
675
Jochum M, Schneider FD, Crowe TP, Brose U, O’Gorman EJ (2012) Climate-induced changes 676
in bottom-up and top-down processes independently alter a marine ecosystem. Philos Trans R 677
Soc Lond B Biol Sci 367:2962–2970 PubMeddoi:10.1098/rstb.2012.0237
678
Johansson G, Eriksson BK, Pedersen M, Snoeijs P (1998) Long-term changes of macroalgal 679
vegetation in the Skagerrak area. Hydrobiologia 385:121–138 doi:10.1023/A:1003405826222
680
Jones CG, Lawton JH, Shachak M (1994) Organisms as ecosystem engineers. Oikos 69:373–386 681
doi:10.2307/3545850
682
Kiirikki M (1996) Experimental evidence that Fucus vesiculosus (Phaeophyta) controls 683
filamentous algae by means of the whiplash effect. Eur J Phycol 31:61–66 684
doi:10.1080/09670269600651201
685
Kim JH, DeWreede RE (1996) Effects of size and season of disturbance on algal patch recovery 686
in a rocky intertidal community. Mar Ecol Prog Ser 133:217–228 doi:10.3354/meps133217
Korpinen S, Jormamailen V (2008) Grazing and nutrients reduce recruitment success of Fucus 688
vesiculosus L. (Fucales: Phaeophyceae). Estuar Coast Shelf Sci 78:437–444
689
doi:10.1016/j.ecss.2008.01.005
690
Korpinen S, Jormalainen V, Honkanen T (2007) Effects of nutrients, herbivory and depth on the 691
macroalgal community in the rocky sublittoral. Ecology 88:839–852 PubMed
doi:10.1890/05-692
0144
693
Kraufvelin P, Moy FE, Christie H, Bokn TL (2006) Nutrient addition to experimental rocky 694
shore communities revisited: delayed responses, rapid recovery. Ecosystems 9:1076–1093 695
doi:10.1007/s10021-005-0188-1
696
Kraufvelin P, Lindholm A, Pedersen MF, Kirkerud LA, Bonsdorff E (2010) Biomass, diversity 697
and production of rocky shore macroalgae at two nutrient enrichment and wave action levels. 698
Mar Biol 157:29–47 doi:10.1007/s00227-009-1293-z
699
Krause-Jensen D, Markager S, Dalsgaard T (2012) Benthic and pelagic primary production in 700
different nutrient regimes. Estuaries Coasts 35:527–545 doi:10.1007/s12237-011-9443-1
701
Lamote M, Johnson LE (2008) Temporal and spatial variation in the early recruitment of fucoid 702
algae: the role of microhabitats and temporal scales. Mar Ecol Prog Ser 368:93–102 703
doi:10.3354/meps07592
704
Laurand S, Riera P (2006) Trophic ecology of the supralittoral rocky shore (Roscoff, France): a 705
dual stable isotope (δ13C, δ15N) and experimental approach. J Sea Res 56:27–36
706
doi:10.1016/j.seares.2006.03.002
707
Lehman CL, Tilman D (2000) Biodiversity, stability, and productivity in competitive 708
communities. Am Nat 156:534–552 doi:10.1086/303402
709
Lewis JR (1964) The ecology of rocky shores. English University Press, London 710
Lilley SA, Schiel DR (2006) Community effects following the deletion of a habitat-forming alga 711
from rocky marine shores. Oecologia 148:672–681 PubMeddoi:10.1007/s00442-006-0411-6
712
Loreau M, Naeem S, Inchausti P (2002) Biodiversity and ecosystem functioning: synthesis and 713
perspectives. Oxford University Press, New York, NY 714
Lubchenco J (1983) Littorina and Fucus: effects of herbivores, substratum heterogeneity, and 715
plant escapes during succession. Ecology 64:1116–1123 doi:10.2307/1937822
716
MacArthur R (1955) Fluctuations of animal populations and a measure of community stability. 717
Ecology 36:533–536 doi:10.2307/1929601
718
Maggi E, Bertocci I, Vaselli S, Benedetti-Cecchi L (2009) Effects of changes in number, identity 719
and abundance of habitat-forming species on assemblages of rocky seashores. Mar Ecol Prog Ser 720
381:39–49 doi:10.3354/meps07949
721
Martins GM, Thompson RC, Neto AI, Hawkins SJ, Jenkins SR (2010) Exploitation of intertidal 722
grazers as a driver of community divergence. J Appl Ecol 47:1282–1289
doi:10.1111/j.1365-723
2664.2010.01876.x
724
Masterson P, Arenas FA, Thompson RC, Jenkins SR (2008) Interaction of top down and bottom 725
up factors in intertidal rockpools: effects on early successional macroalgal community 726
composition, abundance and productivity. J Exp Mar Biol Ecol 363:12–20 727
doi:10.1016/j.jembe.2008.06.001
728
McCook LJ, Chapman ARO (1993) Community succession following massive ice-scour on a 729
rocky intertidal shore: recruitment, competition and predation during early, primary succession. 730
Mar Biol 115:565–575 doi:10.1007/BF00349363
731
McKindsey CW, Bourget E (2001) Diversity of a northern rocky intertidal community: the 732
influence of body size and succession. Ecology 82:3462–3478
doi:10.1890/0012-733
9658(2001)082[3462:DOANRI]2.0.CO;2
734
McNeely JA (1992) The sinking ark: pollution and the worldwide loss of biodiversity. Biodivers 735
Conserv 1:2–18 doi:10.1007/BF00700247
736
Migné A, Davoult D, Spilmont N, Menu D, Boucher G, Gattuso JP, Rybarczyk H (2002) A 737
closed-chamber CO2-flux method for estimating intertidal primary production and respiration
738
under emersed conditions. Mar Biol 140:865–869 doi:10.1007/s00227-001-0741-1
739
Montgomery DC, Mastrangelo CM (1991) Some statistical process-control methods for
740
autocorrelated data-response. J Qual Tech 23:203–204 741
Naeem S, Thompson LJ, Lawler SP, Lawton JH, Woodfin RM (1994) Declining biodiversity can 742
alter the performance of ecosystems. Nature 368:734–736 doi:10.1038/368734a0
743
Nixon S, Buckley B, Granger S, Bintz J (2001) Responses of very shallow marine ecosystems to 744
nutrient enrichment. Hum Ecol Risk Assess 7:1457–1481 doi:10.1080/20018091095131
745
Oleksyn J, Reich PB (1994) Pollution, habitat destruction and biodiversity in Poland. Conserv 746
Biol 8:943–960 doi:10.1046/j.1523-1739.1994.08040943.x
747
Paerl HW (1997) Coastal eutrophication and harmful algal blooms: importance of atmospheric 748
deposition and groundwater as ‘new’ nitrogen and other nutrient sources. Limnol Oceanogr 749
42:1154–1165 doi:10.4319/lo.1997.42.5_part_2.1154
750
Pillay D, Branch GM, Griffiths CL, Williams C, Prinsloo A (2010) Ecosystem change in a South 751
African marine reserve (1960–2009): role of seagrass loss and anthropogenic disturbance. Mar 752
Ecol Prog Ser 415:35–48 doi:10.3354/meps08733
753
Pimm SL (1984) The complexity and stability of ecosystems. Nature 307:321–326 754
doi:10.1038/307321a0
755
Pimm SL (1991) The balance of nature? Ecological issues in the conservation of species and 756
communities. University of Chicago Press, Chicago, IL 757
Quinn G, Keough M (2002) Experimental design and data analysis for biologists. Cambridge 758
University Press, Cambridge 759
Rabouille C, Mackenzie FT, Ver LM (2001) Influence of the human perturbation on carbon, 760
nitrogen, and oxygen biogeochemical cycles in the global coastal ocean. Geochim Cosmochim 761
Acta 65:3615–3641 doi:10.1016/S0016-7037(01)00760-8
762
Raffaelli D, Hawkins S (1996) Intertidal ecology. Kluwer Academic Publishers, Dordrecht 763
Range P, Chapman MG, Underwood AJ (2008) Field experiments with ‘cageless’ methods to 764
manipulate grazing gastropods on intertidal rocky shores. J Exp Mar Biol Ecol 365:23–30 765
doi:10.1016/j.jembe.2008.07.031
766
Reed DC, Foster MS (1984) The effects of canopy shading on algal recruitment and growth in a 767
giant kelp forest. Ecology 65:937–948 doi:10.2307/1938066