RURAL CONNECTIVITY IN LATIN
AMERICA AND THE CARIBBEAN
A BRIDGE FOR SUSTAINABLE DEVELOPMENT
IN A TIME OF PANDEMIC
1
3
38 33 31 10 6Executive Summary
About the authors
Preface
The state of connectivity in Latin America and the
Caribbean and the re-dimensioning of the problem
of access limits in rural areas
3.1
Latin America and the Caribbean advance
in developing a digital ecosystem, but have tasks pending
3.2
The problem of connectivity access
3.3
Connectivity as a priority during the COVID-19 crisis
11 31
2
21 27 29 24 19 18 16The Rural Significant Connectivity Index (RSCI) for Latin
America and the Caribbean
2.1
Conceptual Framework for Significance of Connectivity
2.2
Estimation of the Significant Connectivity Index
2.3
Rural (ICSr) and Urban (ICSu) Significant Connectivity Index
2.4
Analysis of Results according to Dimensions
of the Significant Rural Connectivity Index
2.5
Extrapolation of results to other Latin American
and Caribbean countries
6
7
Conclusions
Recommendations
5
71 71 73 82 85 77Current strategies and solutions to reduce the coverage
gap in rural areas
5.1
Public-Private Partnerships
5.2
Endogenous Alternatives of Communities
5.3
Public
Sector Partnerships and International
Cooperation
4
44 44 46 50 48 54 62Characteristics of the digital divide in rural areas:
key problems identified
4.1
The absence of data to characterize the rural
connectivity situation
4.2
Limitations of the incentives (universal access funds)
used to promote connectivity in remote territories
4.3
Socioeconomic difficulties and disincentives
for investment
4.4
The large number of sectors involved and the need
for coordination to close the connectivity gap
4.5
The aggregation of gaps in rural areas: women’s access
to connectivity
4.6
Aggregation of gaps in rural areas: Internet access
in the home and at school
Annexes
Annex I
Annex II
Connectivity plans, regulatory frameworks, rural
connectivity policies and specific measures in response to
COVID- 19, by country, year 2020
Annex III
IICA’s experiences and initiatives in matters
related to rural connectivity, digital inclusion and
Agriculture 4.0
Annex IV
List of interviewees
96 99 96 116 111 89 95
Online databases consulted
Bibliography
The imperative of inclusion
The spread of Covid-19 (CV), declared a pandemic by the World Health Orga-nization (WHO), and the containment measures implemented to limit infections, have forced a large number of people to modify many of their daily activities in order to quarantine at home. Quarantine measures and the sudden need to digitalize many activities, such as work, education and trade, were met with the reality of the Region, which is characterized by the following:
• A large portion of the population is not connected to the Internet and a significant part of the population that is connected faces quality and cost issues.
• Half of the countries in the region do not have Digital Agendas.
• Only 7% of government-related paperwork can be completed online.
• 60% of countries do not possess cybersecurity strategies.
• Only 1 country in the region has implemented the Digital Medical Record.
• Devices to access the internet are limited (smartphone penetration is 69%, while computer penetration is 65.7%).
• 50% of the population lacks access to a bank account or debit card.
During this period of social isolation, those with internet access have been able to continue accessing various services using digital tools. However, it is clear that disparities with respect to connectivity can widen gaps in welfare indicators.
Preface
-Manuel Otero
Director General of the Inter-American Institute for Cooperation on Agriculture (IICA)
Marcelo Cabrol
Manager of the Social Sector
at the Inter-American Development Bank
Moisés Schwartz Rosenthal
Manager of the Institutions for Development Sector
at the Inter-American Development Bank
Juan Pablo Bonilla
Manager of the Climate Change and Sustainable Development Sector at the Inter-American Development Bank
1
2
1 The World Health Organization regularly updates a map that compiles the main data available on CV cases and deaths in the Americas, which is available at: https://who.maps.arcgis.com/apps/webappviewer/index.html?id=2203b04c3a5f486685a15482a0d97a87&extent=-17277700 .8881%2C-1043174.5225%2C-1770156.5897%2C6979655.9663%2C102100
WHO characterizes COVID-19 as a pandemic. Pan American Health Organization (PAHO). Available at: https://www.paho.org/hq/index.php?op-tion=com_content&view=article&id=15756:who-characterizes-covid-19-as-a-pandemic&Itemid=1926&lang=en
2 1
To reduce the digital gap and drive the development of the digital economy, our region will need to overcome the following challenges: (i) outdated regulatory frameworks that must evolve by incorporating the various dimensions involved in the development of a digital economy, (ii) the need to expand the coverage of Internet services through a greater deployment of infrastructure that provi-des the entire population with access to quality and affordable services, (iii)
the improvement of institutional framework and governance models to facilitate public-private coordination with the ultimate goal of guaranteeing the sustai-nability of solutions, and, of course, (iv) the need to develop digital skills that would allow for capitalizing on digital infrastructure and solutions to improve the quality of life of citizens and the efficiency with which governments provide public services.
The enormous production gaps as well as technological and institutional short-comings undoubtedly stand out as the main obstacles to developing a digital economy in the region and, among other things, the productive development of strategic sectors such as agriculture and rural areas.
Recognition of this issue gave rise to the journey that IICA’s General Directorate em-barked on with the organization’s 34 member countries at the start of 2018, placing technology and innovation at the core of its technical cooperation activities.
This first step in planning an effective response is captured in IICA’s new institu-tional roadmap: its 2018-2022 Medium-Term Plan (MTP), which establishes the need to create a new paradigm regarding the role of rural territories, by abando-ning the vision that casts them as generators of poverty and internal migration. The new focus, IICA’s navigational chart for providing technical cooperation, see-ks to reposition rural territories as areas that have great potential for progress and prosperity – an ambitious objective that requires solid production linkages, based on access to services, technology and adequate levels of connectivity, while abiding by environmental and social inclusion goals.
As an organization of the Inter-American system specialized in promoting agricultural development and rural well-being, IICA has, in its nearly 80-year history, been able to identify challenges and opportunities and, fundamentally, evolve to better respond to new demands.
IICA’s technical cooperation is based on the principles of efficiency and exce-llence, and its work, in close collaboration with its 34 Member States, is cha-racterized by first listening and understanding their needs and then taking appropriate action to address them.
The institution is committed to achieving results based on a technical coope-ration model that is constantly updated, and has been a vehicle for the positive transformation of the agriculture and rural sectors.
Evolving in order to continue this transformation process implies recognizing new and pressing needs.
Against this backdrop, IICA is mobilizing itself to focus its efforts on reducing the multiple gaps that are hindering agricultural transformation in the hemis-phere, and therefore need to be corrected.
Similarly, the Inter-American Development Bank (IDB), cognizant of the impact that the development of digital infrastructure would have on economic and social development in Latin America and the Caribbean, has been supporting countries throughout the region in establishing the necessary framework to develop inclusive and equitable digital agendas. Efforts in this regard have focused on: (i) the deployment of digital infrastructure to improve connectivity in rural areas and public venues, (ii) the development of digital skills with the ultimate goal of fostering the adoption and use of various technological solutions and digital services, for which inclusive capacity-building will be crucial, (iii) updating of the regulatory framework with the goal of strengthening the digital economy, and (iv) the development and strengthening of institutional frameworks and governance models that facilitate interinstitutional coordination and the participation of the private and academic sectors as well as civil society. According to ECLAC, there is a significant connectivity divide between urban and rural areas. In the region, 67% of urban households are connected to the Internet, compared to just 23% of rural households. In some countries, such as Bolivia, El Salvador, Paraguay and Peru, more than 90% of rural households do not have an internet connection. In countries that are better-off in this regard, such as Chile, Costa Rica and Uruguay, only about half of rural households are connected. The differences with respect to connectivity generate distinct disadvantages that explain the relatively lower level of well-being in rural territories and the persistent poverty that affects a significant portion of the rural population. These disadvantages are further compounded by the problems of limited ac-cess to markets and productive resources such as water, land and financing. The handicaps reach a point that is truly unacceptable when inadequate physi-cal connectivity and telecommunications isolates these areas from access to knowledge and innovation, which in turn fuels problems that extend far beyond the rural environment.
Within this context, connecting rural households is a crucial measure to address the health and economic crisis. Technologies enable the population to continue participating in economic activities and accessing key services, including work-from-home, distance learning and telemedicine.
This document, which is the result of close collaboration between the IDB, IICA and Microsoft, is in itself a great contribution, by identifying and attempting to quantify the true extent and implications of this limited connectivity.
To this end, an interdisciplinary, collaborative effort allowed us to create the Substantial Rural Connectivity Index (SRCi) and Substantial Urban Connectivity Index (SUCi) to examine the core factors impeding or hindering the large-scale dissemination of improved telecommunications services in Latin America and the Caribbean.
In this vein, the document highlights the social and production implications of connectivity as a driving force for inclusion and productivity, as well as for inclusion and economic support once the health crisis is over.
In practical terms, and specifically in the agriculture sector, reducing gaps in rural connectivity would enhance the transfer of technology, with the aim of raising crop production levels in regions that are severely disadvantaged; ex-panding access to social services such as education and health; increasing transparency in production chains with fairer prices for producers; and ensuring the decisive inclusion of women and youth in the productive processes, thus driving rural development.
In view of the foregoing, the authors of this document underscore the strategic importance of digital infrastructure as a catalyst for equitable productive deve-lopment and inclusion.
They also reiterate their commitment to continuing to explore this issue of key importance for the digital development of our societies and economies, confident that expanding rural connectivity will contribute directly to sustainable development.
ABOUT THE AUTHORS
Sandra Ziegler
is a Doctor of Social Sciences and a Master of Social Sciences in Education from the Latin American School of Social Sciences (FLACSO, head-quartered in Argentina). She holds a Bachelor’s degree in Education Sciences from the University of Buenos Aires (UBA).Currently, she is an Associate Professor in the Faculty of Exact and Natural Scien-ces (UBA) and a Chief Researcher in the Area of Education at FLACSO Argentina, where she directs the Master of Social Sciences in Education program.
Joaquín Arias Segura
earned his Baccalaureate and Bachelor’s degree at theUniversity of Costa Rica, and a M.Sc and PhD in Agricultural Economics at the Oklahoma State University (USA). Since July 2019, he has been the International Technical Specialist at the Center for Strategic Analysis for Agriculture (CAES-PA) of the Inter-American Institute for Cooperation on Agriculture (IICA), with offices in Panama. Previously, he was a policy and trade analyst at IICA, with offices in Costa Rica, Peru and Washington, DC.
Matías Bosio
holds a Bachelor’s degree in Agronomy (University of Buenos Ai-res, UBA). He is an Assistant Professor in the Faculty of Agronomy (UBA). He is a consultant for international cooperation organizations (FAO, UNEP, UNDP, OAS, IICA) as well as with the public and private sectors and civil society organizations.Kemly Camacho
is an engineer in Computer Science (Costa Rica Institute ofTechnology) and Anthropology (University of Costa Rica), She holds a Master’s degree in Knowledge Society and in Evaluation of Development Programs and Projects (Open University of Catalonia). She is a researcher and professor at the University of Costa Rica and the Costa Rican Institute of Technology, and also as a Vice President of the Board of Directors of the Chamber of Information and Communication Technologies (CAMTIC, Costa Rica).
3
3 Acknowledgements:The authors wish to thank Mariana Alfonso, Maldiery Altagracia, Elena Arias Ortiz, Luciano Braverman, Antonio García Zaballos, Guido Nejamkis, Marcelo Pérez Alfaro, Eugenia Salazar, Eduardo Trigo, Federico Villareal, Jorge Werthein and Pablo Zoido Lobaton for their critical reading and contributions to this document.
All the members of the IICA offices who provided institutional material to enrich this document. Ignacio Hernaiz who provided key information on the partnerships between the public sector and international cooperation.
The world is experiencing a huge transformation in the field of information and communication, driven by an unprecedented technological revolution.
Within this context, digitization affords endless possibilities that impact various areas of human activity that are increasingly dependent on information and communication technology.
These technologies generate opportunities to advance development and boost knowledge creation. Simultaneously, they present challenges that must be ad-dressed to avoid widening the gaps that exist in advanced economies, between urban and rural areas, and between the different productive sectors, and to move towards democratizing their access and use.
Currently, the Covid-19 crisis requires us to undertake some initiatives that will help to reduce the digital gap in Latin America and the Caribbean.
This situation leads us to consider the potential of promoting connectivity at this time, and the necessary downsizing of the problem in terms of obstacles that prevent it from reaching rural areas.
EXECUTIVE SUMMARY
1
44 The current study condenses the joint work between IICA, IDB and Microsoft, with the aim of producing a document that compiles
and produces information on the state of rural connectivity in LAC. Given the lack of official statistical data available, an effort was made to compile different sources of information as well as create instruments and an index that facilitates the creation of an approximation of the problem at hand. Likewise, the study was complemented by a series of 39 semi-structured interviews applied to different profiles within the countries, with the aim of advancing knowledge on the state of affairs regarding rural connectivity. Annex IV of the document provides a detailed list of the interviewees. The information used in preparing this document was information available as at 24 September 2020.
Promoting connectivity therefore is an indispensable priority to facilitate the de-velopment of all productive, social and communal aspects of life in rural areas. Technological transformations and their use in rural-area production, and the re-sulting economic benefits they generate, require supportive policies and initiati-ves to bridge the rural connectivity gap.
Technological change in rural areas has helped to increase crop productivity le-vels in the most underdeveloped regions ; and thus, connectivity has great poten-tial to contribute to price transparency in the production chain, for example, and to facilitate the inclusion of women and youth in production processes. In short, improved connectivity could offset the vicious circle that is currently creating insecurity, poverty and migration.
This document advances towards proposing a method of calculation to identify urban-rural connectivity gaps as one of the basic components of the digital divi-de; as such, it represents a starting point for laying out the actions necessary for expanding quality service for greater digital equity among people and between rural areas and cities. Furthermore, it brings together information that aims to measure the extent of these gaps, using reports developed for the region and taking into consideration the diverse data sources on households and persons.
The Substantial Rural Connectivity Index (SRCi) and Substantial Urban Connectivity Index (SUCi) were formed to obtain information between countries and between urban and rural areas; these indices would measure the quality of connectivity, based on information available in official statistics and on other existing indices (Broadband Index of the Inter-American Development Bank, IDB; the Mobile Connectivity Index, Group Special Mobile Association (GSMA); and the General Connectivity Index, used by the International Telecommunications Union (ITU).
Based on the study’s conclusion, a total of approximately 77 million rural dwellers across 24 Latin American and Caribbean countries do not have connectivity at the necessary minimum standards of quality, according to the concept of Signi-ficant Connectivity, as shared in this study. Seventy-one percent of the urban po-pulation has significant connectivity, while for rural popo-pulations the percentage drops to 36.8%, a gap of 34 percentage points. It is worth noting that not only is it crucial to have connectivity, but that connectivity should be of sufficient quality to provide educational, medical, or any other type of public service. In short, the goal of connectivity is just as important as that of quality.
5
The productivity gap between countries within LAC is 10:1 (IDB, 2016). https://publications.iadb.org/publications/spanish/ document/Innovaci%C3%B3n-y-productividad-en-las-empresas-en-Am%C3%A9rica-Latina-y-el-Caribe-El-motor-del-desarrollo-econ%C3%B3mico-(Resumen).pdf
•
With regard to difficulties in infrastructure, the following must be undersco-red: obstacles to the use of the universal access funds; installation problems due to the infrastructure of countries (lack of electricity, the state of roadways, etc.); elevated investment costs and less cost effectiveness for operating com-panies; scarcity of incentives to boost rural investment; inaccessibility of the most remote areas, whether due to geography or violence in the region; lack of affordability to access devices and the huge cost of mobile phone services and internet for rural residents; the existence of obsolete regulatory frameworks; and the absence of infrastructure maps with information on telecommunica-tion networks, which would allow us to identify areas without coverage and potentially connect them quickly.It is important to highlight the following core problems of the
rural digital divide in the region:
• Currently, half of Latin American countries have specific ways to measure rural connectivity (Bolivia, Brazil, Colombia, Costa Rica, Chile, Ecuador, El Salvador, Honduras, the Dominican Republic, Mexico, Paraguay, Peru and Uruguay). The cause of the scarcity of available data is that official statis-tics do not capture information that differentiates connectivity between ur-ban and rural areas. Formulating global goals that focus on disadvantaged territories requires increased efforts for this crucial coverage.
•
Limited information restricts not only the ability to measure existing gaps in rural connectivity, but also the possibility of creating a situation that facilitates evidence-based formulation of related public policies.•
There are a series of factors that are impeding increased connectivity and its introduction to more remote and far-flung areas.Overcoming the rural connectivity gap requires both coherent public policies and private sector participation to resolve the current state of affairs. Regio-nal countries continue to require sizeable investments in infrastructure; there is also a need to generate new mechanisms and regulations to drive private sector investment and thus promote the arrival of quality connectivity in rural areas.
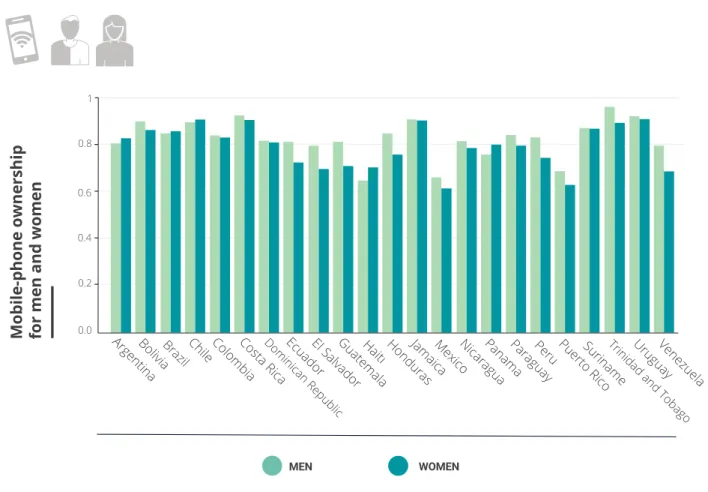
Women represent a group that experiences an aggregation of gaps. According to GSMA, in a study of five regional countries (Argentina, Brazil, Dominican Republic, Guatemala and Mexico), 86% of women own a cellular phone and 31 million women are still not connected. There is heterogeneity between countries, some of which (such as Argentina and Brazil) have almost achieved gender equality with respect to mobile phone ownership since 2010, while others (such as Guatemala and Peru) are lagging behind in this regard. On the other hand, in countries like Chile and Uruguay, the female-to-male ratio tends to favor the latter group (IICA, University of Oxford, IDB and IFAD, 2020). Even though there is no specific rural sector data for the region as a whole, estimates exist that suggest that being a woman, living in rural areas, being illiterate, having a low level of schooling and being older than 45 years are characteristics that are largely associated with disconnection. Women’s access to a mobile phone and its use under equitable conditions is a goal that will yield opportunities for development and well-being.
In Latin America, a mere 33% of schools have access to broadband or sufficient internet speed; this is less than half the reported average in OECD countries (IDB, 2020). In the case of rural areas, in 8 out of 10 regional countries analyzed for the availability of information, less than 15% of rural schools have access to sufficient broadband or internet speed (CIMA-IDB, 2020).
The study reveals three alternative models that are present in the rural areas where coverage currently reaches. These are public-private partnerships, endo-genous community-based alternatives, and collaborative frameworks between the public sector and international cooperation. With respect to the endoge-nous alternatives, there is visibly a significant presence of local small-scale providers offering connectivity in rural areas, and in many cases, these are under-registered in official statistics.
Correcting rural connectivity gaps in the immediate future is a core challenge, considering that the recession caused by the COVID-19 pandemic is the largest pandemic recorded in the history of Latin America and the Caribbean. It is pro-jected that the 2020 Gross Domestic Product will collapse and will contract be-tween 7.2% (World Bank) and 9.1% (ECLAC). This crisis, inherently unequal, will increase the number of persons below the poverty line from 185 to 231 million, while those in extreme poverty will move from 68 to 96 million (around 15% of
the population, according to ECLAC). This implies a considerable challenge for rurality, a territorial space with enormous importance for production and deve-lopment that requires innovation and technology for regional economies to add value to their products and tackle the food problem.
Improving and investing in connectivity is an approach that will favor countries’ economic growth. Evidence exists that shows a positive link between infrastruc-ture use and Gross Domestic Product (GDP). In developed countries, the addi-tion of 10 broadband lines for every 100 persons will increase GDP by 1.38%, and in developing countries by 1.21 percentage points. On the other hand, the impact of mobile internet access is estimated at 0.11% per year for developing countries, and 0.20% for developed countries .
6
6
Various authors cited by Koutroumpis, Pantelis (2019). What is the impact of investing in connectivity? CDC Investment works. Available at : https://assets.cdcgroup.com/wp-content/uploads/2019/08/28153456/The-Impact-of-Connectivity_28082019.pdf
The Rural Significant Connectivity Index (RSCI)
for Latin America and the Caribbean
2
Connectivity is a factor of growing importance for sustainable development that permeates all human activities, with significant impacts on economic growth patterns, social inclusion and environmental sustainability (Zaballos and Iglesias, 2019).
In general, the collection of connectivity data in Latin America and the Carib-bean is done at the national level without differentiating between urban and rural areas. To date, several indexes have been developed to analyze the state and evolution of connectivity in Latin America and the Caribbean, such as the Information and Communication Technologies Development Index (IDI), de-veloped by the International Telecommunications Union, the IDB’s Broadband Development Index (BDI) and the Global System for Mobile Communications (GSMA) Mobile Connectivity Index (MCI)
These indexes are an important source of connectivity analysis, but unfortunate-ly do not provide information that is stratified by rural and urban areas. Accurate, specific and strategic information is fundamental and necessary for the imple-mentation of effective and differentiated public policies aimed at improving con-nectivity in rural areas of Latin America and the Caribbean. This study proposes an approach based on the quality and frequency of access to digital services and content by rural and urban populations. This made it possible to calculate the gaps in urban-rural connectivity, as one of the fundamental components of the digital divide, which, although not the only one, is a starting point for establishing the actions needed to expand quality services for greater digital equity among people and among geographic areas.
Regular use of the Internet: Takes into account whether people have regular and consistent access to the Internet.
Appropriate device: Verifies that people have the necessary devices to connect when necessary.
Sufficient data: Verifies that people have access to sufficient data to carry out daily activities on an ongoing basis.
Adequate connection speed: Verifies that the connection speed is sufficient for meeting the demand.
1
2
3
4
Conceptual Framework for Significance of Connectivity
2.1
Connectivity is a complex and multifactorial phenomenon that must be evaluated not only on the basis of people’s ability to access the Internet with a device, but also considering whether their basic needs are met according to the standards of the digital age in which we live. The concept of Significant Connectivity, recently proposed by the Alliance for an Accessible Internet (A4AI) brings together the necessary elements to address a basic analysis of the quality of connectivity that not only considers whether a person has access to the Internet, but also the regularity and quality of the connection they have. This concept of Significant Connectivity is based on 4 pillars or essential dimensions, and defines minimum standards for its analysis:
These standards establish an appropriate approach to connectivity that make it possible to measure people’s actual ability to access the Internet and make full use of it, with the appropriate frequency, speed and devices for meeting the demands of the moment.
Estimation of the Significant Connectivity Index
2.2
In order to obtain comparative information between countries and between urban and rural areas, the Rural Significant Connectivity Index (ICSr) and the Urban Significant Connectivity Index (ICSu) were estimated, by combining the following indicators for each of the features identified for Significant Connectivity:
Regular Use of the Internet
Indicator:Percentage ofpopulation with daily Internet use
Source: National Information
and Communication Technology (ICT) Statistics available from ongoing annual household surveys
Suitable devices
Indicator: Average percentage of population with access to mobile devices (smart phones) and percentage of individuals with access to a personal computer (PC), laptop or tablet.
Source: National ICT Statistics
obtai-ned from ongoing household surveys.
Adequate data
Indicator: Percentage of popula-tion with access to fixed broadband.
Source: National ICT Statistics
obtained from ongoing household surveys.
Sufficient speed
Indicator: Percentage of population with 4G technology coverageSource: Taken from indicator
9.c.1 of the Sustainable Development Goals (SDG) .
8
8
UNDESA Statistics Division - Indicator 9.c.1 Objetivos de Desarrollo Sostenible. En http://www.sdg.org/search?categories=-goal%209
This last indicator of 4G technology coverage is available only on a national and ur-ban scale at the time of this study, but not for rural areas. Therefore, an adjustment factor was used to obtain rural 4G coverage.
The calculation of the adjustment factor was done via two procedures. First, those antennas identified as 4G technology were selected from the geographic database of mobile signal antennas, according to country. The second step was to calculate the number of 4G antennas in rural areas, using information from the Global Hu-man Settlement Layer (GHSL) developed by the European Union’s Joint Research Commission (JRC). The GHSL classifies the world territory, in a grid with cells of 1 km2, according to the population density of each cell and the adjacent cells. In this way, 4 characteristic types are obtained:
1
2
3
4
High Density Cluster (HDC):Represents urban centers.
Low Density Cluster (LDC): Represents Towns and Suburbs.
Rural Area (RUR): Represents small rural villages or scattered populations.
Uninhabited areas: Areas not inhabited or with very dispersed populations.
The number and percentage of rural 4G antennas was obtained from the LDC, RUR and uninhabited areas. With this indicator, the available data on 4G coverage at the national level was adjusted to obtain the percentage of 4G technology co-verage at the rural level, which is the fourth indicator used to estimate the Rural Significant Connectivity Index.
The values for each indicator were adjusted to a common basis of comparison to correspond to percentages with respect to populations in rural or urban areas. Countries included in the analysis: The analysis was conducted for seven countries (Bolivia, Brazil, Costa Rica, Ecuador, Honduras, Paraguay, Peru) that had, at the time of this study, available data for rural areas with the required emphasis on quality aspects that are part of the concept of significant connectivity.
9 Global Human Settlements Layers, Settlement GRID (2016). In https://ec.europa.eu/jrc/en 9
As will be discussed in section 3.2 on the issues of connectivity access, the available information has limitations and gaps in addressing the issue of sig-nificant rural connectivity in all the countries of the region, and it is therefore an objective of this study to propose, for the selected countries, a starting point for making extrapolations to the rest of the countries of Latin America and the Caribbean, and for extending the analysis in the near future.
With respect to the period of analysis, the temporary nature of the available in-formation made it possible to estimate the Index of Significant Rural Connec-tivity as of 2017 and, consequently, the corresponding indices at the national and urban levels.
Rural (ICSr) and Urban (ICSu) Significant Connectivity Index
2.3
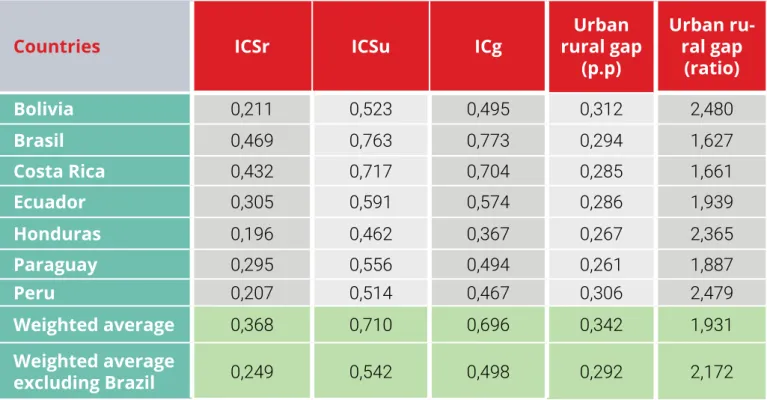
The Significant Connectivity Index takes values between 0 and 1 and its calcu-lation is based on a simple average of the four indicators of Internet access, equipment, broadband services and 4G coverage technologies. The index mul-tiplied by 100 may be interpreted as the percentage of connectivity penetration in the population. The averages were weighted according to the relative size of the rural, urban and national populations of each country with respect to the total sample. Weighted averages are calculated with and without Brazil due to the large size of the rural, urban and national populations of that country, which in 2017 represented, respectively, 54, 76 and 72% of the total sample. Table 1 presents the values of the indices at the rural, urban and national levels, as well as the urban-rural gap of significant connectivity.
For the sample of seven Latin American and Caribbean countries, the ur-ban-rural connectivity gap averages 34.2 percentage points, with variations ranging from 26.1 percentage points in Paraguay, to 31.2 percentage points in Bolivia. The differences in gaps hide even more heterogeneous levels of significant rural connectivity among the countries in the sample. In ascending order, Honduras, Peru and Bolivia obtain relatively low scores for significant rural connectivity (from 19.6 to 21.1%; identified in red in Graph 1), Ecuador and Paraguay obtain medium scores (from 29.5% to 30.5%; in yellow) and Brazil and Costa Rica are positioned in the region with higher percentages of significant rural connectivity (from 43.2 to 46.9%; in green).
TABLE 1.
RURAL, URBAN AND GENERAL SIGNIFICANT CONNECTIVITY
INDEXES (ICSR, ICSU AND ICG) AND URBAN-RURAL GAP (THE MINIMUM
SCORE IS 0 AND THE MAXIMUM IS 1). SELECTED COUNTRIES, YEAR 2017
Countries ICSr ICSu ICg rural gapUrban
(p.p) Urban ru-ral gap (ratio) Bolivia 0,211 0,523 0,495 0,312 2,480 Brasil 0,469 0,763 0,773 0,294 1,627 Costa Rica 0,432 0,717 0,704 0,285 1,661 Ecuador 0,305 0,591 0,574 0,286 1,939 Honduras 0,196 0,462 0,367 0,267 2,365 Paraguay 0,295 0,556 0,494 0,261 1,887 Peru 0,207 0,514 0,467 0,306 2,479 Weighted average 0,368 0,710 0,696 0,342 1,931 Weighted average excluding Brazil 0,249 0,542 0,498 0,292 2,172
Source: IICA, BID, Microsoft; 2020.
Levels of significant rural and urban connectivity are highly correlated (Table 1 and Graph 1), that is, when connectivity is low or high at the urban level, it is also the same at the rural level, but even so, the differences between countries are notable. On average for the seven countries, the percentage of significant connectivity is twice as high in urban areas as in rural areas, with gaps ranging from 2.5 times in Bolivia and Peru to 1.6 - 1.7 times in Brazil and Costa Rica. The data reveal that an alarming number of rural dwellers do not have access to quality connectivity, according to the standards of significant connectivity. The average percentage of people without access to significant connectivity is 63%, but if Brazil is excluded because of its higher relative population weight, the average rises to 75%. As we will can observe below, this would mean that more than 77 million rural inhabitants in Latin America and the Caribbean (24 countries) do not have access to quality connectivity services.
GRAPH 1.
RURAL, URBAN AND GENERAL SIGNIFICANT CONNECTIVITY
INDEXES (ICSR, ICSU AND ICG) AND URBAN-RURAL GAP (THE MINIMUM
SCORE IS 0 AND THE MAXIMUM IS 1). SELECTED COUNTRIES, YEAR 2017
Rural Significant Connectivity Index
0.200 0.100 0.150 0.200 0.250 0.300 0.350 0.400 0.450 0.500 0.550 0.600 0.650 0.700 0.750 0.800 0.300 0.400 0.500 0.600 0.700 0.800 HND R: 0.196 U: 0.462 BRA R: 0.469 U: 0.763 CRI R: 0.432 U: 0.717 ECU R: 0.305 U: 0.591 PRY R: 0.295 U: 0.556 BOL R: 0.211 U: 0.523 PER R: 0.207 U: 0.514
Finish line with connectivity equality
Urban-rural Gap
Estados Árabes
Graph 1 reflects the long road ahead for countries to at least equal the signi-ficant connectivity of rural populations to the same levels as urban dwellers. Even so, it would not be enough because an average of 29% of the urban po-pulation, or 46% if Brazil is excluded, does not have access to quality services. Over time, and as a result of the implementation of effective and differentiated policies, we will see a cluster of countries in the upper right-hand corner of Graph 1 as an indication that all countries, both in rural and urban areas, will have reached levels close to 100% penetration of connectivity services with minimum quality standards. The aim is to reduce existing gaps by eliminating territorial and interpersonal imbalances in order to effectively take advantage of the opportunities offered by development in general and, in particular, by the production and exchange of material goods and digital services.
TABLE 2.
PARTIAL INDICATORS OF THE RURAL SIGNIFICANT
CONNECTIVITY INDEX. SELECTED COUNTRIES, 2017
Source: IICA, BID, Microsoft; 2020.
Countries internet Daily
use Equipment
Broad-band Technology4G ICSr
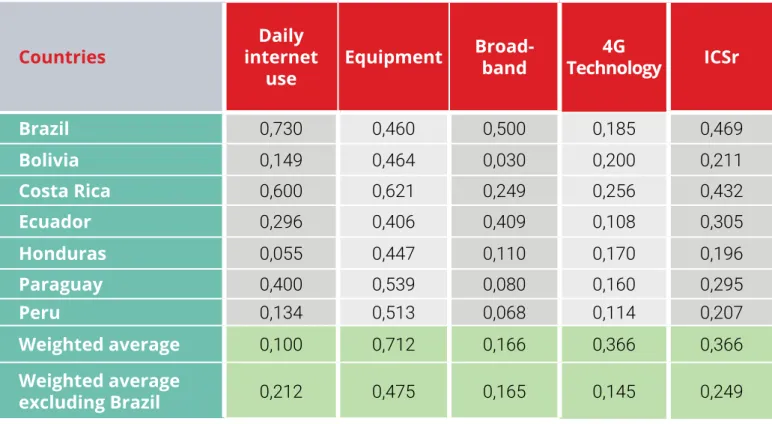
Brazil 0,730 0,460 0,500 0,185 0,469 Bolivia 0,149 0,464 0,030 0,200 0,211 Costa Rica 0,600 0,621 0,249 0,256 0,432 Ecuador 0,296 0,406 0,409 0,108 0,305 Honduras 0,055 0,447 0,110 0,170 0,196 Paraguay 0,400 0,539 0,080 0,160 0,295 Peru 0,134 0,513 0,068 0,114 0,207 Weighted average 0,100 0,712 0,166 0,366 0,366 Weighted average excluding Brazil 0,212 0,475 0,165 0,145 0,249
Analysis of Results according to Dimensions
of the Significant Rural Connectivity Index
2.4
A look at the pillars or dimensions of significant rural connectivity (Table 2) re-veals that the most significant lags in connectivity are due to the low frequency of internet use with an average of only 10% of the rural population (or 21% if Brazil is excluded) using the internet daily. Internet use is particularly low in Hon-duras, Peru and Bolivia. Next in importance is the low broadband penetration with an average of 16.6% of the rural population accessing this service. The countries with the lowest access are Bolivia, Peru, Paraguay and Honduras. The use of equipment (mainly smart phones) and access to 4G technologies show more favorable rates, with average penetration levels in rural populations of 71% and 37%, respectively (48% and 15%, respectively, if Brazil is excluded from the average). Brazil’s influence on average access to 4G technologies is notewor-thy, concealing the fact that, for the rest of the countries, about 85% of the rural population does not have access to adequate internet speed.
the higher the broadband penetration, the greater the use of personal computers.
lower broadband penetration in rural territories is closely tied to greater availability of mobile devices, or vice versa; and
The results according to dimensions of the index of significant rural connecti-vity suggest that the challenges of addressing the problem of connecticonnecti-vity in this area differ from country to country. Some countries register high levels of daily Internet use (Brazil and Costa Rica), but have lower levels of 4G Rural coverage. Similarly, the availability of equipment, in general, is relatively high (mainly mobile equipment) but access to fixed broadband differs significantly between countries, from 3% penetration in Bolivia to 50% in Brazil. The data are evidence of the complexity of the problem, which requires the design of specific instruments and approaches that focus on the most limiting factors.
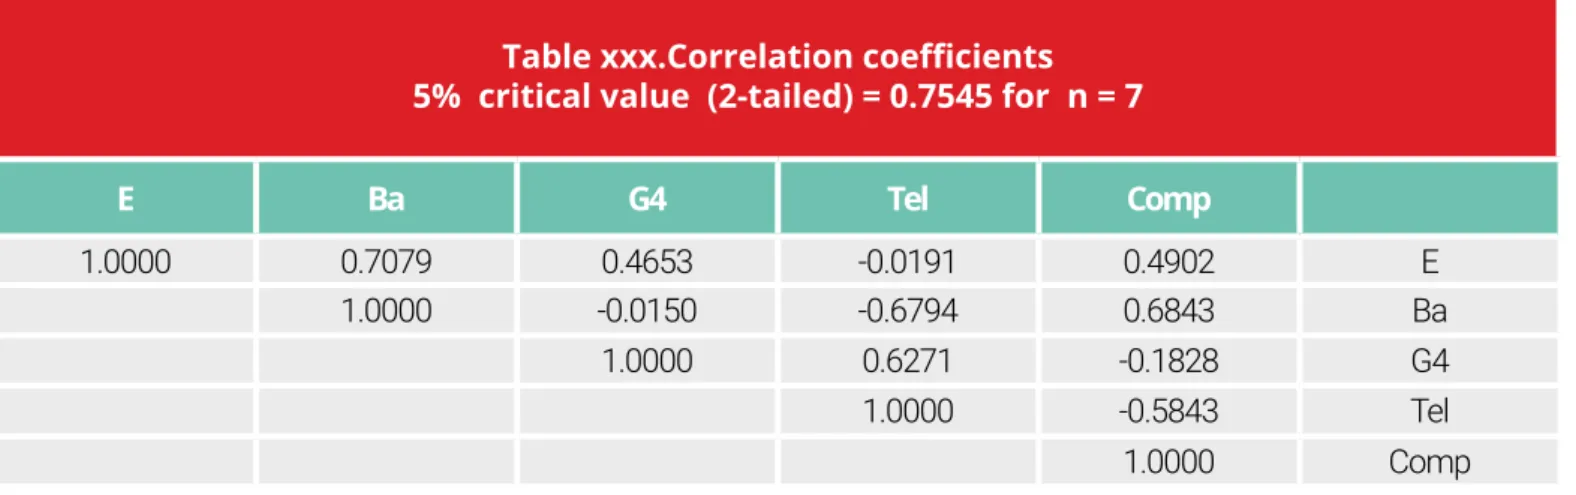
An analysis of the linkages between the indicators that make up the Significant Rural Connectivity Index allowed for determining its main drivers. The combina-tion of several methods, such as the correlacombina-tion matrix, ordinary least squares (OLS) between pairs of variables, and the principal component analysis (see An-nex I), allows for concluding, in general terms, that:
1
daily internet use in rural areas of the seven countries is strongly associated with greater broadband availability rather than the availability of 4G technologies1
2
3
Based on the principal component analysis (see Annex I), two courses of ac-tion for improving rural connectivity were identified, which are expressed by two groups of variables that explain 88% of the variability in the data for the seven countries included in the sample (Graph 2).
The first component, which explains 53% of the data variability, shows that in-creased daily internet use occurs due toa greater availability of and access to broadband, as well as a higher percentage of rural dwellers who own a personal computer (as is the case in Brazil and Costa Rica). Conversely, lower internet use is associated with low broadband penetration and a low percentage of rural dwe-llers who own a personal computer (as is the case in Bolivia, Honduras and Peru).
These variables, in turn, are negatively associated with the variable of access to smartphones. In other words, rural dwellers who do not own a personal computer or who lack access to broadband, access the internet using smartphones.
The second component, which represents 35% of the data variability, shows that daily internet use increases as a result of greater availability of 4G te-chnologies and increased access to smartphones. The opposite also holds true; that is, daily internet use declinesalongside decreased availability of 4G technologies and more limited access to mobile phones. There is little asso-ciation between this componentof linkages between variables and the first component, given that smartphones and 4G technologies represent an alter-native to the lack of or limited broadband penetration and low level of access to personal computers (Graph 2 and Annex I).
GRAPH 2.
CORRELATION BETWEEN THE INDICATORS OF THE SIGNIFICANT
RURAL CONNECTIVITY INDEX
Source: Prepared by the author based on the principal component method (Annex I). IICA, BID, Microsoft; 2020.
Component 1 -0.6 -0.8 -0.4 -0.2 0 0.2 0.4 0.6 0.8 -0.6 -0.4 -0.2 0 0.2 0.4 0.6 0.8 1 1.2 Compo nent 2 SMARTPHONES 4G TECHNOLOGY
DAILY INTERNET USE
BROADBAND PERSONAL COMPUTER
This study was conducted for seven countries in Latin America and the Carib-bean due to the absence of data disaggregated by rural and urban areas for the rest of the countries. However, it is possible to assume that there is a high corre-lation or linkage between the index of significant rural connectivity estimated in this study and other indices available in the literature.
For example, the correlation between the Rural Significant Connectivity Index and the Broadband Development Index published by the IDB is 82%. This means that, based on this high correlation between the indices, this measurement can be ex-trapolated to the rest of the countries of Latin America and the Caribbean. The high correlation between these two indices should not be surprising be-cause the indicators included in the infrastructure dimension of the BDI index are similar or directly linked to indicators used to calculate the SIRI, such as 4G coverage, households with personal computers, households with access to the internet, access to broadband, and internet speed. Other indicators used in the construction of the Broadband Development Index are indirectly linked because they clearly have an effect on significant connectivity. For example, the degree of progress made by countries in implementing public policies and defining regulations that promote information and communication technolo-gies, spending on research and development, and broadband development will clearly have a significant impact on levels of connectivity at both the urban and rural levels. On the other hand, the development and use of applications and digital training, as well as the level of penetration of digital technologies in businesses, communities, governments and schools, will undoubtedly have significant effects on quality rural connectivity.
Graph 3 shows in blue the high and significant correlation between the IDB’s Broadband Development Index and the Rural Significant Connectivity Index for the seven countries included in this study. Based on a simple extrapolation of the results to the rest of the countries of Latin America and the Caribbean (17 countries), a logarithmic adjustment formula was used. Suriname and Haiti were excluded from the analysis because they presented extreme values, so the graph shows the results for 24 countries in the region, which in 2017 accounted for 116 million rural dwellers out of a total of 124 million for Latin America and the Caribbean. In other words, this extrapolated sample is representative of 93% of the region’s rural population .
10
10
https://databank.worldbank.org/source/world-development-indicators
Extrapolation of results to other Latin American
and Caribbean countries
GRAPH 3.
CORRELATION BETWEEN THE RURAL SIGNIFICANT
CONNECTIVITY INDEX (RSCI) AND THE IDB’S BROADBAND DEVELOPMENT
INDEX (BDI), 2018 VERSION
This extrapolation of the results enables the identification of at least three clusters of countries, marked in the graph in red, yellow and green:
CLUSTER WITH LOW SIGNIFICANT RURAL CONNECTIVITY:Jamaica, El Salvador, Belize, Bolivia, Peru, Honduras, Venezuela, Guatemala, Nicaragua and Guyana. This group of 10 (out of 24) countries accounts for 28% of the rural population in the sample of 24 countries or 32.5 million people. The index for this group of countries ranges from 29% (Jamaica) to 11% (Guyana), which means that between 71 and 89% of the rural population in these countries does not have access to connectivity services of sufficient quality. Note that the connectivity indices for Bolivia, Peru and Honduras are actual estimates from this study, while the indices for the rest of the countries are extrapolations according to the methodology explained above.
Source: IICA, BID, Microsoft; 2020.
LOW CONNECTIVITY MEDIUM CONNECTIVITY HIGH CONNECTIVITY ESTIMATED ICSR AND IDB'S BDI Broadband development index (BDI)
2.00 2.50 3.00 3.50 4.00 4.50 5.00 5.50 6.00 0.05 0.10 0.15 0.20 0.25 0.30 0.35 0.40 0.45 0.50 GUY, 3.48, 0.110 NIC, 3.51, 0.116 GTM, 3.71, 0.157 VEN, 3.82, 0.178 BLZ, 4.06, 0.223 SLV, 4.07, 0.225 PRY, 3.99, 0.295 BRA, 5.21, 0.469 CRI, 5.17, 0.432 TTO, 4.86, 0.356 MEX, 4.86, 0.356 ARG, 4.84, 0.353 URY, 4.79, 0.345 DOM, 4.66, 0.325 HND, 3.90, 0.196 BOL, 4.15, 0.211 PER, 4.62, 0.207 ECU, 4.77, 0.305 COL, 4.99, 0.375 PAN, 5.04, 0.383 BRB, 5.18, 0.403 BHS, 5.35, 0.427 CHL, 5.66, 0.468 JAM, 4.46, 0.293
Opportunities, Challenges and Decision-making Issues
2.6
In summary, approximately 77 million rural dwellers in 24 countries do not have access to connectivity with the minimum quality standards required according to the concept of Significant Connectivity shared in this study. Much research remains to be done in order to deepen the analysis and extend it to more countries in the region, taking into account that differentiation by urban and rural areas is strategic and necessary. It will undoubtedly help to undertake public and private actions, at the level of rural communities and organizations, multilateral credit agencies and international support and investment institutions, local governments, academia, among many other actors. Having complete, open and available information and data in an appropriate and timely manner is key to the comprehensive management of this challenge. Direct coordination and the generation of agreements with national statistics offices, universities, research institutes and observatories is therefore essential for the recovery of better data on the rural digital divide.
Improving connectivity and closing the digital gaps between people and between rural and urban territories should hold great appeal and be a priority for policy de-sign if their benefits are recognized and evidenced. Improved digital services and connectivity will save time and money, make production processes and public and private services more efficient, generate employment, improve productivity MEDIUM-LEVEL CLUSTER WITH SIGNIFICANT RURAL CONNECTIVITY: Trinidad and Tobago, Mexico, Argentina, Uruguay, Dominican Republic, Ecuador and Paraguay. This group of seven countries represents 35% of the rural population of the sample of countries or the equivalent of 40 million people. The index of rural Significant Connectivity for this group varies from 35.6 (Trinidad and Tobago) to 29.5 (Paraguay), which means that between 64 and 71 percent of the rural population in this group of countries does not have access to connectivity services with minimum quality standards.
HIGH LEVEL CLUSTER OF SIGNIFICANT RURAL CONNECTIVITY: Brazil, Chile, Costa Rica, Bahamas, Barbados, Panama and Colombia. Finally, this group of seven countries represents 37% of the rural population in the sample of 24 coun-tries, or the equivalent of 43 million people. The index of rural Significant Connec-tivity for this group varies from 46.9 (Brazil) to 37.5 (Colombia), which means that between 53 and 62% of this population group does not have access to significant connectivity services.
11 12
and the quality of products and services, and promote inclusive education and expand the possibilities for knowledge and participation in global culture , which are key factors in achieving sustainable development of the region’s agricultural and food systems .
This will not be an easy task, since the rural-urban digital divide in general and the significant connectivity gap in particular are both the cause and the effect of the many gaps observed in the countries of Latin America and the Caribbean (see ECLAC/FAO/IICA, 2019). In addition to the gaps described in detail in the report, there is the gap that may form the basis for others: 71% of the population has access to significant connectivity services, while in rural populations the percentage drops to 36.8%, a gap of 34 percentage points. Correcting these gaps in the immediate future is a major challenge, given that the recession caused by the COVID-19 pandemic is, as will be noted later on in this document, the largest in the history of Latin America and the Caribbean.
11 12
https://publications.iadb.org/publications/spanish/document/Informe_anual_del_%C3%8Dndice_de_Desarrollo_de_la_Banda_An-cha_en_Am%C3%A9rica_Latina_y_el_Caribe_es.pdf
The state of connectivity in Latin America
and the Caribbean and the re-dimensioning
of the problem of access limits in rural areas
3
Latin America and the Caribbean advance in developing
a digital ecosystem, but have tasks pending
3.1
According to the CAF Digital Ecosystem Observatory (2020), Latin America and the Caribbean are currently at an intermediate level of development compared with other regions in the world in terms of development of a digital ecosystem: “with an index of 49.92 (on a scale of 0 to 100), the region is in a more advanced posi-tion compared to Africa (35.05) and Asia and the Pacific (49.16). However, despite
13
Currently, the world is undergoing a transformation of great magnitude in the field of information and communications driven by a technological revolution without precedent. In this scenario, digitization raises endless possibilities for economic, social, cultural, environmental, health, scientificand educational development as well as resilience to climate change, so much so that the spectrum of human activities is affected by the profound changes taking place. Furthermore, available technologies represent not only more advanced tools and instruments, but they also radically modify the very activities they are used to carry out. In short, it is not merely about the existence of new artifacts, but that these objects possess the ability to modify productive processes, process data at a large-scale, drive the creation of knowledge-sharing, foster previously unknown forms of artificial intelligence and democratize access to resources and services, among other changes.
RURAL CONNECTIVITY
13 For more information on the calculation of the index, see: CAF Digital Ecosystem Observatory (2020)
AFP Pablo Porciuncula
GRAPH 4.
DIGITAL ECOSYSTEM DEVELOPMENT INDEX (2018) VS.
GROWTH RATE (2004-18)
Source: Telecom Advisory Services Analysis, cited by CAF, 2020.
significant advances in the development of its digital ecosystem over the last fif-teen years, Latin America and the Caribbean still show a lag behind Western Europe (with an index of 71.06), North America (80.85), Eastern Europe (52.90) and Arab States (55.54).” (CAF, 2020: 13)
In addition to the lag in the development of the digital ecosystem compared to other more developed regions, it has an annual index growth rate inferior to other regions. “In fact, Latin America and the Caribbean belong to an emerging group of coun-tries whose digitization presents a moderate annual growth rate” (CAF, 2020:13). During the period 2004-2018 (see Graph 4), the region registered an annual rate of 6.21%, behind that of Eastern Europe (6.89%), Africa (8.27%), and Asia and the Paci-fic (8.27%). According to this index, Latin America and the Caribbean could register a more accelerated rate as a function of its level of digital ecosystem development, so this growth rate is still below its potential.
Growth rate of the Digital Ecosystem (2018)
Growth rate of the Digital
Ecosystem Development
Index (2004-2018)
30.00 20.00 3.00% 4.00% 5.00% 6.00% 7.00% 8.00% 9.00% 10.00% 40.00 50.00 60.00 70.00 80.00 90.00 Africa Asia-Pacific Latin America and the CaribbeanEastern Europe Arab States
Western Europe
North America
The problem of connectivity access
3.2
When it comes to Latin America and the Caribbean (henceforth LAC), the pre-sence of new information and communication technologies takes on particular characteristics since the region is the most disparate worldwide. Because of this, it is supremely important to address existing gaps when confronting the challenge and opportunities that digitization brings.
Gaps in accessibility deepen inequality in terms of knowledge links, exerci-sing citizenship to the fullest, and possibilities of economic integration. The CAF report posits that disconnection curtails access to information that is in the public interest, the completion of online transactions and procedures, and also overrides possibilities of consuming and producing content.
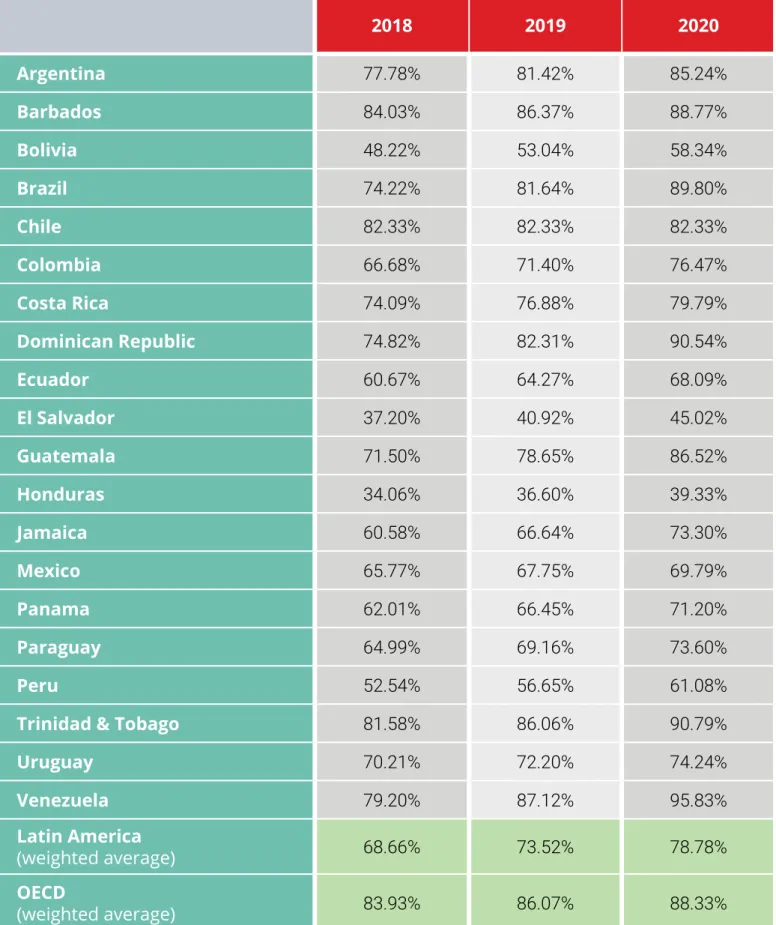
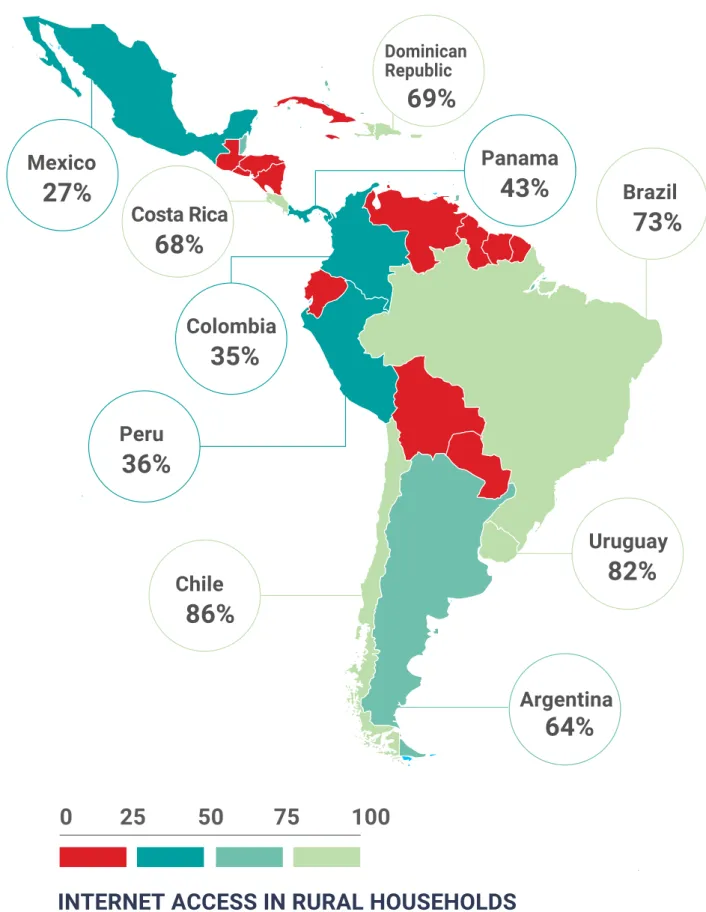
In the region, 32% of the Latin American population (244 million of its inhabi-tants) does not have access to Internet services (CAF, 2020). This figure fails to reveal another regional problem: the sizeable imbalance between and within the countries, where economies coexist with levels of household internet pene-tration less than 40% (see Table 3).
Were we to consider factors related to the quality of service, the gap is even wider. Per ECLAC statistics (2018), of the two countries best placed in terms of connectivity within the region (Chile and Uruguay), only 15% of its connec-tions had speeds greater than 15 Mbps. At the other end of the spectrum, we could mention Bolivia’s case, a country with one of the region’s lowest connectivity percentages .
14
14
Bolivia recently began installing its own connection to the global fiber optic network that covers almost 20,500 kilometers. This will enable the country to reduce the cost of internet access (which is currently the most expensive in South America) and to extend coverage to other regions and lower income sectors. See complete information, 09/04/20 DiarioInfobae
TABLE 3.
INTERNET PENETRATION IN HOUSEHOLDS IN LATIN AMERICA
AND THE CARIBBEAN (2018-2020) (*)
(*) Publication note: the values shown in the table were calculated based on official information submitted by each country.
Note: the latest data provided by ITU correspond to 2017 and 2018 according to the country. Data for 2019 and 2020 have been extrapolated based on the growth rate of the last year of information provided by ITU.
2018 2019 2020 Argentina 77.78% 81.42% 85.24% Barbados 84.03% 86.37% 88.77% Bolivia 48.22% 53.04% 58.34% Brazil 74.22% 81.64% 89.80% Chile 82.33% 82.33% 82.33% Colombia 66.68% 71.40% 76.47% Costa Rica 74.09% 76.88% 79.79% Dominican Republic 74.82% 82.31% 90.54% Ecuador 60.67% 64.27% 68.09% El Salvador 37.20% 40.92% 45.02% Guatemala 71.50% 78.65% 86.52% Honduras 34.06% 36.60% 39.33% Jamaica 60.58% 66.64% 73.30% Mexico 65.77% 67.75% 69.79% Panama 62.01% 66.45% 71.20% Paraguay 64.99% 69.16% 73.60% Peru 52.54% 56.65% 61.08%
Trinidad & Tobago 81.58% 86.06% 90.79%
Uruguay 70.21% 72.20% 74.24% Venezuela 79.20% 87.12% 95.83% Latin America (weighted average) 68.66% 73.52% 78.78% OECD (weighted average) 83.93% 86.07% 88.33%
The gap widens within the interior of the region’s countries, between urban and rural, also between men and women, youth, senior adults, the indigenous population and other disadvantaged groups represented by the lowest inco-me quintiles. According to data and estimations provided by ECLAC (2019), 19% of the population in LAC live in rural areas with less than 2,000 inhabi-tants, a percentage which is systematically decreasing since the 1960s due to the continuous urbanization process. As per the ECLAC, FAO, IICA (2019) report, if the region wishes to fulfill the 2030 Sustainable Development Goals, it must deepen its structural transformation of rural territories, boosting and redirecting them in the economic, social and environmental realms; to do this, the region must overcome multiple socioeconomic gaps relating to the ur-ban areas, one of these being access to infrastructure and basic services. On average, the differences in internet access among LAC urban and rural po-pulations reach 28 percentage points. According to ECLAC, FAO, IICA (2019), many rural areas in LAC do not have internet coverage, since the population spread makes it unprofitable for private companies.
GRAPH 5.
HOUSEHOLDS WITH INTERNET ACCESS PER LOCATION.
SELECTED COUNTRIES, 2019.
Source: IICA (2019) prepared based on ITU and ICTs 2019
Households with internet access by location (%)
0% 10% 20% 30% 40% 50% 60% 70% 80% 90% 100%
In terms of population, the information available for thirteen of the region’s countries also points to significant differences in internet access depending on location, ranging from 15 percentage points (Brazil, Uruguay, Costa Rica) to more than 40 points (Bolivia, Peru), to the detriment of rural inhabitants.
Concerning mobile internet, despite the advance, network coverage continues to be limited (FAO-ECLAC, 2020). In 2018, the urban-rural gap in mobile internet use was 29% for LAC, which is below the average for low- and medium-income countries (40%) but above low- and medium-income countries in east and central Asia and Europe [GSMA 2020].
GRAPH 6.
INTERNET USER POPULATION PER LOCATION AS
A PERCENTAGE OF TOTAL POPULATION. 2017.
Source: CAF (2020) based on ECLAC data. 0% 10% 20% 30% 40% 50% 60% 70% 80% 90%
GRAPH 7.
RURAL-URBAN GAP IN THE USE OF MOBILE INTERNET IN LOW
- AND MIDDLE - INCOME COUNTRIES BY REGION. 2017-2019
Source: GSMA. 2020. The State of Mobile Internet Connectivity 2020. Translation of the graph is the author’s.
LAC’s advance in the area of connectivity has allowed the gap to lessen in relation to OECD countries (according to the Broadband Development Index, IDB, 2019, which measures the current state of broadband in the region). However, there continue to be significant differences in two of the four pillars that make up the index, “Infrastructure” and “Public Policies”. With regard to infrastructure, according to CAF data, LAC investment in telecommunications infrastructure per capita PP (purchasing power) accumulated over five years is USD 462.80, almost half the investment of OECD countries (USD 852.18).
The “rural gap” refers to how much less a rural inhabitant tends to use mobile internet in relation to an urban dweller calculated as 1-(adoption of mobile internet in rural areas/adoption of mobile internet in urban areas).
The data was obtained from the GSMA Intelligence Consumer Survey and Gallup World Poll (for countries not included in the first one). There are differences between the two questions used for the analysis. The GSMA Intelligence Consumer Survey refers to persons who have used the Internet on a mobile phone at least once in the last three months. The Gallup World Poll refers to persons who have access to Internet in any form, whether by mobile phone, computer or any other instrument. Therefore, the questions are not completely comparable. However, the data of the countries covered by both surveys have a high degree of correlation (0.8) and the 28 countries covered by the GSMA Intelligence Consumer Survey represent 75% of the adult population of low and medium-income countries.
0% 10% 20% 30% 40% 50% 60% 2017 2018 2019 46% 41% 37% 30% 23%22% 30% 26%25% 35% 29% 24% 40% 47% 45% 30% 65% 58%60% 37%37%
At the level of telecommunications infrastructure, it is necessary to increase the backbone as well as the “middle mile” infrastructure which allows the bac-kbone to be connected to the backhaul. According to the report “Broadband Policies for LAC: A manual for the digital economy” prepared by OECD and IDB in 2016, “one of the reasons behind the lack of access to broadband is the ab-sence of transport infrastructure in the backbone or of infrastructure that con-nects these backbones to the access switches or the base station (backhaul network or return). This is the case in rural areas, including rural areas in the LAC region, where there are less incentives to invest and widen the national backbone.”
The barriers relating to digital inclusion present various difficulties. The GSM Association (GSMA), which represents mobile operators worldwide and is the nucleus of over 400 companies dedicated to mobile telecommunications, has identified four main barriers:
• ECONOMICS OF INFRASTRUCTURE: expansion of mobile internet coverage in rural areas
• AFFORDABILITY: reduction in the total cost of mobile internet ownership • DIGITAL APTITUDE: increase in the adoption and use of the internet
through digital literacy
• LOCAL CONTENT: promotion of relevant content to attract people to use the Internet.
It is in this context that the specific needs and challenges that require most important attention in the rural areas are raised, especially considering the significant challenges for future development.
This document focuses on the first of these barriers and highlights the current situation and the obstacles to addressing the coverage gap in Latin America and the Caribbean.
Connectivity as a priority during the COVID-19 crisis
3.3
The CAF report (2020) indicates that if LAC is to achieve the same levels of digi-talization as the OECD, the region will require 160 billion dollars in, which is 60% more than the investment that had been estimated originally. It also estimates that if Latin America were able to bridge the digital divide with the OECD, this would impact productivity and would potentially enable growth of more than 3% annually. However, one must also take into account the stagnation in growth
due to the pandemic, given that, according to new World Bank projections in July 2020, Latin America’s economy will contract by 7.2%. These projections suggest that growth will fall short of estimates made by ECLAC in 2019, which forecast 700 billion dollars of additional growth up to 2030 and the creation of more than 400,000 jobs annually.
The current situation surrounding COVID-19 further exacerbates the marginalization of almost one third of the Latin American population in terms of internet availability (both coverage and connectivity speed). It also demonstrates the inability of existing devices to cope with the new reality, as well as the limitations in the required skills to use these devices in different activities. A vast number of citizens are excluded from services and activities (education, health care, financial services, the ability to conduct electronic transactions, access to transactions with state entities, among others).
In this context, the recent CAF study on the digitalization of LAC amidst the pan-demic— “El estado de la digitalización de América Latina frente a la pandemia
del COVID- 19” (2020)—issues a warning about the differing conditions among
countries in the face of the pandemic. For example, the countries that are at the forefront of e-government adoption are those that had been working on these developments previously: Chile, Uruguay, Mexico, Brazil and Argentina. The digi-talization of education has introduced special plans, such as, Seguimos
Educan-do (Argentina), Aprender Digital (Colombia), Educar EcuaEducan-dor (EcuaEducan-dor), and Plan Ceibal (Uruguay), among others.
The ability to access internet in homes is therefore a critical tool in tackling the health and economic crisis, as it allows individuals to continue activities that are restricted due to social distancing measures and instead facilitates access, through the use of technology, to telecommuting, education, health care and rural extension services, among other activities and services.
Connectivity will determine the ability of rural areas in the hemisphere to acquire state-of-the-art knowledge, as is the case with the global initiative spearheaded by Precision Agriculture for Development. The initiative has used 2G and more advanced technology; big data; machine learning, while drawing on the principles of behavioral economics, to send personalized messages through the mobile network to enable small farmers to mitigate the impact of COVID-19, which has restricted the delivery of face-to-face rural extension services, and to continue improving productivity and output (for example, by providing technical advice on pests, crops, best practices and animal health, to name just a few). In Latin
15
15
This is an initiative by Michael Kremer (2019 Nobel Prize winner for Economics), which was implemented in Asia and Africa, and which will be introduced in Northeast Brazil, through a cooperation agreement between Brazil’s Ministry of Agriculture, Livestock and Food Supply (MAPA), PAD and IICA, to develop digital solutions for agriculture.