MEASUREMENT OF THE ELECTRIC CURRENT DISTRIBUTION IN AN ANODE
Marc-Alain Andoh1, Duygu Kocaefe1, Dipankar Bhattacharyay1, Yasar Kocaefe1, Daniel Marceau1, Brigitte Morais21 UQAC/AAI Research Chair on Carbon and REGAL Aluminum Research Center
University of Quebec at Chicoutimi, 555 Boulevard de l'Université, Chicoutimi, QC, Canada G7H 2B1 2Aluminerie Alouette Inc., 400, Chemin de la Pointe-Noire, Sept-Îles, Québec, Canada G4R 5M9 Keywords: Carbon anodes, anode quality control, electrical current distribution, electrical resistance distribution
Abstract
Carbon anode, which carries the electricity and provides the carbon necessary for the electrochemical reaction in the electrolytic cell, is an essential component of the primary aluminum production. Energy efficiency and environmental impact are still the key issues in modern aluminum smelters; thus, it is important to control the quality of anodes which strongly influences the energy consumption and the greenhouse gas emissions.
As the uniform current distribution appears to be one of the indicators of the anode quality, an experimental system has been developed to measure the current distribution in an anode. This article describes the measurement system used for laboratory anodes and presents the experimental results. The results are also compared with the electrical resistance distribution measurements in the anodes, and the comparison shows good agreement.
Introduction
The production of primary aluminum is carried out via the Hall-Heroult electrochemical process. During the electrolysis, high amperage is used to transform the alumina into aluminum. This current is supplied to the electrolytic cell through carbon anode blocks which are manufactured from dry aggregates (composed of calcined petroleum coke, recycled butts, and rejected green and baked anodes). The aggregates, after mixing with coal tar pitch, are pressed or vibrocompacted to form green anodes which are then baked in large furnaces to produce baked anodes [1, 2].
The carbon anodes must have low electrical resistivity to have good energy efficiency in the cell. At the end of the baking cycle, a core sample from approximately 1.5% of the anodes produced is subjected to quality control tests. These include physical, electrical, mechanical, and chemical tests to ensure that the good quality anodes are installed in the electrolytic cells [3].
Several studies have been reported in the literature showing the direct impact of the electric current distribution on the operation and performance of the electrolytic cells. The flow of electric current controls the magneto-hydrodynamic (MHD) forces in the cell [4-6]. The high intensity electrical currents in the electrolytic cell generate high magnetic fields that lead to the onset of motion within the molten aluminum layer [7]. The movement of the ions affects the distribution of current in the cell. These flows are of MHD nature, and they are of concern to the cell stability. It was also reported that the measurement of individual anode currents can help detect the anode effects earlier [8]. Figure 1 shows a typical electric current distribution in an electrolytic cell.
Only a few studies have been published on the measurement of current distribution in anodes. Kuang, and Thonstad measured the potential distribution in the electrolytic bath by introducing probes connected to the position sensors in the cell [5] and correlated the voltage distribution to the current distribution in the cell. They measured the current distribution along the sides of the anodes in commercial Søderberg aluminium cells. Urata and Evans [8] measured the magnetic field in an anode with sensors placed near the anode stubs. Later, they converted the measured magnetic field into current by using a proportionality constant. This method is commonly used in industrial smelters for the measurement of the electric current distribution.
Figure 1: Current flow in an aluminum smelting cell [6] Aluminum smelters follow the ASTM D6120-97 standard to determine the electrical resistivity of baked anodes using small cylindrical cores. These cores are taken from the top of the anode which does not come into contact with the electrolytic bath. This method does not take into account the non-homogeneity of the anodes. Smelters, therefore, need methods that can enable them to evaluate the resistivity of the entire anode in order to identify the defective anodes as early as possible in the production line.
A number of researchers worked on the measurement of electrical resistivity (or conductivity) of the entire anode, the evaluation of contact resistances, and the estimation of voltage drop at the stub-cast iron-anode interfaces. Seger [9] has developed a multiple contact system to measure the electrical resistivity of baked anodes.
Chollier-Brym et al. [10], based on the work of Seger, have developed a device called the Instantaneous Measurement of Electrical Resistance of Anode (MIREA). This equipment was used to measure the voltage drop along the height of the anode. The performance of the device was compared with the resistivities of the cores taken from different positions in the anode. The first
version of MIREA was used to measure the electrical resistivities of anodes at predetermined positions on the current path. However, measurements were relatively slow due to the inflatable metallic bags used to apply the current in the stub holes. Subsequently, Leonard et al. [11] improved the MIREA by changing the inflatable metallic bags with metallic brushes which decreased the measurement time. They carried out six measurement campaigns using numerous baked anodes in different plants around the world. The results led to a better understanding of the variation of the resistivity in the anodes. The results also revealed the problems of homogeneity in anodes and possible issues related to the compactors. At the end of the measurement campaigns, it was concluded that MIREA could be used as a tool to compare the anodes in different plants through the measurements of the electrical resistivity. This method is applicable to only baked anodes, needs calibration for each plant and it can’t detect the defects outside the current path
Kocaefe et al. [12,13] have developed a tool (SERMA) for measuring the resistivity distribution in both green and baked anodes with the objective of identifying defective green anodes before they are baked and rectifying possible problems in the plant so that better quality green anodes are produced. The resistivity measurements agree well with the X-ray tomography results showing that the high resistivity regions correspond to the defective regions of the anode.
There are also reports on the inverse methods based on electrical or magnetic impedance tomography for the measurement of voltage or current distribution in different materials [14-17]. These methods utilize the experimental results as input to numerical models to obtain the distribution of voltage and current at different points of the anode. However, in most electrolytic cell modelling studies, the anodes are assumed to be homogeneous and the effect of anode non-homogeneity on cell current distribution is not taken in to account [18-20].
The goal of this study was to build a set-up to measure the current distribution in an anode.
Theory
Electrical conductivity (σ) is a fundamental material property that quantifies the ability of the material to carry a current when placed in an electrical field. Electrical resistivity (ρ), the inverse of conductivity, is the resistance (R) of a unit volume as measured across one dimension. Electrical resistivity has the unit of Ω.m, while that of the electrical conductivity is S.m-1 (Ω-1.m-1). With resistivities around 50-70 μΩ.m, a baked carbon anode is an electric conductor, and the current generated by an electric field is based on electronic conduction.
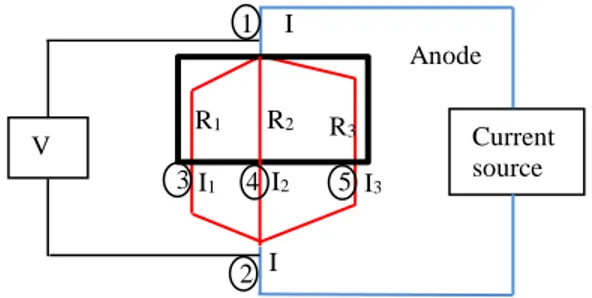
Figure 2: Current distribution measurement in an anode
Current measurement
In an electrical circuit, the current (I) is measured usually by an ammeter. The principle for the measurement of a current distribution in an anode can be represented schematically as shown in Figure 2.
Even though it is possible to directly use the ammeter for current measurements, sometimes it is more practical to determine the current indirectly by measuring the voltage drop across a resistance placed in the circuit. If the value of the resistance (R) is known, then current (I) can be calculated from the measured voltage (V) using Ohm’s law (equation 1):
R V
I= (1)
The schematic of measurement of current in an anode using this method is shown in Figure 3.
Figure 3. Determination of current by measuring voltage V across a resistance R
An anode can be represented as a combination of number of resistances. Figure 4 shows a simplified representation of an anode as a combination of three parallel resistances. Current I is applied to the anode at point 1 and leaves at points 3, 4, and 5 as
Figure 4. Representation of a combination of resistances in an anode
I1, I2, and I3, respectively. The sum of these three currents should be equal to I at point 2. The resistances of the current paths 1-3-2, 1-4-2, and 1-5-2 are R1, R2, and R3, respectively. The potential difference between the points 1 and 2 is V.
As given by Ohm’s law:
V = I1 R1=I2 R2 =I3 R3 (2) I1 I2 I3 Current source R Current source I I I1 I2 I3 R1 R2 R3 Current source V 1 2 3 4 5 Anode Anode Anode R R V1
Thus, 3 2 2 3 1 2 2 1
R
R
I
I
R
R
I
I
=
=
(3)Therefore, the ratio of currents between two points is equal to the inverse ratio of the resistances at those points. If the resistances are constant, then the ratio of currents will be constant for any I.
The resistances at different points of the anode should remain constant with the passage of current if the heating (Joule effect) is not significant. Thus, the total current applied to the anode should not influence the current distribution profile.
As indicated by Equation (2), if it is assumed that R2>R1, then I2<I1 in order to maintain the voltage drop V constant. Consequently, the value of current will be lower at the point where the resistance is higher compared to that of a point with a lower resistance. Accordingly, the resistivity distribution will have the opposite trend of the electric current distribution.
Electrical resistivity measurement
In general, the electrical resistivity measurement methods can be broadly classified as either 2-point or 4-point probe methods. In the 2-point probe method (Figure 5(a)), two electrodes are used to apply an electrical current (I), and the same electrodes are used to measure the corresponding drop in voltage (V) across the specimen. Electrodes must be in intimate contact with the specimen to induce a current within that specimen. Metallic electrodes can be surface-mounted using conductive gels and pastes. If a direct current (DC) with a value I is applied to the specimen, and (V) is the potential drop, then the resistivity (or conductivity) can be calculated using equation 1:
Wh
L
V
1
1 =
=
σ
ρ
(4) where L, W, and h correspond to electrode spacing, specimen width, and specimen height, respectively. Although 2-point DC probe measurements are easy to perform, they are not suitable for the measurements on small samples since the contact resistances at the electrode-specimen interface influences significantly the resistance of the specimen.The 4-point probe method (also called Kelvin method) is the preferred approach for measuring the resistivity (or conductivity) of conducting materials which have low values of resistivity [21]. This method uses four independent electrodes along the length of a specimen (Figure 5(b)). The two outer electrodes are used to supply an electric current (DC or AC) into the medium while the two inner electrodes are used for measuring the electrical potential developed over the length L. Again, if it is assumed that the cross-sectional area of the specimen is W*h, then Equation 4 is still valid. The effects of contact resistances are minimized in the 4-point probe method because the electrodes used for passing the current and those for measuring the voltage drop are different. The measurement of electrical resistivity is more accurate when compared with the 2-point probe method.
Applied force
The contact resistances have a parasitic influence on the electrical current measurements. According to the literature [22], the contact resistance varies inversely with the contact pressure which is itself proportional to the applied force. Figure 6 shows the variation of a contact resistance with applied force. It can be seen from this figure (at the asymptotic part of the curve) that there is no significant variation in the contact resistance above a certain threshold pressure. Therefore, it is important to measure the threshold pressure to minimize the effect of contact resistance.
Figure 5: Resistivity (or conductivity) measurement based on the (a) 2-point and (b) 4-point probe methods [21]
Figure 6: Evolution of the electrical contact resistance as a function of contact pressure [22]
During this study, Kelvin (or 4-point probe) method was used to measure the contact resistances.
Results and Discussion
Measurement system
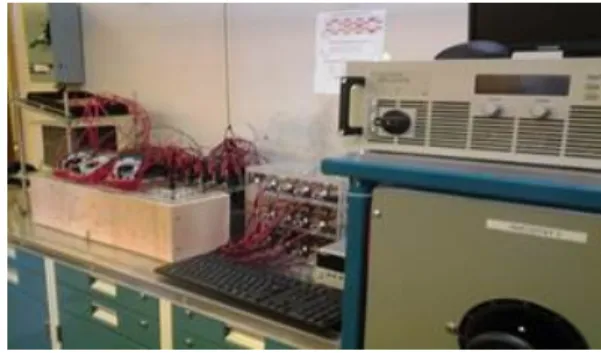
The principle of the measurement requires the application of current to the anode between the upper and lower surfaces and the measurement of the current at different points. The current is applied in the middle of the anode top surface. The bottom surface is fitted with a number of contacts placed in the form of a grid. Each point in the grid is connected to a resistance of known value. A schematic representation and a picture of the experimental system are given in Figures 3 and 7, respectively.
Figure 7: Experimental measurement system
According to the literature [22], the contact resistance gradually decreases as the contact pressure increases until it reaches an asymptotic region. In this region, the variation in resistance is not significant despite the increase in contact pressure. The results in Figure 7 show the same tendency and are in agreement with those found in literature.
The results in Figure 8 were obtained by measuring contact resistances at four points. Due to the surface roughness of anodes, there may be a slight variation in contact resistances for some of the other points. However, this is not expected to be significant.
Figure 8: Variation of contact resistances with applied force
Current distribution in the anode
Total currents of 8 A and 20 A were applied to the top surface of the anode, and the current distributions were measured as described above. The applied force was greater than the threshold force determined previously. Figure 9 shows the measured
contour plots of the current distributions for the two cases. Figure 9 indicates that the two current distributions are similar. Ideally, the total current should not influence the current distribution. The slight differences observed might be due to the difficulty in placing all the contacts at the same places during the two measurements and surface asperities.
In both cases (Figure 9 (a) and 9 (b)), the top left corners have the highest current and the bottom right corners have the lowest current. This might be due to the structure of the anode. The porous regions have a low density and a high electrical resistivity. Higher current preferentially passes from the regions of low electrical resistivity.
Figure 9: Current distributions for different total input currents of (a) 8 A and (b) 20 A
Electrical resistivity distribution in the anode
Resistivity distribution measurements were carried out for the test anode in order to determine the high and low resistivity regions. The measurement system and the methodology have been previously explained by Kocaefe et al [12]. A schematic representation of the specific electrical resistivity measurement apparatus (SERMA) is shown in Figure 10. A pair of plates containing a certain number of flexible contacts at exactly the same positions to feed current from one anode surface and to receive from the opposite anode surface were used for the measurement. These contacts were connected to a power supply and made a complete circuit. Close to the current contacts, the voltage contacts were installed on both plates to be able to measure the voltage drop at a given position. The current and voltage contacts were distributed over the plate covering the entire anode surface. At multiple points, a current was passed through the anode block from one surface to the opposite surface, and the corresponding voltage drop was measured. The electrical resistivities were calculated across the anode at all the measurement positions.
Figure 11 shows the resistivity distribution measured in the same direction as the one used for the current measurement. There was a difference between the positions of the contacts and the grid sizes of the current and resistivity measurements. During the measurement of the current distribution, the current is applied from the middle of the top surface. On the other hand, resistivity measurements require the feeding of current through a large number of points on the top surface corresponding to each point of voltage measurement at the bottom surface. Therefore, certain discrepancy is expected between these two measurements.
2
Figure 10: Schematic representation of the specific electrical resistivity measurement apparatus (SERMA) [12]
Normally, the current (Figure 9) corresponding to a low resistivity point (Figure 11) should be high. Thus, a blue region in the resistivity map should correspond to a yellow or red region in the current map, and a red or yellow region in the resistivity map should correspond to a blue region in the current distribution map. The results demonstrate that this relation holds. This shows that the electrical current distribution system gives reasonable results. As mentioned previously, usually the non-homogeneity of anodes is not taken into account in cell models. The next step is to study the effect of non-homogeneity of anodes on the current distribution. Measurement of the electrical resistivity distribution using SERMA or the optical density distribution by X-ray tomography can help understand the non-homogeneity of an anode. Understanding this effect will permit to better resolve anode non-homogeneity issues and help modelling studies represent the anodes more realistically.
Figure 11: The resistivity distribution measured using SERMA
Conclusions
This project focuses on a thorough understanding of the current distribution in a carbon anode. An experimental measurement system was developed to measure the current distribution in the anode. Preliminary results show that the current distribution obtained is in good agreement with the electrical resistivity distribution measured using the equipment developed by the carbon group of the University of Quebec at Chicoutimi (UQAC). Within the range of experimental error, the current distribution was found to be independent of the applied current and inversely correlated with the resistivity distribution as expected.
The results of this study might help more realistic representation of the current distribution in electrolytic cell models for aluminum production.
Acknowledgements
The technical and financial support of Aluminerie Alouette Inc. as well as the financial support of the National Science and Engineering Research Council of Canada (NSERC), Développement Économique Sept-Îles, the University of Quebec At Chicoutimi (UQAC), and the Foundation of the University of Quebec At Chicoutimi (FUQAC) are greatly appreciated. The authors would like to thank the Fonds de recherche du Québec nature et technologies by the intermediary of the Aluminum research centre – REGAL for their contribution for student participation in this conference.
References
[1] K. L. Hulse, Anode manufacture : Raw materials, formulation and processing parameters. Sierre, Switzerland, R & D Carbon Ltd., 2000.
[2] F. Keller, Anode baking : baking of anodes for the aluminum industry, 2nd ed.. ed. Sierre, Switzerland, R & D Carbon, 2008.
[3] Anodes for the aluminum industry, 2nd ed., Sierre, Switzerland, R & D Carbon Ltd., 2006.
[4] S. Das , G. Littlefair, Current distribution and Lorentz field modelling using cathode designs: A parametric approach, Light Metals, 2012, 847-851.
[5] Z. Kuang, J. Thonstad, Current distribution in aluminium electrolysis cells with Søderberg anodes Part I: Experimental study and estimate of anode consumption, Journal of Applied Electrochemistry, 26, 1996, 481-486.
[6] M. P. Taylor, W. D. Zhang, V. Wills, S. Schmid, A dynamic model for the energy balance of an electrolysis cell, Chemical Engineering Research and Design, 74, 1996, 913-933.
[7] A. Moraru, A. M. Morega, M. Petre, M. Cilianu, Magnetohydodynamic flow simulation in an aluminum electrolysis cell, Rev. Roum. Sci. Techn., Électrotechn. et Énerg., 56 (2), 2011, 131–140.
[8] N. Urata, J. W. Evans, The determination of pot current distribution by measuring magnetic fields, TMS Light Metals, 2010, 473-478.
[9] E. J. Seger, New method of measuring electrode resistance for quality Control, Light Metals, 1978, 283-290.
[10] M. J. Chollier-Brym, D. Laroche, A. Alexandre, M. Landry, C. Simard, L. Simard, D. Ringuette, New method for representative measurement of anode electrical resistance, Light Metals, 2012, 1299-1302.
[11] G. Léonard, S. Guérard, D. Laroche, J. C. Arnaud, S. Gourmaud, M. Gagnon, M. J. Chollier,Y. Perron, Anode electrical resistance measurements: learning and industrial on-line measurement equipment development, Light Metals, 2014, 1269-1274. Current contact Voltage contact Anode Plates
[12] Y. Kocaefe, D. Kocaefe, D. Bhattacharyay, Quality control via electrical resistivity measurement of industrial anodes, Light Metals, 2015, 1097-1102.
[13] D. Kocaefe, Y. Kocaefe, D. Bhattacharyay, Measurement of anode electrical resistivity for quality control in Al industry”, COM 2014, 2014.
[14] W. He, P. Ran, Z. Xu, B. Li, 3D electrical impedance tomography represented by reconstructed planes in a semispherical electrode array model, International Journal of Applied Electromagnetics & Mechanics, 41, 2013, 433-446.
[15] M. Brühl, M. Hanke, M. Pidcock, Crack detection using electrostatic measurements, ESAIM: M2AN, 35, 2001, 595-605.
[16] J. F. Lataste, C. Sirieix, D. Breysse, M. Frappa, Electrical resistivity measurement applied to cracking assessment on reinforced concrete structures in civil engineering, NDT & E International, 36, 2003, 383-394.
[17] R. Kress, L. Kühn, R. Potthast, Reconstruction of a current distribution from its magnetic fields, Inverse Problems, 18, 2002, 1127-1146.
[18] M. Dupuis, I. Tabsh, Using a steady-state model of an aluminum reduction cell to investigate the impact of design changes, Light Metal, 1996, 417-429.
[19] I. Tabsh, M. Dupuis. A. Gomes, Process simulation of aluminum reduction cells, Light Metals, 1996, 451-457.
[20] I. Tabsh, M. Dupuis, Simulation of the dynamic response of aluminum reduction cells, Light Metals, 1997, 443-447.
[21] T. C. Hou, J. P. Lynch, Electrical impedance tomographic methods for sensing strain fields and crack damage in cementitious structures, Journal of Intelligent Material Systems and Structures, 20, 2009, 1363-1379.
[22] H. Fortin, Modélisation du comportement thermo-électro-mécanique de l'anode de carbone utilisée dans la production primaire de l'aluminium, Masters thesis, University of Laval, 2009.
![Figure 1: Current flow in an aluminum smelting cell [6]](https://thumb-eu.123doks.com/thumbv2/123doknet/7597259.232797/1.918.485.828.480.692/figure-current-flow-aluminum-smelting-cell.webp)
![Figure 6: Evolution of the electrical contact resistance as a function of contact pressure [22]](https://thumb-eu.123doks.com/thumbv2/123doknet/7597259.232797/3.918.485.820.728.975/figure-evolution-electrical-contact-resistance-function-contact-pressure.webp)
![Figure 10: Schematic representation of the specific electrical resistivity measurement apparatus (SERMA) [12]](https://thumb-eu.123doks.com/thumbv2/123doknet/7597259.232797/5.918.91.393.111.239/figure-schematic-representation-specific-electrical-resistivity-measurement-apparatus.webp)
