HAL Id: hal-01788952
https://hal-amu.archives-ouvertes.fr/hal-01788952
Submitted on 9 May 2018
HAL is a multi-disciplinary open access archive for the deposit and dissemination of sci-entific research documents, whether they are pub-lished or not. The documents may come from teaching and research institutions in France or abroad, or from public or private research centers.
L’archive ouverte pluridisciplinaire HAL, est destinée au dépôt et à la diffusion de documents scientifiques de niveau recherche, publiés ou non, émanant des établissements d’enseignement et de recherche français ou étrangers, des laboratoires publics ou privés.
Optical response of heterogeneous layer containing silver
nanospheres and nanoprisms
Miriam Carlberg, Florent Pourcin, Olivier Margeat, Judikaël Le Rouzo,
Rose-Marie Sauvage, Gérard Berginc, Jörg Ackermann, Ludovic Escoubas
To cite this version:
Miriam Carlberg, Florent Pourcin, Olivier Margeat, Judikaël Le Rouzo, Rose-Marie Sauvage,
et al.. Optical response of heterogeneous layer containing silver nanospheres and nanoprisms.
EMRS 2016 symposium Light interaction with nanomaterials, 2016, Lille, France. pp.3 - 11,
ScienceDirect
Materials Today: Proceedings 4 (2017) S3–S11 www.materialstoday.com/proceedings
2214-7853 © 2017 Elsevier Ltd.
This is an open access article under the CC BY-NC-ND license (http://creativecommons.org/licenses/by-nc-nd/4.0/).
Selection and Peer-review under responsibility of conference committee members of EMRS 2016 symposium Light interaction with nanomaterials.
EMRS 2016
Optical response of heterogeneous layer containing silver
nanospheres and nanoprisms
Miriam Carlberg
a, Florent Pourcin
b, Olivier Margeat
b, Judikaël Le Rouzo
a, Rose-Marie
Sauvage
c, Gérard Berginc
d, Jörg Ackermann
b, Ludovic Escoubas
a*
aAix Marseille Univ, Univ Toulon, CNRS, IM2NP, Marseille, France bAix Marseille Univ, CNRS, CINAM, Marseille, France
cDGA/DS/MRIS, 75015 Paris, France dThales Optronics, Elancourt, France
Abstract
This study focuses on the control of the light matter phenomenon in the visible wavelength range. In order to absorb the incoming light, silver nanospheres and nanoprisms are chemically synthesized and embedded in a non-absorbing and transparent polymer host matrix. By combining nanospheres and nanoprisms in the same thin film layer, the plasmonic absorption peaks of nanospheres and nanoprisms are combined. Aggregates of nanospheres and nanoprisms lead to a redshift and broaden the absorbance peak, as expected by finite difference time domain simulations.
© 2017 Elsevier Ltd. This is an open access article under the CC BY-NC-ND license (http://creativecommons.org/licenses/by-nc-nd/4.0/).
Selection and Peer-review under responsibility of conference committee members of EMRS 2016 symposium Light interaction with nanomaterials.
Keywords: metallic nanoparticles; plasmonics; thin film layers; optical properties.
This is an open-access article distributed under the terms of the Creative Commons Attribution-NonCommercial-ShareAlike License, which
permits non-commercial use, distribution, and reproduction in any medium, provided the original author and source are credited. * Corresponding author. Tel.: + 33 (0) 4 91 28 86 15; fax: +33 (0) 4 91 28 88 52.
S4 M. Carlberg / Materials Today: Proceedings 4 (2017) S3–S11
1. Introduction
The control of the light-matter phenomenon is currently a hot topic. The use of nanoparticles (NP), and especially metallic NP, to control the optical properties of matter are under investigation in various domains for applications in photovoltaics [1] or sensors [2]. The interaction of metallic NP with light is dominated by localized surface plasmon resonances. These resonances enhance the optical properties of the NP: depending on their morphological properties, i.e. their constituting material, size, shape, and environment, absorption or scattering will be predominant in their light matter interaction [3-5]. This motivates the research on syntheses producing differently shaped NP [6-8]. Once the NP are synthesized, their optical properties are generally investigated by computer simulations, single NP measurements or in colloidal solutions [9].
In our study, we focused on the need for a perfect absorber in the visible wavelength range. We chose to synthesize silver NP for their ability to be synthesized in solution and their plasmonic absorption properties through the visible wavelength range [10].
The colloidal solutions of nanospheres and nanoprisms absorb from 380 to 800 nm depending on their size. In order to combine the optical properties, nanospheres and nanoprisms were mixed together in solution and then deposited in a non-absorbing and transparent polymer thin film layer. Optical measurements indicate an addition of the different plasmonic peaks, corresponding to the nanospheres and nanoprisms, and broadening, due to the spatial arrangement and aggregation of the NP in solution and in the thin films. Performed computer simulations by finite difference time domain (FDTD) allow us to validate our measurements.
2. Experimental 2.1. Materials
Silver nitrate (AgNO3) (Sigma-Aldrich, 99.9999%), sodium borohydride (NaBH4) (Sigma-Aldrich), trisodium
citrate dehydrate (Sigma-Aldrich), L-ascorbic acid (Sigma-Aldrich), poly(sodium 4-styrenesulfonate) (PSSS) (Sigma-Aldrich, Mw ~ 1,000,000) and poly(vinylpyrrolidone) (PVP) (Sigma-Aldrich, Mw 55,000) were used
without further purification. Deionized water was used as solvent for all solutions.
2.2. Silver NP synthesis
Silver nanoprisms are synthesized in a two-step seed based method at room temperature and in water, following the procedure published by Aherne et al [11]. In brief, 5 mL of 0.5 mM AgNO3 is reduced by 0.3 mL of 10 mM
NaBH4 in presence of 5 mL of 2 mM trisodium citrate and 0.25 mL of 500 mg.L-1 PSSS. The AgNO3 is added drop
wise under vigorous stirring to allow homogeneous growth of the spherical seeds. The presence of trisodium citrates and PSSS during the seed growth induces defects that orient the facet selective growth of the prisms in the second step of the synthesis. In the second step of the synthesis, the quantity of the seed solution chosen determines the size of the nanoprisms produced. The quantity of seed solution diluted in 5 mL of deionized water and 75 μL of 10 mM ascorbic acid used to reduce the 3 mL of 0.5 mM AgNO3 slowly added. After synthesis, to prevent aggregation
during the centrifugation and the deposition in the thin film layer, trisodium citrates are added in excess.
After centrifugation, the size and the shape of the NP are visualized by transmission electron microscopy (TEM).
2.3. PVP host matrix
In our study, the absorption of the polymer thin film layers in the visible wavelength range should result only from the absorption of the plasmonic NP. Therefore, the host matrix is required to be non-absorbing and NP stabilizing. PVP is to our knowledge one of the best polymers available matching these requirements [12]. Spectroscopic ellipsometry measurements confirm the non-absorbing property of PVP thin film layers, as the extinction coefficient is zero from 350 to 900 nm. Furthermore, PVP is water-soluble and is therefore easily miscible with the synthesized NP.
2.4. Heterogeneous thin film layer deposition
To increase the density of nanoprisms after synthesis, a centrifugation at 5000 rpm during at least 30 min is necessary. The aggregated nanospheres and nanoprisms are then redispersed in a 40 g.L-1 PVP solution. Squared
glass substrates are cleaned by sonification in acetone, ethanol and then isopropanol followed by an ozone treatment for 10 min. The solution is then deposited by spin coating at low speed, from 500 to 1000 rpm, to prevent the NP of being ejected from the layer. The thickness of the layers is measured by mechanical stylus profilometer (Brucker Decktak XT).
2.5. Optical properties
The optical properties of the colloidal solutions and the thin film layers are obtained by a UV-vis-NIR spectrophotometer with integrating sphere (PerkinElmer, Labmda 950). The refractive index of the non-absorbing PVP layer is measured by variable angle spectroscopic ellipsometry with a rotating compensator ellipsometer (Semilab).
3. FDTD simulations
FDTD simulations are performed under the commercial software Lumerical. The simulated NP are designed according to the information taken from the TEM images. As the corners of the synthesized nanoprisms are not sharp, rounded corners are used for the simulated nanoprisms. A corner radius of 2 nm matches the TEM images the best. The optical indices of silver were taken from Johnson and Christy [13], the refractive index of water is set to 1.33 over the whole visible wavelength range and the real and imaginary part of the optical indices of the PVP host matrix, determined by spectroscopic ellipsometry, are added to the material database of Lumerical.
The absorption and scattering cross sections, of single NP, are calculated by integrating the Poynting vector of the total and scattered fields. These calculations of NP of a broad size range give us clear insight into the size properties of the NP, which are necessary to maximize the absorption of light, while covering the whole visible wavelength. The calculated cross sections are normalized by dividing the cross section by the cross sectional area S of the NP yielding the absorption of scattering efficiency Qabs,scat=abs,scat/S.
The studied NP is placed within a finite simulation region with perfectly matched layer absorbing boundary conditions. The mesh is optimized to the NP geometry to maximize simulation accuracy, while minimizing the calculation time.
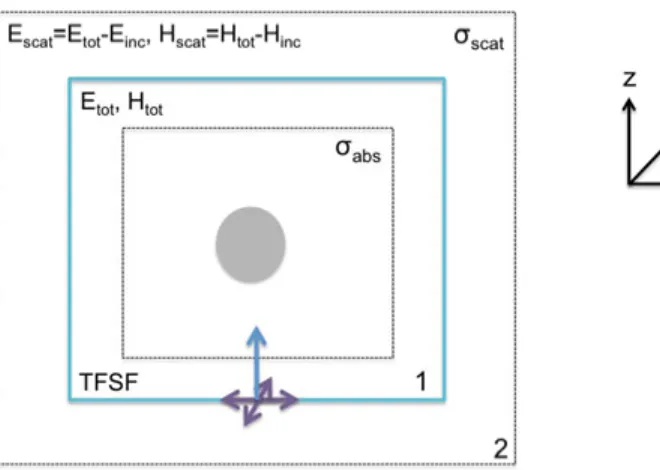
A total-field/scattered-field (TFSF) linearly light source is used. This configuration divides the simulation region in two distinct areas: region 1 and region 2 (Fig.1). Region 1 contains the NP, the TFSF source and the total electric field Etot and magnetic field Htot. In region 2, the incident electromagnetic fields are subtracted to the total
electromagnetic fields. Therefore, only the scattered fields are remaining in this region: Escat=Etot-Einc and Hscat=Htot
-Hinc.
The scattering cross section scat is then easily calculated by placing monitors outside the TFSF source, while the
absorption cross section abs is obtained by taking the complementary of total cross section inside region 1. The light
source, visualized by the blue arrow on Fig. 1, is injected along the z-axis. The purple arrows show the polarization direction: the P-polarization, along the x-axis, and S-polarization, along the y-axis, are investigated for the nanoprism. As our study focuses on the properties of the NP in the visible wavelength range, the NP are studied under light from 350 nm to 900 nm.
S6 M. Carlberg / Materials Today: Proceedings 4 (2017) S3–S11
Fig. 1.Cross section of the TFSF source configuration.
The experimental results will be compared to the calculated properties of the NP to validate them and increase our knowledge of the interactions on the nanometer scale.
4. Results and discussions 4.1. Colloidal solution
The first step of the nanoprism synthesis produces seeds that are near-spherical NP. The size of the synthetized nanoprisms is dependent on the chosen quantity of the seed, as the reduced silver ions are deposited on preferential facets of the seeds. To obtain different absorption peaks in our thin film layers, differently shaped NP should be deposited together. In a first step, we analyze the optical properties of a colloidal solution containing nanospheres and nanoprisms. The question we would like to answer is how the different NP will interact and modify the optical properties.
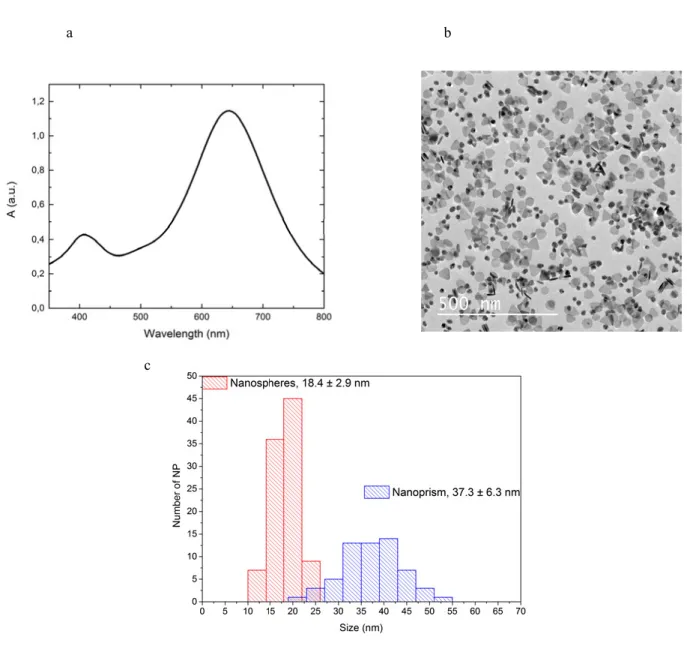
The NP in the colloidal solution are homogeneously suspended in water, i.e. the solution is blue and no aggregates are visible. The absorbance plot (Fig. 2a) displays two distinct peaks. The first peak at 410 nm corresponds to the dipolar resonance of the nanospheres, while the peak at 645 nm corresponds to the dipolar plasmon resonance of the nanoprisms. The size of the spheres and prisms are determined by TEM images (Fig. 2b,c).
The average diameter of the nanospheres is 18.4 nm and the average edge size of the nanoprisms is 37.3 nm. The thickness of the nanoprisms is known to be constant and is measured to be equal to 10 nm.
To investigate the nature of these two peaks, FDTD simulations are performed on a colloidal solution of 20 nm diameter silver nanospheres and 40 nm edge size silver nanoprisms that displays two distinct absorbance peaks.
4.2. Simulation results in water
The absorption and scattering cross sections, normalized to geometrical cross sections of the NP, of single nanosphere and nanoprism are calculated in water and in a PVP layer. The optical indices of silver are taken from Johnson and Christy [13]. The refractive index of water is set to 1.33 and the refractive index of the PVP layer is determined by spectroscopic ellipsometry. These calculations permit us to verify the positions of the absorbance peaks of the colloidal solution and the heterogeneous thin film layer.
Fig. 2. (a) absorbance of colloidal solution of nanospheres and nanoprisms; (b) TEM image of colloidal solution, (c) size-histogram analysis.
In a first step the absorption and scattering efficiencies, i.e. Qabs and Qscat, of 20 nm diameter nanosphere and 40
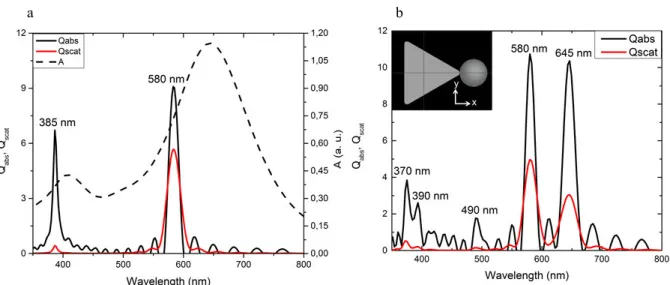
nm edge size nanoprism in water are investigated. As our solution contains nanospheres and nanoprisms, the efficiencies are added together in Fig. 3a. It is worth noting, that the absorption efficiency is dominant for this two-NP system, but the Qscat is not negligible for a 40 nm edge size nanoprism.
By comparing the calculated wavelengths at which the NP should absorb with the measured values, it is striking that other phenomena must be taken into account. First of all, the size disparity of the NP results in a broader absorbance peak.
It has also been reported, that the optical properties of single NP versus multiple NP are redshifted due to collective resonances [14]. Furthermore, the NP may arrange themselves in aggregates despite the fact that a surfactant, trisodium citrate, is added to prevent this. Further calculations are therefore performed to take this into account (Fig. 3b).
a b
S8 M. Carlberg / Materials Today: Proceedings 4 (2017) S3–S11
Fig. 3. Calculated Qabs and Qscat (a) for separated NP and the A of the colloidal solution, (b) for two NP system as depicted in insert. A 20 nm nanosphere is attached to a tip of the 40 nm edge size nanoprism. The incident light source is polarized along x and y. The optical properties of the system are strongly polarization dependent. When the polarization is along y, the light sees two distinct NP, resulting in the two absorption peaks at 390 nm for the dipolar resonance of the nanospheres and at 580 nm for the dipolar resonance of the nanoprism. When the light is polarized along x, different peaks arise as the one at 645 nm corresponding to the dipolar resonance of the two NP system. The incoming light perceives the sphere and the prism as a single dipole, whose resonance wavelength is situated at 645 nm.
By analyzing the electric field enhancement cartographies, the nature of the peak appearing at 490 nm is determined. This peak results from an electric field enhancement at the exact position where the two NP are in contact.
When taking into account the different configurations in which the nanospheres and nanoprisms may be arranged in the solution, the measured absorbance of the colloidal solution (Fig. 2a) is obtained. In a next step, the synthesized nanospheres and nanoprisms are deposited in a PVP layer on a glass substrate.
4.3. Heterogeneous thin film layer
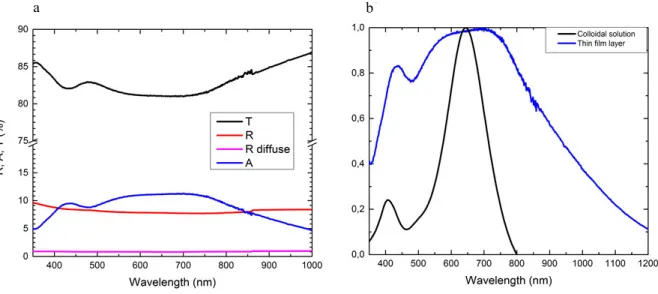
The nanospheres and nanoprisms analyzed in water are embedded in a PVP layer on a glass substrate. The measured reflectance (R) and transmittance (T) of the thin film layer are used to calculate the film absorbance A as A= 1 – R – T (Fig. 4a). The measured diffuse reflectance is about 1% and constant through the visible spectrum. It can therefore be assumed that the primary interaction of our NP results in light absorption.
When comparing the absorbance of the thin film layer with the absorbance of the colloidal solution the well-known and expected redshift of the plasmonic peaks is seen and a broadening of the second peak around 645 nm is measured.
It is well-known that the plasmonic resonances of the NP depends on the environment medium. PVP having a higher refractive index than water, the resonance peaks are theoretically expected to be redshifted. Experimentally, this is verified (Fig. 4b). The dipolar absorption peak of the nanospheres in water has a full width at half maximum (FWHM) of 55 nm and is centered at 405 nm. In the PVP layer, it is measured to be at 435 nm with the same FWHM, inducing a redshift of 30 nm.
On the contrary, the dipolar absorption peak of the nanoprisms is considerably broadened. In water, it shows a FWHM of 150 nm and is centered at 645 nm. When dispersed in PVP, the peak is centered around 660 nm and considerably broadened.
Fig. 4. (a) Measured R,T and A of heterogeneous thin film layer; (b) measured normalized A of colloidal solution and thin film layer.
Taken together, nanospheres and nanoprisms are successfully embedded in a non-absorbing polymer layer. Two distinct absorbance peaks are measured in the thin film layer. The dipolar absorbance peak of the nanospheres is redshifted without broadening of the peak, while the dipolar plasmonic peak corresponding to the nanoprisms does not follow the predicted redshift as it is considerably broadened. To investigate the redshift, FDTD simulations are performed in PVP matrix.
4.4. Simulations results in PVP
To verify the measured redshift, the nanosphere-nanoprism system is introduced into a PVP layer. According to our FDTD simulations (Fig. 5), the absorbance due to the nanospheres in the thin film layer, averaged at 430 nm, compared to the absorbance in water (Fig. 3b), averaged at 380 nm, is redshifted of 50 nm. Experimentally, as described above, we measured a redshift of 30 nm.
The absorbance peaks resulting from the plasmonic contributions of the nanoprisms are calculated to be redshifted of about 100 nm.
The introduction of the nanoprisms in the PVP only induces a redshift of the absorbance. The measured blueshift is therefore rather due to aggregation in the thin film layer. In summary, the measured redshift is verified, but the broadening of the measured absorbance is not fully understood, and a better surfactant is therefore needed.
a b
S10 M. Carlberg / Materials Today: Proceedings 4 (2017) S3–S11
Fig. 5. calculated Qabs and Qscat of the nanosphere-nanoprism system and measured A in PVP.
5. Conclusion
In conclusion, a mixture of synthetized nanospheres and nanoprisms are optically characterized in solution and as thin film in a polymer layer. The measurements are coupled to FDTD simulations in order to determine the nature of the different measured absorbance peaks. It is concluded, that the colloidal mixture optically results in an addition of the dipolar resonances of the nanosphere and nanoprisms, plus a broadening due to aggregation of the NP. The introduction of the NP mixture in a polymer layer results in two peaks. While the plasmonic absorbance of the nanospheres is only redshifted, the second absorbance peak is slightly redshifted and considerably broadened. This peak results from plasmonic absorption of the nanoprisms and from the combination of nanoprisms and nanospheres due to aggregation of the NP.
Future work will be focused on minimizing aggregation by the use of other surfactants and on the mixing of other types of NP in the layers or with higher NP densities in order to increase the absorbance.
Acknowledgements
We thank the Direction Générale de l'Armement (DGA) for a financial support to Miriam Carlberg and Florent Pourcin.
References
[1] H.A. Atwater, A. Polman Nat. Mater. 9 (2010) 205–213.
[2] J.N. Anker, W.P. Hall, O. Lyandres, N. C. Shah, J. Zhao, R. P. V. Duyne Nat. Mater. 7 (2008) 442–453. [3] D. Bohm, D. Pines Phys. Rev. 82 (1951) 625.
[4] R. H. Ritchie Phys. Rev. 106 (1957) 874.
[5] K. L. Kelly, E. Coronado, L. L. Zhao, G. C. Schatz The Journal of Physical Chemistry B 107(3) (2003) 668-677. [6] Y. Xia, X. Xia Y. Wang, S. Xie Mrs Bulletin 38(04) (2013) 335-344.
[8] C. J. Murphy, T. K. Sau, A. M. Gole, C. J. Orendorff, J. Gao, L. Gou, S. E. Hunyadi, T. Li The Journal of Physical Chemistry B 109(29) (2005) 13857-13870.
[9] M. Pelton, J. Aizpurua, G. Bryant, Laser & Photonics Reviews 2(3) (2008) 136-159. [10] D. D. Evanoff, G. Chumanov, ChemPhysChem 6(7) (2005) 1221-1231.
[11] D. Aherne, D. M. Ledwith, M. Gara,J. M. Kelly Advanced Functional Materials 18(14) (2008) 2005-2016. [12] S. Malynych, I. Luzinov, G. Chumanov The Journal of Physical Chemistry B 106(6) (2002) 1280-1285. [13] P. B. Johnson, R. W. Christy Physical review B 6(12) (1972) 4370.