HAL Id: tel-03019203
https://hal.archives-ouvertes.fr/tel-03019203
Submitted on 23 Nov 2020
HAL is a multi-disciplinary open access
archive for the deposit and dissemination of sci-entific research documents, whether they are pub-lished or not. The documents may come from teaching and research institutions in France or abroad, or from public or private research centers.
L’archive ouverte pluridisciplinaire HAL, est destinée au dépôt et à la diffusion de documents scientifiques de niveau recherche, publiés ou non, émanant des établissements d’enseignement et de recherche français ou étrangers, des laboratoires publics ou privés.
network via a ”simulation game”
Humberto Gonzalez Ramirez
To cite this version:
Humberto Gonzalez Ramirez. Study of the choice behaviour of travellers in a transport network via a ”simulation game”. Modeling and Simulation. Université de Lyon, 2020. English. �tel-03019203�
No d’ordre NNT: 2020LYSET008
Th`
ese de doctorat de l’universit´
e de Lyon
Op´er´ee au sein de
l’´
Ecole Nationale des Travaux Publics de l’´
Etat
´
Ecole Doctorale
No 162MEGA (M´
ecanique, Energ´
etique, G´
enie Civil et Acoustique)
Sp´
ecialit´
e / discipline de doctorat : G´
enie Civil
´
Etude des choix des usagers dans les r´
eseaux
de transport grˆ
ace `
a un “jeu de simulation”
Soutenue publiquement le 13 mai 2020 par :
Humberto Gonz´
alez Ram´ırez
Devant le jury compos´e de :
Emma FREJINGER Prof. (Universit´e de Montr´eal) Rapporteure
Francesco VITI Prof. (Universit´e du Luxembourg) Rapporteur
Christine SOLNON Prof. (INSA Lyon) Pr´esidente du jury
Eric GONZALES Prof. (University of Massachusetts Amherst) Examinateur
Ludovic LECLERCQ Prof. (Univ. Lyon, ENTPE, IFSTTAR) Directeur de th`ese
Nicolas CHIABAUT Prof. (Univ. Lyon, ENTPE, IFSTTAR) Co-directeur de th`ese
Thesis National Number: 2020LYSET008
A Thesis of the University of Lyon
Prepared at´
Ecole Nationale des Travaux Publics de l’´
Etat
Doctoral school
No. 162MEGA (Mechanics, Energy, Civil Engineering and Acoustics)
To obtain the graduation of
PhD in Civil Engineering
Study of the choice behaviour of travellers in
a transport network via a “simulation game”
Defended on May 13, 2020 by:
Humberto Gonz´
alez Ram´ırez
In front of the following examination committee:
Emma FREJINGER Prof. (Universit´e de Montr´eal) Reviewer
Francesco VITI Prof. (Universit´e du Luxembourg) Reviewer
Christine SOLNON Prof. (INSA Lyon) Committee president
Eric GONZALES Prof. (University of Massachusetts Amherst) Examiner
Ludovic LECLERCQ Prof. (Univ. Lyon, ENTPE, IFSTTAR) Supervisor
Nicolas CHIABAUT Prof. (Univ. Lyon, ENTPE, IFSTTAR) Cosupervisor
Abstract
Over the past century, cities around the world have experienced rapid growth in their popula-tions. As a consequence, the capacity of their transport networks has been exceeded, causing traffic congestion problems that are associated to economic losses, high levels of air pollution and the emission of greenhouse gases. It is in this context that it is important to implement traffic regulation strategies to mitigate congestion. Traffic simulators are essential tools for developing and testing such strategies. The traffic conditions in the transport network are con-sequence of the travellers’ choices at any given time, but at the same time, the traffic conditions on the network influence the decisions of the travellers. This relationship between travellers’ decisions and network traffic is the main idea in traffic assignment, which traffic simulators use to produce network traffic patterns. It is in this sense that understanding and approximating the behaviour of travellers is indispensable to forecast the states of a transportation network, which could help design regulations to alleviate congestion.
The objective of this thesis is to find route choice models that scale-up at network level, i.e., models that predict the choices of travellers over the diversity of situations found in a transport network. The approach in this thesis to investigate travellers’ behaviour in transportation networks is through computer-based experiments at large scale, for which a platform named the Mobility Decision Game (MDG), has been developed. The MDG permits to observe the choices of the participants on a diverse set of scenarios (OD pairs and routes) with varying traffic conditions and travel time information. In this thesis, the experiments focus on the route choices of uni-modal car trips that are based on the map of the city of Lyon, France. To attain the objective of this thesis, firstly a methodology to find OD pairs that are representative of the whole network is proposed. The representative OD pairs are then used in route choice experiments to obtain data to estimate choice models that generalise to the various OD pair configurations in the network. Secondly, the choices of participants in the experiments are analysed from the rational and boundedly rational behaviour perspectives in order to establish the principle that best describe their choices. Finally, the choice models are assessed in terms of their predictive accuracy. This thesis is part of a European ERC project entitled MAGnUM: Multiscale and Multimodal Traffic Modeling Approach for Sustainable Management of Urban Mobility.
R´
esum´
e
Au cours du si`ecle dernier, les villes du monde entier ont connu une croissance rapide de leur population. En cons´equence, la capacit´e de leurs r´eseaux de transport a ´et´e d´epass´ee, entraˆınant des probl`emes de congestion du trafic qui sont `a leur tour associ´es `a des pertes ´economiques, `
a des niveaux ´elev´es de pollution atmosph´erique et `a l’´emission de gaz `a effet de serre. C’est dans ce contexte qu’il est important de mettre en œuvre des strat´egies de r´egulation du trafic pour att´enuer les encombrements. Les simulateurs de trafic sont essentiels au d´eveloppement et au test de telles strat´egies. Les conditions de circulation dans le r´eseau de transport sont la cons´equence des choix des voyageurs `a un moment donn´e, mais en mˆeme temps, les conditions de circulation sur le r´eseau influencent les d´ecisions des voyageurs. Cette relation entre les d´ecisions des voyageurs et le trafic r´eseau est l’id´ee principale de l’attribution du trafic, que les simulateurs de trafic utilisent pour produire des mod`eles de trafic r´eseau. C’est en ce sens que la compr´ehension et l’approximation du comportement des voyageurs sont indispensables pour pr´evoir les ´etats d’un r´eseau de transport, ce qui pourrait aider `a concevoir des r´eglementations pour r´eduire la congestion.
Lorsqu’ils voyagent dans une ville, les voyageurs sont confront´es `a plusieurs d´ecisions con-cernant (i) l’activit´e `a entreprendre, (ii) la destination du voyage, (iii) le mode de transport, (iv) l’heure de d´epart et (v) l’itin´eraire. Ces d´ecisions individuelles fa¸connent les ´etats du trafic dans le r´eseau de transport `a un moment donn´e. Cependant, en mˆeme temps que les ´etats du r´eseau sont la cons´equence des choix des voyageurs, les caract´eristiques et les ´etats de trafic du r´eseau influencent les d´ecisions des voyageurs. On pourrait penser, par exemple, aux voyageurs qui adaptent leur heure de d´epart et leurs choix d’itin´eraire en anticipant des embouteillages sur la route habituelle. Cette relation bidirectionnelle entre le comportement des voyageurs et la dynamique du trafic est l’id´ee centrale des probl`emes d’affectation du trafic et elle est ´
etudi´ee sous deux angles diff´erents. Le premier est li´e au probl`eme d’affectation du trafic, dans lequel les mod`eles de trafic au niveau du r´eseau sont obtenus `a la suite des interactions entre les choix de tous les voyageurs dans le r´eseau de transport, sur la base d’hypoth`eses g´en´erales sur l’´equilibre du r´eseau. Le second est li´e aux choix des voyageurs, avec un accent particulier sur l’identification et la classification des facteurs qui influencent leurs choix.
´
echelle. En d’autres termes, des mod`eles qui font des pr´edictions pr´ecises dans toutes les paires origine-destination (OD) dans un r´eseau de transport urbain, mais qui sont estim´es avec des observations sur un nombre limit´e de paires OD. L’id´ee g´en´erale est de mettre en œuvre, `a l’avenir, ces mod`eles de choix dans des algorithmes d’affectation dynamique du trafic, et ainsi d’obtenir des sch´emas de trafic simul´es dans une perspective comportementale. Les mod`eles de choix sont d´eduits des donn´ees collect´ees par des exp´eriences informatiques r´ealis´ees sur une plateforme informatique Mobility Decision Game (MDG). Cependant, comme les choix des voyageurs ne peuvent pas ˆetre observ´es dans un si grand nombre de paires de OD et d’itin´eraires que l’on trouve dans un r´eseau urbain, une m´ethodologie pour collecter les observations des choix des voyageurs par des exp´eriences informatiques est d’abord n´ecessaire. Les mod`eles estim´es avec des donn´ees provenant de cette m´ethodologie devraient pouvoir ´evoluer, d’un petit ensemble de paires de OD observables, jusqu’au niveau du r´eseau complet. D’une mani`ere g´en´erale, les objectifs de cette th`ese sont :
1. Framework for the estimation of choice models at full-scale network level. Concerne la conception d’exp´eriences, l’exp´erimentation et la g´en´eralisation des choix observ´es au r´eseau grandeur nature. Celui-ci comprend l’´echantillon d’un petit ensem-ble de paires OD et d’itin´eraires du r´eseau routier de la ville de Lyon en France, sur lesquels se d´eroulent les exp´eriences d’itin´eraires et d’heures de d´epart. L’´echantillon doit ˆetre repr´esentatif du r´eseau routier, et les choix observ´es sur ces paires OD et ces itin´eraires doivent se g´en´eraliser au niveau du r´eseau `a grande ´echelle. En d’autres ter-mes, les mod`eles de choix estim´es avec des donn´ees sur les petites paires et itin´eraires OD repr´esentatifs doivent approximer avec une bonne pr´ecision les choix dans l’ensemble du r´eseau.
2. Sp´ecification et s´election d’un mod`ele de choix. Il s’agit de trouver, sur la base des
r´esultats de l’analyse quantitative des r´esultats des exp´eriences sur les MDG, un mod`ele de choix d’itin´eraire et d’heure de d´epart qui fait des pr´edictions pr´ecises. L’impact des attributs des paires OD et des itin´eraires, les informations de temps de trajet fournies aux participants, ainsi que l’h´et´erog´en´eit´e des pr´ef´erences des voyageurs sont pris en compte par les mod`eles.
Afin d’estimer et de tester diff´erents mod`eles de choix, le comportement des voyageurs doit ˆ
etre observ´e. L’approche de cette th`ese pour ´etudier le comportement des voyageurs dans les r´eseaux de transport passe par des exp´eriences informatiques `a grande ´echelle, pour lesquelles une plateforme nomm´ee Mobility Decision Game (MDG) a ´et´e d´evelopp´ee. Contrairement `
a d’autres exp´eriences pr´ef´erence d´eclar´e, le MDG permet d’observer les choix d’un grand nombre de participants dans diff´erentes situations (voir Fig. 1), ce qui est essentiel pour inf´erer
des mod`eles de choix au niveau du r´eseau `a grande ´echelle. Le MDG est un jeu informatique bas´e sur le Web con¸cu pour confronter les participants `a des probl`emes de d´ecision concernant l’heure de d´epart et les choix d’itin´eraire pour effectuer un voyage. Les probl`emes de d´ecision sont plac´es sous diff´erents sc´enarios hypoth´etiques, comprenant des paires OD reli´ees par trois itin´eraires alternatifs avec des attributs contrast´es et des conditions de trafic variables. Les sc´enarios se produisent dans un environnement simul´e dynamiquement du r´eseau r´eel de la ville de Lyon, en France, dans lequel les conditions de circulation sont g´en´er´ees en temps r´eel par un seul simulateur microscopique dynamique. Au cours d’une exp´erience MDG, plusieurs paires de OD sont attribu´ees aux participants, ce qui permet d’observer les choix des mˆemes participants dans diff´erentes paires de OD. En outre, certains des participants peuvent recevoir des informations sur la circulation sous forme de temps de trajet.
Figure 1: Deux paires OD jointes par trois voies pour l’exp´erience MDG. Les exp´eriences con-sistent `a choisir un itin´eraire sur trois pour effectuer un voyage. Les conditions de circulation et les attributs d’itin´eraire variables permettent d’observer les choix des voyageurs dans diff´erentes situations sur la ville de Lyon en France.
Le mod`ele adopt´e dans cette th`ese pour pr´edire les choix des voyageurs est le mod`ele mixed logit (McFadden, 1984, McFadden and Train, 2000), qui appartient au cadre de maximisa-tion de l’utilit´e al´eatoire (Mcfadden, 1972). Ce cadre suppose que les individus obtiennent un certain niveau d’utilit´e de chaque alternative dans une situation de choix, et qu’ils choisis-sent l’alternative avec l’utilit´e maximale, c’est-`a-dire que les individus sont des maximiseurs d’utilit´e. Dans les mod`eles de maximisation d’utilit´e al´eatoires, l’utilit´e obtenue `a partir d’une alternative est li´ee aux attributs de l’alternative et du d´ecideur. En cons´equence, les choix des d´ecideurs s’expliquent par des variables mesurables et qui d´ependent de la paire OD et
param`etres du mod`ele est petit, et celles-ci peuvent ˆetre facilement d´eduites des donn´ees, ob-tenant des repr´esentations succinctes de l’utilit´e et des probabilit´es de choix. Par cons´equent, les mod`eles de maximisation de l’utilit´e al´eatoire sont bien adapt´es pour la pr´ediction des choix des voyageurs sur un r´eseau `a grande ´echelle. Une s´election rigoureuse des sc´enarios sur lesquels ´
evoluent les exp´eriences des MDG permet d’estimer des mod`eles de choix qui se g´en´eralisent bien au niveau du r´eseau `a grande ´echelle, et de tester et s´electionner la sp´ecification du mod`ele qui repr´esente le mieux les choix des participants aux exp´eriences.
Plan de la th`
ese
Cette th`ese comprend quatre ´etudes sur le comportement des voyageurs. Ces ´etudes sont toutes bas´ees sur les donn´ees obtenues par des exp´eriences informatis´ees de parcours et d’heures de d´epart, r´ealis´ees avec la plateforme Mobility Decision Game. Le deuxi`eme chapitre de la th`ese pr´esente cette plateforme. Par la suite, les quatre ´etudes sont pr´esent´ees, organis´ees en deux parties : la premi`ere consacr´ee au comportement de choix d’itin´eraire et la seconde au comportement de choix d’itin´eraire commun et d’heure de d´epart. Une br`eve description des chapitres de la th`ese est donn´ee ci-dessous.
Chapitre 2. Ce chapitre pr´esente le MDG, une plate-forme informatique (d´evelopp´ee par le laboratoire LICIT) pour ´etudier le comportement des voyageurs dans les r´eseaux de trans-port `a grande ´echelle. Le MDG est un jeu informatique bas´e sur le Web con¸cu pour con-fronter les participants `a une vari´et´e de probl`emes de d´ecision concernant le mode, l’heure de d´epart et les choix d’itin´eraire pour effectuer un voyage. Les probl`emes de d´ecision sont plac´es sous diff´erents sc´enarios hypoth´etiques, c’est-`a-dire des paires OD jointes par trois itin´eraires alternatifs qui contrastent dans leurs attributs et avec des temps de tra-jet variables. Cela permet d’´etudier les d´eterminants des d´ecisions des participants dans diff´erentes circonstances.
Part I: Choix d’itin´eraire
Chapitre 3. Ce chapitre pr´esente une br`eve revue de la litt´erature sur le comportement des voyageurs. L’objectif est de fournir une classification grossi`ere des lignes de recherche sur les ´etudes qui se trouvent dans la litt´erature, en mentionnant certains des aspects du comportement des voyageurs qui ont ´et´e largement ´etudi´es. Ensuite, une revue de la litt´erature sur les mod`eles de choix discrets est donn´ee. L’accent est mis sur la d´erivation et l’estimation du mod`ele logit mixte, qui est l’approche de mod´elisation choisie dans cette th`ese.
Chapitre 4. Dans un r´eseau `a grande ´echelle, les voyages sont effectu´es dans des milliers de paires origine-destination (OD) reli´ees par plusieurs itin´eraires, r´esultant en un grand nombre d’alternatives aux caract´eristiques diverses qui influencent le comportement de choix d’itin´eraire des voyageurs. Par cons´equent, pour pr´edire avec pr´ecision les choix des utilisateurs `a l’´echelle du r´eseau, un mod`ele de choix d’itin´eraire doit ˆetre ´evolutif pour s’adapter `a toutes les configurations possibles qui peuvent ˆetre rencontr´ees. Dans ce chapitre, une nouvelle m´ethodologie pour obtenir un tel mod`ele est propos´ee. L’id´ee prin-cipale est d’utiliser partitionnement de donn´ees pour obtenir un petit ensemble de paires et d’itin´eraires OD repr´esentatifs qui peuvent ˆetre ´etudi´es en d´etail par des exp´eriences de choix d’itin´eraire informatique pour recueillir des observations sur le comportement des voyageurs. Les r´esultats sont ensuite mis `a l’´echelle vers toutes les autres paires OD du r´eseau. Il a ´et´e constat´e que 9 configurations de paires OD sont suffisantes pour repr´esenter le r´eseau de Lyon, en France, compos´e de 96 096 paires OD et 559 423 itin´eraires. Les observations, recueillies sur ces neuf configurations de paires OD repr´esentatives, ont ´et´e utilis´ees pour estimer trois mod`eles logit mixtes. La pr´ecision pr´edictive des trois mod`eles a ´et´e test´ee par rapport `a la pr´ecision pr´edictive des mˆemes mod`eles (avec la mˆeme sp´ecification), mais estim´ee sur des configurations de paires OD s´electionn´ees au hasard. Les r´esultats obtenus montrent que les mod`eles estim´es avec les paires OD repr´esentatives sont sup´erieurs en pr´ecision pr´edictive, sugg´erant ainsi l’extension `a l’ensemble du r´eseau des choix des participants sur les configurations de paires OD repr´esentatives, et validant la m´ethodologie de cette ´etude.
Chapitre 5. Des ´etudes empiriques r´ecentes ont r´ev´el´e que les choix d’itin´eraire des voyageurs s’´ecartent de la rationalit´e parfaite, en montrant que les d´eplacements urbains ne suivent pas n´ecessairement les itin´eraires les plus courts (Papinski et al.,2009,Thomas and Tutert,
2010, Zhu and Levinson, 2015, Hadjidimitriou et al., 2015, Yildirimoglu and Kahraman,
2018b). Cependant, il n’y a pas de consensus sur la mesure dans laquelle le comportement de choix d’itin´eraire des voyageurs s’´ecarte de l’hypoth`ese rationnelle parfaite. L’objectif de cette ´etude est de contribuer `a la compr´ehension de la fa¸con dont les voyageurs traitent le temps de trajet lorsqu’ils font des choix d’itin´eraire et de quantifier dans quelle mesure les utilisateurs sont des minimiseurs de temps de trajet stricts ou si une rationalit´e limit´ee est observ´ee. La question de savoir si les voyageurs ´evaluent les diff´erences de temps de voyage en termes absolus ou relatifs est ´egalement abord´ee, et l’h´et´erog´en´eit´e du com-portement de choix d’itin´eraire des voyageurs a ´et´e ´etudi´ee. Les r´esultats des exp´eriences informatiques de choix d’itin´eraire, ax´es sur les choix d’itin´eraire dans diverses paires OD et conditions de trafic, sont analys´es. Il a ´et´e constat´e que les voyageurs ´evaluent les diff´erences relatives plutˆot qu’absolues dans le temps de trajet. Dans 60,5% des
voy-lorsque le temps de trajet des alternatives est au moins 30% sup´erieur `a l’itin´eraire le plus rapide. Seulement 10% des individus ont choisi l’itin´eraire le plus rapide dans tous les voyages, confirmant l’hypoth`ese de rationalit´e limit´ee. Les participants pr´esentaient des bandes d’indiff´erence h´et´erog`enes en termes de temps de trajet : au moins 70% d’entre eux ne consid´ereraient pas les itin´eraires avec des temps de trajet 1,5 fois plus lents que l’alternative la plus rapide ; le participant moyen ´etait indiff´erent aux diff´erences de temps de voyage relatives inf´erieures `a 31%.
Chapitre 6. Dans ce chapitre, un mod`ele de choix qui prend en compte le comportement rationnel limit´e dans la g´en´eration des ensembles de choix des individus pour le choix de l’itin´eraire est d´evelopp´e (mod`ele BRCS). Dans le BRCS, la distribution des bandes d’indiff´erence est d´eduite de mani`ere endog`ene en estimant conjointement la g´en´eration d’ensembles de choix et les choix de route. Le mod`ele est propos´e comme alternative au mod`ele logit mixte (MXL) dans le Chapitre 5, o`u les bandes d’indiff´erence estim´ees individuellement sont estim´ees de mani`ere exog`ene et entrent ainsi dans le mod`ele en tant que variables ind´ependantes. Le mod`ele BRCS est compar´e, en termes de pr´ecision pr´edictive, au mod`ele MXL en utilisant des donn´ees synth´etiques et r´eelles, obtenues `a par-tir des exp´eriences avec la plate-forme MDG. Les r´esultats montrent que le mod`ele BRCS est capable d’inf´erer la distribution des bandes d’indiff´erence pour les donn´ees g´en´er´ees synth´etiques. De plus, pour ces donn´ees, le BRCS montre une pr´ecision pr´edictive plus ´elev´ee que le mod`ele MXL. Dans le cas des donn´ees sur les MDG, le mod`ele BRCS pr´esente une pr´ecision pr´edictive plus ´elev´ee que le MXL et le MXL avec des bandes d’indiff´erence estim´ees de mani`ere exog`ene du Chapitre 5.
Conclusions de la partie I: s´election du mod`ele de choix d’itin´eraire. En conclusion de
la partie choix de l’itin´eraire de la th`ese, la pr´ecision pr´edictive est ´evalu´ee pour diff´erentes sp´ecifications du mod`ele MXL, ainsi que du mod`ele BRCS.
Part II: Choix d’itin´eraire et d’heure de d´epart
Chapitre 7. Dans un r´eseau unimodal (trajets en voiture), l’itin´eraire et l’heure de d´epart sont deux des principales d´ecisions que les voyageurs prennent pour faire un voyage. Au niveau agr´eg´e, cela implique que les mod`eles de trafic dans le r´eseau unimodal s’expliquent principalement par la somme de ces deux choix individuels. Dans ce chapitre, le com-portement de choix de l’itin´eraire et de l’heure de d´epart des voyageurs est ´etudi´e. `A cette fin, une exp´erience qui consid`ere les deux d´ecisions simultan´ement a ´et´e r´ealis´ee `a l’aide de la plate-forme MDG. L’objectif est de comprendre quelles variables influencent
les choix conjoints d’itin´eraire et d’heure de d´epart des voyageurs, et de tester la perti-nence du mod`ele MXL pour expliquer et pr´edire ces choix. Le mod`ele conjoint propos´e ici introduit des corr´elations d´ependantes du temps dans la sp´ecification d’un mod`ele MXL. Il est important de mentionner qu’il s’agit d’une enquˆete en cours et que les r´esultats ne sont ni d´efinitifs ni complets.
Contributions
M´ethodologie pour l’estimation des mod`eles de choix d’itin´eraire au niveau du r´eseau `a grande ´echelle. Une m´ethodologie, bas´ee sur le partitionnement de donn´ees, est propos´ee pour d´eterminer un sous-ensemble optimal de paires OD sur lesquelles les exp´eriences de choix sont effectu´ees. Un centro¨ıde de cluster, ´etant l’´el´ement qui minimise la distance euclidienne `a tous les ´el´ements de cluster, peut ˆetre s´electionn´e pour repr´esenter son groupe, et l’ensemble de tous les centro¨ıdes de cluster comme repr´esentatifs de l’ensemble du r´eseau. Les paires OD obtenues avec cette m´ethodologie ont trois propri´et´es qui les rendent adapt´ees aux exp´eriences de choix de route. Premi`erement, ils couvrent une grande variabilit´e des paires OD et des routes du r´eseau, c’est-`a-dire qu’ils sont repr´esentatifs du r´eseau `a grande ´echelle. Deuxi`emement, la variance de leurs attributs est ´elev´ee, ce qui permet d’identifier l’influence de chaque attribut dans les choix des participants. Troisi`emement, le nombre de configurations OD est petit, ce qui permet de collecter suffisamment de donn´ees dans chaque paire OD. Les premi`ere et deuxi`eme propri´et´es impliquent qu’un mod`ele de choix estim´e avec des donn´ees sur les paires OD repr´esentatives se g´en´eralisera bien au reste des paires OD dans le r´eseau, dans le sens que les choix dans n’importe quelle paire OD dans le r´eseau sont pr´edits avec pr´ecision. La troisi`eme propri´et´e implique une estimation robuste des param`etres du mod`ele, c’est-`a-dire des erreurs d’estimation plus petites. Les mod`eles estim´es avec les paires OD repr´esentatives ont montr´e une pr´ecision pr´edictive plus ´elev´ee que les mod`eles estim´es avec diff´erents ensembles de paires OD.
R´esultats du comportement de choix d’itin´eraire des voyageurs. La premi`ere con-statation principale est que les voyageurs ´evaluent les diff´erences relatives plutˆot qu’absolues dans le temps de trajet. Cela signifie qu’une diff´erence de 5 minutes dans le temps de trajet p`ese diff´eremment pour des trajets de 10 et 30 minutes. Ce r´esultat a des implications pratiques pour l’estimation des mod`eles de choix d’itin´eraire, et donc dans l’affectation du trafic, o`u l’expression du temps de trajet en termes relatifs pourrait accroˆıtre le r´ealisme des pr´evisions. Une deuxi`eme constatation est qu’au niveau individuel, un petit pourcentage des participants (10%) a toujours choisi la voie la plus rapide, ces participants peuvent ˆetre consid´er´es comme parfaitement rationnels. Le comportement des autres participants peut ˆetre mieux expliqu´e
par rapport `a leur bande d’indiff´erence, et qu’au moins 70% d’entre eux ne consid´ereraient pas les itin´eraires avec des diff´erences de temps de trajet 1,5 fois plus lent que l’alternative la plus rapide. Le participant moyen n’a pas consid´er´e les itin´eraires avec des diff´erences de temps de trajet 1,3 fois plus lents que l’alternative la plus rapide.
Mod`ele de choix d’itin´eraire pour un comportement rationnellement limit´e. Un mod`ele de choix d’itin´eraire rationnellement limit´e a ´et´e propos´e: le mod`ele de rationalit´e limit´e pour la g´en´eration d’ensemble de choix (BRCS). Cette mod`ele consid`ere (i) un processus de g´en´eration d’un ensemble de choix rationnel limit´e dans lequel les itin´eraires alternatifs avec des diff´erences de temps de trajet au-dessus d’un certain seuil (bande d’indiff´erence) sont supprim´es des alternatives disponibles, et (ii) un processus de choix rationnel pour les alternatives dans l’ensemble de choix g´en´er´e. L’ensemble de choix et le choix de route sont tous deux estim´es conjointement, ce qui permet au BRCS d’inf´erer implicitement la distribution de la bande d’indiff´erence de la population latente. Le processus de g´en´eration d’ensembles de choix suppose une distribution param´etrique pour les bandes d’indiff´erence. La capacit´e du mod`ele `a d´eduire la distribution des bandes d’indiff´erence a ´et´e test´ee `a l’aide de donn´ees synth´etiques et r´eelles. Dans les deux cas, le mod`ele a donn´e une pr´ecision pr´edictive sup´erieure au mod`ele logit mixte classique.
Donn´ees sur l’itin´eraire des voyageurs et le comportement de choix de l’heure de d´epart. Une derni`ere contribution concerne les donn´ees sur les choix des voyageurs collect´ees pour l’´elaboration de cette th`ese. Les donn´ees proviennent de 16 exp´eriences, dont 9 ont ´et´e utilis´ees dans l’´elaboration de cette th`ese, totalisant 7 510 choix effectu´es par 717 participants diff´erents sur 41 paires de DO. Les donn´ees seront accessibles au public.
Cette th`ese fait partie d’un projet europ´een ERC intitul´e MAGnUM: Approche de mod´elisation du trafic multi-´echelle et multimodale pour la gestion durable de la mobilit´e urbaine.
Acknowledgements
First of all, I would like to thank my supervisors Prof. Ludovic Leclercq and Prof. Nicolas Chiabaut who gave me the opportunity to work with them at the LICIT laboratory, and then supported me throughout the three and a half years of my PhD. In short, I could say that this thesis is the result of maturing the ideas and points of view discussed during our long (very long) meetings around pages of half-baked analyses depicted in a graph. Also, I recognise the scientific freedom that I had to investigate and try these ideas.
I acknowledge all the people who made the MDG experiments possible, both from the technical and organisational tasks. Here, I mention again my supervisors, who conceived the tool and help on all tasks related to the experiments. I warmly thank C´ecile Becarie and Jean Krug, who dedicated a lot of time and effort in the developing and configuration of the MDG. This thesis would not have been possible without your work! I also thank the rest of the colleagues who helped to organise and carry out the experiments. And, of course, I thank all of the people who participated in the experiments.
I would like to express my gratitude to Prof. Emma Frejinger and Prof. Francesco Viti who accepted to review my thesis. Your comments, helped not only to improve my manuscript, but also to contemplate points of view that I would hardly have considered otherwise. I am also thankful to the rest of the members of the examination committee, Prof. Christine Solnon and Prof. Eric Gonzales. I enjoyed the discussion that your questions sparked, not only about the content of my thesis but also of the many interesting future directions that might originate from it.
I am grateful to have worked in the LICIT laboratory. Its members, past members and visitors made my journey an enriching and pleasant experience. The long coffee breaks and discussions about any subject (environment, economics, politics, music, movies and traffic, of course), the Thursdays of chapati, the conferences, the nights out, the MAGnUM meetings and sorties. There is always something else to learn. It was a pleasure to work with you
Finalmente, quiero dar las gracias a mi familia, Elsa, Humberto, Daniela, C´eline y Yah-in, y a mis amigos, quienes de cerca o de lejos me han dado el apoyo emocional e intelectual para completar esta fase de mi vida.
pean Union’s Horizon 2020 research and innovation program (grant agreement No 646592 – MAGnUM project).
Table of Contents
List of figures xix
List of tables xxiii
1 Introduction 1
1.1 Background and motivation . . . 2
1.2 Research approach . . . 4
1.3 Research objectives and questions . . . 7
1.4 Contributions . . . 8
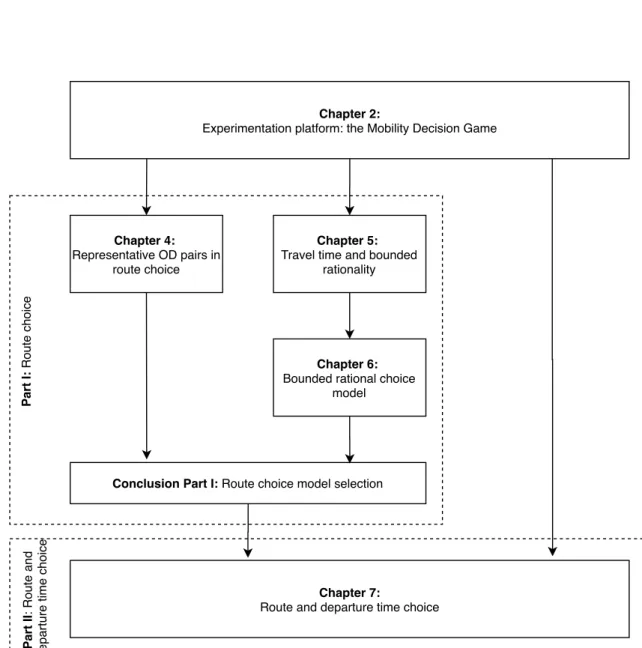
1.5 Thesis outline . . . 9
1.6 List of publications . . . 10
2 Mobility decision game 13 2.1 Motivation . . . 13 2.2 Definition of the MDG . . . 15 2.2.1 Scenarios . . . 16 2.2.2 Decision problem . . . 20 2.3 MDG gameplay . . . 24 2.3.1 Interface . . . 25 2.4 Experimental design . . . 25
2.4.1 List of experiments with the MDG . . . 29
2.A Attributes of the OD pairs . . . 31
2.B Maps of the OD pairs . . . 34
2.C Consent form for the experiments’ participants . . . 37
I
Route choice behaviour
39
3 Literature review on route choice behaviour 41 3.1 Review of route choice studies . . . 413.2.1 Multinomial logit model . . . 48
3.2.1.1 Independence from irrelevant alternatives (IIA) . . . 49
3.2.1.2 Taste variation between individuals . . . 51
3.2.1.3 Panel data . . . 52
3.2.2 Mixed logit model . . . 53
3.2.3 Joint random utility models . . . 55
3.2.4 Estimation of random utility models . . . 57
3.2.5 Choice models in this thesis . . . 59
4 Approximating travellers’ route choices at urban network level 61 4.1 Motivation . . . 62
4.2 Materials and Methods . . . 65
4.2.1 Obtaining representative OD pairs and routes . . . 65
4.2.2 Route choice experiments . . . 66
4.2.3 Route choice model . . . 67
4.3 Results . . . 70
4.3.1 Clustering . . . 70
4.3.2 Experiment results . . . 73
4.3.3 Route choice model estimation . . . 74
4.3.4 Choices on representative OD-routes . . . 75
4.4 Conclusions and discussion . . . 79
4.A Cluster characterisation . . . 82
4.B MXL models’ estimates . . . 84
4.C Computational effort . . . 85
5 Travel time and bounded rationality in travellers’ route choice 87 5.1 Motivation . . . 88
5.2 Computer route choice experiments . . . 91
5.3 Methodology . . . 93
5.3.1 Travel time minimisation behaviour . . . 93
5.3.2 Travel time boundedly rational behaviour . . . 95
5.3.3 Estimation of indifference band by participant . . . 97
5.3.4 A MXL model for route choice conditioned on the indifference band . . . 97
5.4 Results . . . 101
5.4.1 Perfect rationality . . . 101
5.4.3 Bounded rationality in route choice . . . 105
5.4.4 Heterogeneity of the indifference band . . . 109
5.4.5 Estimating the MXL model for route conditioned on the indifference band 112 5.5 Conclusions and discussion . . . 117
5.A Detailed results of the models estimates . . . 120
6 Bounded rational choice set generation MXL model 123 6.1 Motivation . . . 123
6.2 Bounded rational choice set generation model . . . 126
6.2.1 Estimation . . . 128
6.3 Methodology . . . 129
6.3.1 Synthetic data generation . . . 129
6.3.2 Prediction accuracy . . . 131
6.4 Results . . . 132
6.4.1 Synthetic data . . . 132
6.4.2 Route choice experiments . . . 135
6.5 Conclusions and discussion . . . 140
Conclusions of part I: route choice model selection 143
II
Route and departure time choice behaviour
151
7 Route and departure time choice behaviour 153 7.1 Motivation . . . 1537.2 Methodology . . . 155
7.2.1 Route and departure time experiment . . . 155
7.2.2 Definition of the variables related to the time for travel . . . 156
7.2.3 Joint route and departure time model . . . 157
7.3 Results . . . 158
7.3.1 Exploratory analysis . . . 158
7.3.2 Route and departure time model estimates . . . 160
7.4 Conclusions . . . 163
General conclusions and research perspectives 165
List of Figures
1 Deux paires OD jointes par trois voies pour l’exp´erience MDG. Les exp´eriences consistent `a choisir un itin´eraire sur trois pour effectuer un voyage. Les conditions de circulation et les attributs d’itin´eraire variables permettent d’observer les choix des voyageurs dans diff´erentes situations sur la ville de Lyon en France. . . vii 1.1 Two OD pairs joined by three routes for the MDG experiment. The experiments
consist in choosing one out of three alternative routes to complete a trip. The varying traffic conditions and route attributes allow to observe the choices of travellers in different situations over the city of Lyon in France. . . 6 1.2 Thesis outline. Dependence relationship between the chapters of this thesis. . . . 12 2.1 MDG interface. An OD pair and three alternative routes are shown over a section
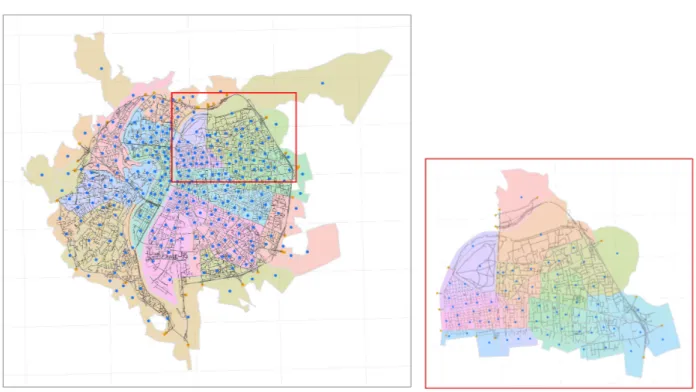
of the Lyon network in the MDG. The left menu allows participants to choose the mode of transportation, the departure time and the route choice. . . 16 2.2 Lyon-full and Lyon-V36 OD pairs. The zones are depicted in different colours
with their centroids in blue. The entry/exit points to the network are depicted with yellow points. . . 18 2.3 Typical global demand profiles in the MDG experiments. The global demand has
an impact in the whole network traffic conditions. During the warm up period the network is populated in order to arrive to the desire traffic conditions. The cool down period allows the started trips to finalise. . . 19 2.4 Typical trip assignment profiles in the MDG experiments. The local demand is
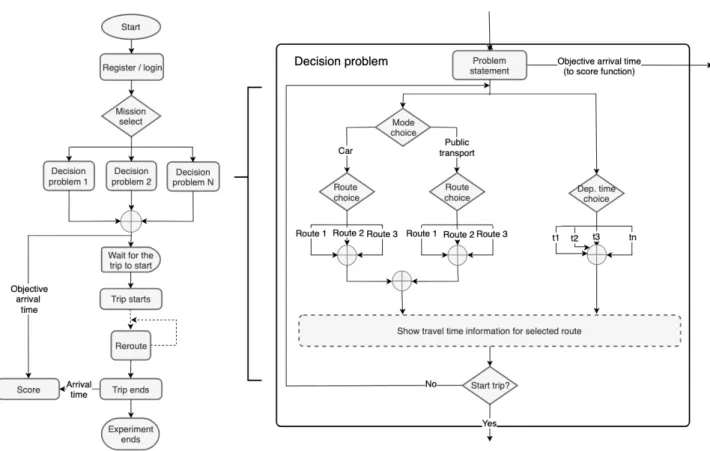
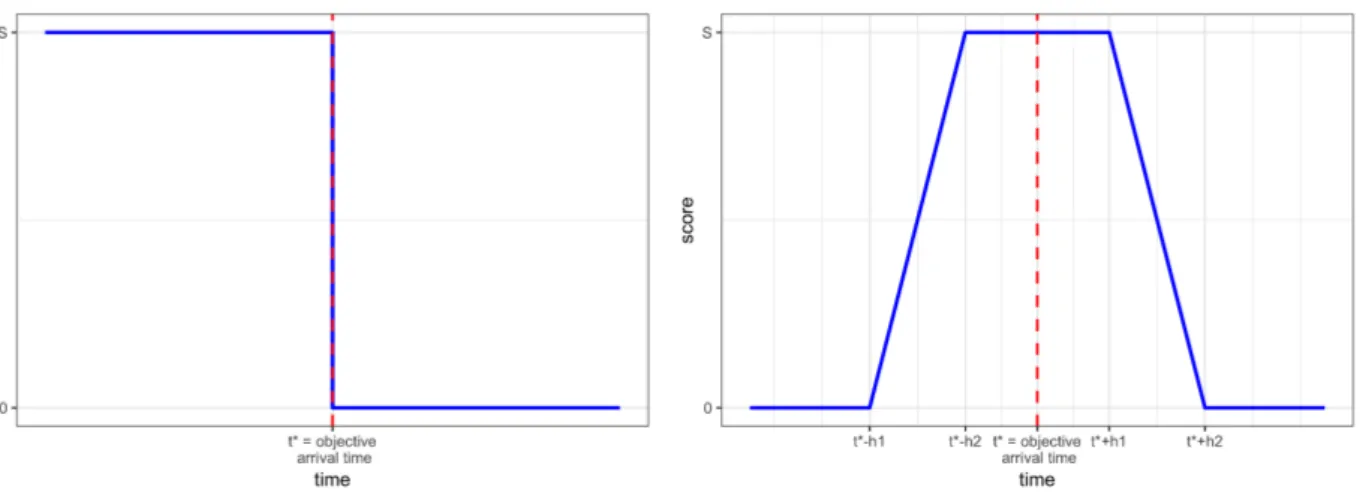
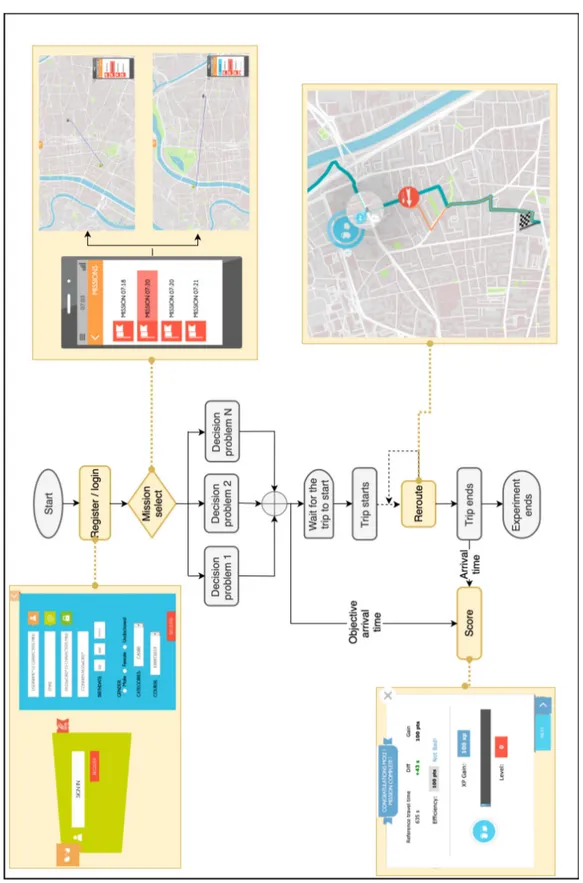
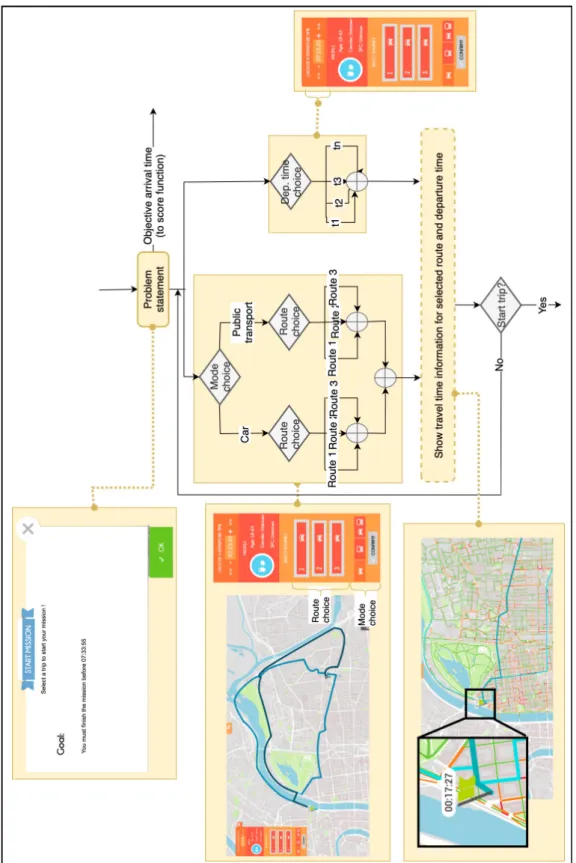
distributed among the alternative routes to change their traffic conditions. On the left, the assignment profile with constant trip distribution. On the right, the trip distribution on the alternatives change to produce congestion in one of the three alternatives. . . 19 2.5 Flow chart of a MDG experiment (left) and decision problems (right). . . 21 2.6 Shapes of the score function. Plots of the two score functions score1 (left) and
presented alongside its interface. . . 26 2.8 MDG gameplay with interface description. The flow chart of the decision
prob-lem is presented alongside its interface. . . 27 2.9 Summary of the attributes of the OD pairs and routes. Distributions of the
attributes experienced by the travellers in the OD pairs and three alternative routes defined for the MDG experiments. . . 29 2.10 Maps of the playable OD pairs and routes in Lyon-V36 network. . . 34 2.11 Maps of the playable OD pairs and routes in Lyon-full network. . . 35 2.11 Maps of the playable OD pairs and routes in Lyon-full network. . . 36 2.12 Consent form signed by the participants. . . 37 3.1 Independence of irrelevant alternatives. The inclusion of a new route k0,
simi-lar to one of the routes already present in the choice set, will cause the same proportional decrease in the choice probabilities of j and k. . . 50 4.1 OD-routes vector. The vector is composed of the attributes of the OD pair and
the three routes connecting the origin and destination, with length(Route 1) ≤ length(Route 2) ≤ length(Route 3). . . . 66 4.2 Determining the number of clusters k. The sum of squared errors for k-means
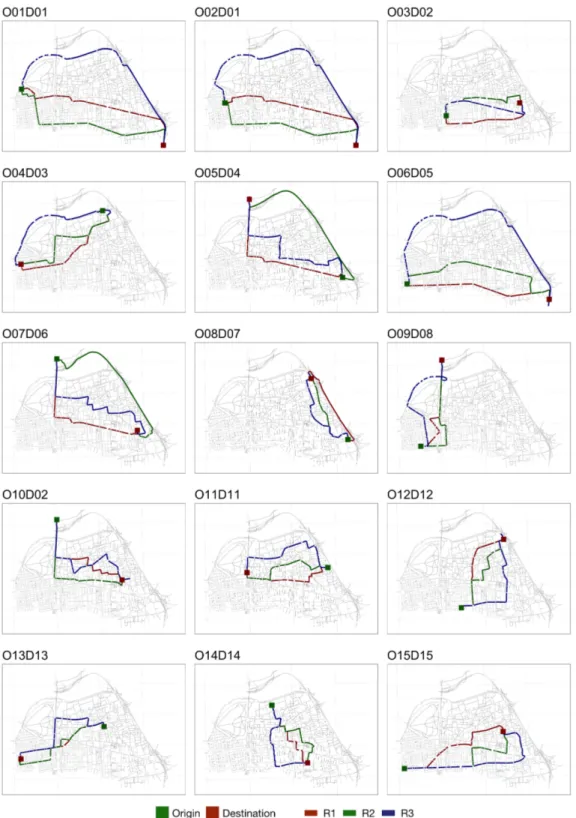
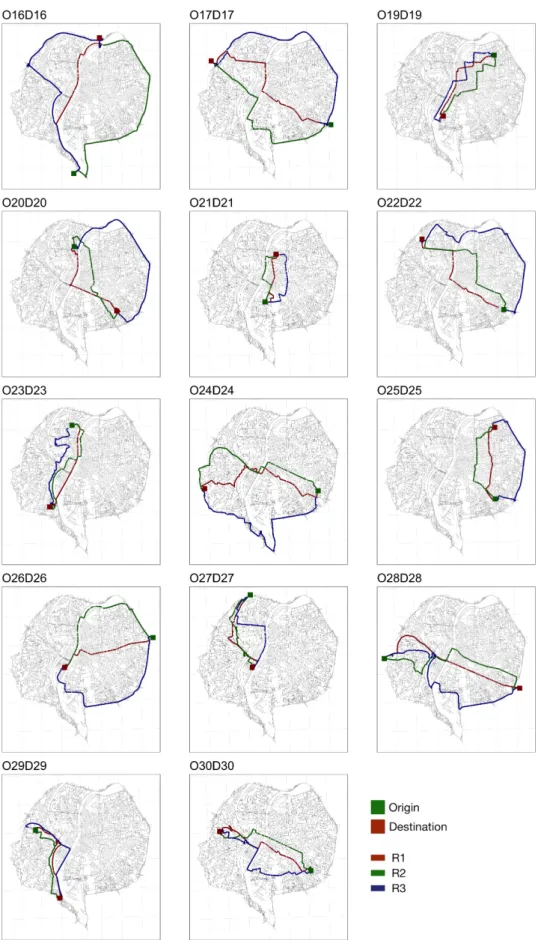
clustering of the 624,490 OD-routes with k = 1, . . . , 30. After k = 9 the decrease in the mean WCSS is marginal. . . 71 4.3 Representative OD-routes. Maps of the nine cluster centroids used in the MDG
experiments. . . 72 4.4 Cluster centroids as representative OD-routes. The distribution of the attributes
of the selected OD pairs are similar to that of the whole network. The p-values of the Kolmogorov-Smirnov, presented in red in the top of each panel, indicate the lack of statistical evidence (with a confidence level of 0.90) to reject the hypothesis that the two distributions are the same. . . 73 4.5 Route choice distribution in the nine cluster centroids. The choices of the
in-formed participants are different from those of the uninin-formed participants. . . 74 4.6 Mean predictive errors. The MPEs of model M∗ are smaller than the MPEs of
models Mr in the majority of the cases (blue dots). Furthermore, in the cases where the MPEs of models M∗ are bigger (red dots), the differences are small (close to identity line). . . 77 4.7 Mean predictive errors by information group. The models estimated with the
cluster centroids are clearly better in predicting the choices for the uninformed participants. . . 78
4.8 Distributions of the predictive errors the 21 validation OD-routes. The level and the variability of the errors amongst the different OD-routes imply that the choices in some OD-routes are difficult to predict, regardless of the training set used to estimate the models. . . 80 4.9 Distributions of the prediction errors of the models M∗ on the 21 validation
OD-routes. There are no significant differences between the error distributions. . 81 4.10 Origin-destination zones in each cluster. The clusters show differentiated
geo-graphical patterns. For example, clusters 1,3,5 and 6 represent trips that origi-nate and termiorigi-nate in the limits of the network and, thus, represent longer trips.
. . . 82 4.11 Attributes of the routes in the clusters. The attributes of the routes show
differ-entiated attributes between the clusters. . . 83 5.1 Choice distributions for the 41 OD pairs in the MDG experiments. . . 92 5.2 The distributions of (a) the number of choices per participant and (b) the number
of choices per participant per OD pair. This later plot shows that participants barely made more than 2 choices in the same OD pair. . . 93 5.3 Differences in the proportion of choices for the fastest route F (t + 1) − F (t). If
F (t + 1) − F (t) = 0, then there is no clear trend in the data. . . . 94 5.4 Example of the computation of err for a given OD pair. In this case, err(P robs, ¯P rpred) =
0.10. . . 101 5.5 (a) minimisation rates per OD pair, and (b) distribution of the minimisation
rates of participants. . . 103 5.6 Kernel density estimation of the distribution of (a) the absolute (seconds) and
(b) the relative differences in travel time. . . 103 5.7 Proportion of times the fastest, F(1), second fastest, F(2) and slowest, F(3) routes
are chosen, computed for the subsets S(p) for (a) the absolute difference in travel time information, and (b) the relative difference in travel time information. Note that the number of observations to compute the values F(1) decreases with increasing α. In order to maintain the comparability between the proportions between the two definitions, the cut points were determined by the 20-quantiles of each distributions (Figure 5.6), that is why they are not equally distanced in the plots. This assures that the number of observations to compute the proportions are the same for the absolute and relative cases. . . 104 5.8 Minimisation rate, F(1), computed for the subsets S1(α) for (a) the absolute
difference in travel time information, and (b) the relative difference in travel time information. The red lines are the predictions of the logistic models. . . 105
ability of choosing a satisficing route as a function of α. (b) Probability of observing Sn(α) in the data, i.e, the fraction of observations with n = 1, 2, 3 satisficing routes for different values of α. These probabilities, computed for the bootstrap subsamples, are also included in the figures with lighter colours. The values α where the probabilities are computed correspond to the 20-quantiles of the relative travel time difference distribution (Figure 5.6(b)). . . 106 5.10 Total probability of choosing a satisficing route for the general case (grey area).
Perfect rationality is represented by the red line. . . 108 5.11 Predicted upper and lower bounds for the probability of choosing a satisficing
route. The 95% prediction error interval is represented with a dashed line. . . . 109 5.12 Probabilities of choosing the k-th fastest route amongst the n satisficing routes
for (a) n = 2 and (b) n = 3. . . 110 5.13 Distributions of the indifference band by participant estimated using (a) the
maximum of the travel time differences of the routes chosen by the participants, (b) the 95 percentile, and (c) the 50 median. The cumulative distributions are included in (d). . . 111 5.14 Distributions of the random coefficients β ∼ N (β, ˆˆ¯ Σ) for models Model 0 and
Model 1. The probability of a coefficient being greater than zero in shown at the top of the plot. . . 114 5.15 Goodness-of-fit of models Model 0 and Model 1 evaluated by OD pair
consider-ing (a) the lppd and (b) err measures. The average is represented by the dashed lines, it is obtained considering the weight of each OD pair in the data set. . . . 115 5.16 Out-of-sample (a) log pointwise predictive density (lppd) and (b) discrepancy
between the observed and predicted choice distributions (err) for each iteration of the bootstrap validation. . . 116 6.1 Issues in the individual estimation of the indifference bands α. The cases
rep-resent three choice problems, each with three alternative routes, faced by an individual. . . 125 6.2 Weibull probability density functions used to generate the data with (a) three
different rate parameters and k = 1 (exponential distribution), and (b) three different shape parameters and same rate λ = 1. Note in this last plot how when k < 1 the values are accumulated closer to zero. . . 131 6.3 Choice distributions for the synthetic data. . . 131
6.4 Observed vs estimated distributions for the values of α. The histogram depicts the distribution of the observed values, the blue line the theoretical distribution used to obtain the simulated values, and the red line is the estimated distribution.134 6.5 Comparison of the prediction error of the MXL model against the BRCS model
for the (a) CV1 and (b) CV2 schemes. Each point represents the error of each of the 60 test sets (10 for each of the 6 generated data sets). The dotted lines are the average for each model. . . 135 6.6 Estimated (a) density and (b) cumulative probability distributions for the
indif-ference bands in the BRCS model. . . 138 6.7 Distributions of the individually estimated indifference bands (a) ˆαmaxi , (b) ˆα95i
and (c) ˆα50i ; and the Weibull distribution inferred by the BRCS model (red line). (d) the cumulative probability distributions. . . 139 6.8 Comparison of the prediction error of the BRCS model against both the
predic-tion errors of the MXL and cond. MXL models. (a) aggregated by CV iterapredic-tion and (b) aggregated by OD pair. . . 140 6.9 Mean and standard deviation of the prediction error for the six route choice
models. . . 146 6.10 Number of observations in the data set. The actual number of observations (N in
total) in each OD pair is compared against the weighted number of observations considering N and 1.5N observations in the resampled data set. . . 149 7.1 Representation of the variables ETT, ELATE− and ELATE+ for two trips, s
and s0, with expected arrival time before and after the objective arrival time, respectively. . . 157 7.2 Route choice distribution. The percentage of choices for each of the three routes
in the five OD pairs. The left plot represents the total percentage of choices for the fastest, second fastest and slowest routes. The colour indicates the percentage of the times that the route was the fastest informed route. . . 159 7.3 Expected lateness distribution. The mode of the distribution is placed just
be-fore ELATE = 0 and has a long negative tail. This means, on the one hand, that participants consider that late arrivals have worst consequences than early arrivals. On the other hand, they try to minimise the early arrivals. . . 160 7.4 Distribution of ELATE per participant. The distributions are ordered by the
List of Tables
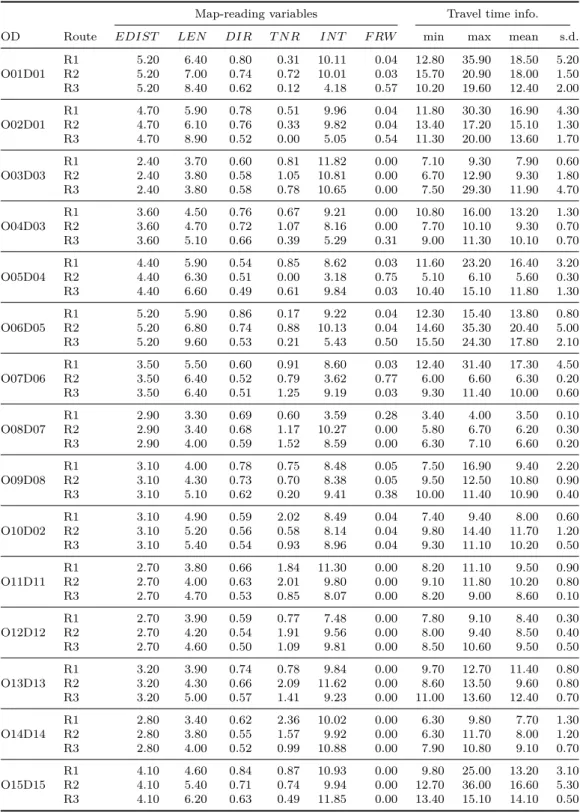
2.1 Characteristics of the Lyon-full and Lyon-V36 road networks. . . 17 2.2 Summary of the MDG experiments. . . 30 2.3 Attributes of OD pairs and routes in Lyon-V36 network. Attributes experienced
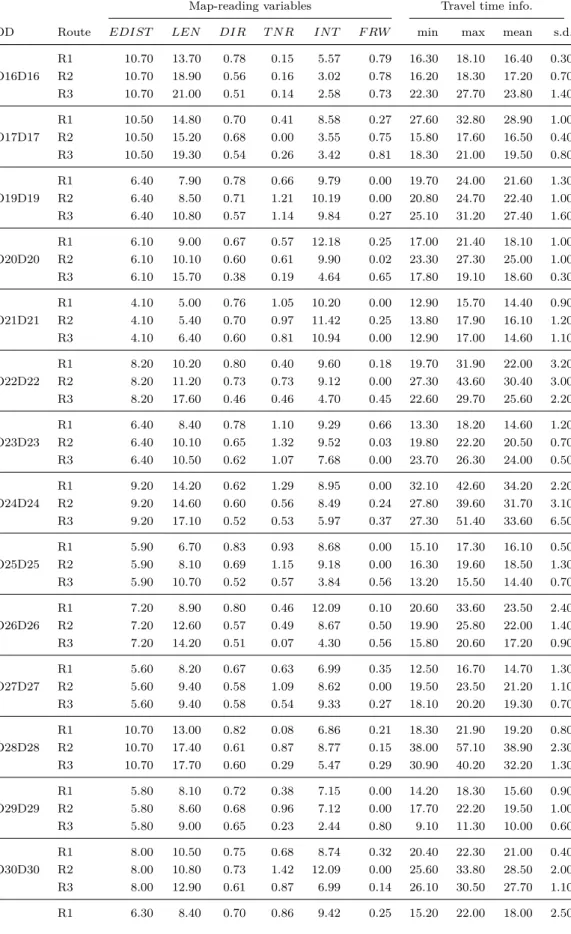
by participants in the MDG experiments. . . 31 2.4 Attributes of OD pairs and routes in Lyon-full network. Attributes experienced
by participants in the MDG experiments. . . 32 4.1 Hyperparameters of the prior distribution h. . . . 70 4.2 Summary of the cluster analysis results. . . 70 4.3 Estimates of the MXL models’ coefficients for the nine representative OD pairs.
Mean (standard error) of the sampled posterior distributions of the parameters of the MXL models. . . 75 4.4 Complete estimates of the MXL models’ coefficients. Mean, standard deviation
and some quantiles of the sampled posterior distributions of the parameters of the MXL models. . . 84 4.5 Execution time (in seconds) to draw 30,000 samples of the posterior distribution
of the parameters. Estimation for the 9 cluster centroids which are composed of 802 route choices. . . 85 4.6 Hardware and software specifications. . . 85 5.1 Global percentage of times that the fastest, second fastest and third fastest routes
were chosen. . . 102 5.2 Summary of the logistic regressions with dependent variable Y = 1 when the
fastest route was chosen, and regressors ∆IT T1,2 or %∆IT T1,2. The Hosmer and Lemeshow (H&L) goodness of fit test is included in the table. . . 105 5.3 Summary of the logistic regressions to approximate the upper and lower bands
for P r(satisficing|Sn(α)) in the general case. The Hosmer and Lemeshow (H&L) goodness of fit test is included in the table. . . 109
individual indifference bands, αi, and (ii) assuming homogeneity for the indiffer-ence band, ¯αi. . . 111 5.5 Estimates for the mean and the covariance (standard deviation and correlation)
of the parameters of the two MXL models Model 0 and Model 1 estimated for the participants that received travel time information. lppd is the log pointwise predictive density, an estimate of the predictive accuracy of the model: a higher value (compared to another model) means a better fit. WAIC (Watanabe-Akaike Information Criterion) penalises the lppd with the model complexity: a smaller value (compared to another model) means that the model represents a better alternative balancing goodness-of-fit and complexity. err is the discrepancy be-tween the observed and predicted choice distributions. . . 113 5.6 Results Model 0. Statistics on the posterior distribution for the mean and
co-variance matrix. . . 120 5.7 Results Model 1. Statistics on the posterior distribution for the mean and
co-variance matrix. . . 121 6.1 Estimation results for synthetic data. The real values of the coefficients β is
shown in parenthesis. . . 133 6.2 Prediction error for each of the six synthetic data sets. The Wilcoxon test is the
one-tailed test with H0: the prediction error for the MXL model is smaller than for the BRCS model. . . 135 6.3 Estimation results of the BRCS, the MXL and the conditional model. The
standard deviations and the correlation coefficients are shown in parenthesis. . . 137 6.4 Estimates for the mean and standard error of the parameters of the six models.
The standar deviation and the correlations of the coefficients βi are shown in
parenthesis. . . 150 7.1 Estimates of the mean parameters of the three joint route and departure time
models. . . 162 7.2 Training error of the estimated joint route and departure time models. . . 163
1
Introduction
During the last century, the world’s population has witnessed an unprecedented process of urbanisation. In 1950, 30% of the world’s population lived in cities, by 2018 they are home to half of the people worldwide and this percentage is projected to increase by 68% by the year 2050 (U.N., 2019). Notwithstanding the benefits that cities represent for their inhabitants, such as access to labour, health, education and other services, there are drawbacks that present serious challenges for their future viability. Traffic congestion is amongst them. Traffic congestion is the cause of monetary losses as well as the emission of pollutants that are, in turn, the cause of premature death amongst their inhabitants and a major contributor to the warming of our planet. It is in this context that strategies that help reduce congestion become relevant. To test the feasibility of different traffic reduction strategies, researchers and network managers rely on traffic simulation. In traffic simulation, travellers are assumed to follow a behavioural model that determines their travel choices, these choices are then considered altogether during a period of time in order to produce the traffic patterns in the networks. This allows to anticipate the impact of traffic control strategies under different scenarios: demand levels, network topology and traffic facilities. It is in this sense that understanding and approximating the behaviour of travellers is indispensable to forecast the states of a transportation network, in both normal and hypothetical scenarios.
The experimental studies on travellers’ behaviour usually focus on the particular determi-nants of travellers’ choices, and thus consider limited environments in their experiments: few OD pairs and routes and traffic conditions. As a consequence, the choice models derived from data coming from these experiments play a more interpretative than predictive role: their pur-pose is to understand the role of different traits that influence travellers’ behaviour, rather than predicting their choices across the different situations found in the road network. In this thesis, choice models are studied from the predictive perspective. The objective is to formulate models capable of predicting the route choices at a full-scale urban network level, which is
necessary for simulators to realistically represent the traffic conditions. For this purpose, the behaviour of travellers is studied through computer-based experiments. The experiments in this thesis comprise a large variety of situations (OD pairs, routes and traffic conditions) that resemble those that travellers find when travelling in an urban environment. This variety of situations must be taken into account in order to obtain choice models capable of scaling-up at the network level.
1.1
Background and motivation
When travelling in a city, travellers face several decisions regarding the (i) activity to engage, (ii) the destination of the trip, (iii) the mode of transportation, (iv) the departure time, and (v) the route to complete the trip. These individual decisions altogether shape the traffic states in the transportation network at a given time. However, at the same time that the states of the network are the consequence of travellers’ choices, the characteristics and traffic states of the network influence travellers’ decisions. One might think, for example, of travellers adapting their departure time and route choices anticipating congestion on the usual road. This bidi-rectional relationship between travellers’ behaviour and traffic dynamics is the central idea in network loading problems, and it is studied from two different perspectives. The first is related to the traffic assignment problem, in which the traffic patterns at network-level are obtained as the result of the interactions between the choices of all travellers in the transportation network, based on general assumptions about network equilibrium. The second is related to the choices of the individual travellers, with particular emphasis on the identification and classification of the factors that influence their choices.
In traffic assignment, the demand from all origins to all destinations is assigned to the roads in the network by assuming a general behavioural principle governing the choices of travellers. The first and simpler of such principles is the well-known Wardrop’s first principle or user equilibrium (UE) (Wardrop, 1952), defined as the state of the network in which no user may lower his transportation cost through unilateral action. UE assumes that all users in the network are utility maximisers (or cost minimisers) and thus the traffic patterns in the network are the result of all travellers minimising their travel cost simultaneously. Since then, considering other models of behaviour for the travellers, alternative definitions of network equilibrium have been proposed, such as stochastic user equilibrium (SUE) (Daganzo and Sheffi,1977), which is based on random utility theory, and boundedly rational user equilibrium (BRUE) (Mahmassani and Chang,1987), based on the bounded rationality hypothesis. In traffic assignment, the emphasis is placed on how the various behavioural principles derive in different traffic patterns, and on the methods to solve the network loading problem to determine static or dynamic traffic states at large scale. The choice models that dictate the individual behaviour of the travellers are,
1.1. BACKGROUND AND MOTIVATION
in this case, considered as simplified mathematical abstractions that permit to compute the assignment under the different behavioural principles. Moreover, since the aim is to derive the full path flow distributions at the network level, little attention is paid to the fine calibration of the individual user behaviour.
Studies, from the perspective of the individual behaviour of travellers are mainly concerned with the specific factors that influence their choices. Travellers’ behaviour is a process which involves psychological and cognitive mechanisms through which travellers perceive and evaluate the states of the network, and then make decisions accordingly (Bovy and Stern, 1990, Ben-Akiva et al., 1999). Although this definition may appear simple, there are many factors, associated to both the traveller and the environment, that intervene in this process, making it a complex problem. These factors are heterogeneous (as heterogeneous as individuals can be), and they interact in ways that are not easily observable to produce the choices. In the route choice context, studies have been made to understand the learning process of travellers (Iida et al.,
1992,Bogers,2005,Selten et al.,2007) and its relationship to the formation of habit, familiarity and the exploration of the alternative routes (Srinivasan and Mahmassani, 2000, Prato et al.,
2012,Kaplan and Prato,2012). The reliability of the travel time in alternative routes has been found to play a major role in route choice. Travellers (or the great majority of them) exhibit risk-aversion, and thus they prefer slower reliable routes rather than fast unreliable ones (Abdel-Aty et al., 1997, Avineri and Prashker, 2005, Ben-Elia and Shiftan, 2010). However, risk aversion is heterogeneous amongst travellers, and between trip purposes (Ramos, 2015), and depends on the value of time of the travellers (de Palma and Picard, 2005). Another line of research largely treated in literature is the effect of travel information on the route choices, with special interest on the impact of information on the travel time minimisation behaviour (Bonsall,1992,
Ben-Elia and Shiftan,2010,Adler and McNally,1994,Abdel-Aty et al.,1997) and its effects on the social cost (Mahmassani and Jayakrishnan, 1991, Ben-Akiva et al., 1992, Rapoport et al.,
2014a,Ben-Elia and Avineri,2015). Studies about variables other than travel time that explain the choices of travellers can be found in Bovy and Stern (1990), Ramming (2002). The above-mentioned studies are predominantly based on laboratory-like experiments, where participants’ choices are observed on simple scenarios (two or three routes in few OD pair configurations) that do not cover the multiplicity of situations that are found in a city-scale transportation network. These simplifications are made in order to guarantee the internal validity of the experiments. For example, if the objective is to measure the impact of travel time reliability in the route choices of travellers, then it suffices to present choice problems to the participants with only two alternative routes; the shape and attributes of the routes are irrelevant. This is justified because including more routes in the experiment or showing extra information on the alternatives render the analysis of the results more complicated, as the effect of the variable being investigated is confounded with the effect of the rest of the attributes of the alternatives.
Since the objective of these studies is to understand the determinants of travellers’ behaviour, the choice models in these works play a mainly interpretative role. At full-scale network level, the choices of travellers are made over thousands of OD pair configurations that consist of short and long trips as well as routes that differ in their attributes. In the case concerning this thesis, the city of Lyon in France, the network has 19,967 links and 19,697 nodes. Therefore, these choice models may not generalise well to the amount of situations that are found in an urban network, in the sense that their predictions may not be accurate in OD pairs with different enough characteristics.
The motivation of this thesis is to obtain choice models that are both consistent with the observed behaviour of travellers, and that generalise well at full-scale network level. In other words, models that make accurate predictions in all OD pairs in an urban transportation network, but that are estimated with observations on a limited number of OD pairs. The general idea is to implement, in the future, these choice models in dynamic traffic assignment algorithms, and thus obtain traffic patterns simulated from a behavioural perspective. To at-tain consistency with travellers’ behaviour, the choice models are inferred from data collected through computer-based experiments. However, since the choices of travellers cannot be ob-served in such a large number of OD pairs and routes that are found in an urban network, first a methodology to collect observations of the choices of travellers through computer-based experiments is required. Models estimated with data coming from this methodology should be able to scale-up, from a small set of observable OD pairs, to the full-network level. Broadly speaking, the objectives of this thesis are (i) building a methodology that allows to estimate choice models over a full-scale road network, and (ii) selecting an appropriate model specifica-tion to be applied to a large-scale network, taking into account different aspects of travellers behaviour.
1.2
Research approach
In order to estimate and test different choice models, the behaviour of travellers need to be observed. There are two recognised methods to collect data on travellers’ behaviour: stated preference (SP), in which subjects are faced with hypothetical choice situations, and revealed preferences (RP), that are based on direct observation of the choices of travellers in real-world situations or based on surveys asking for actual travel behaviour. In the route choice context, an example of a SP experiment might be a survey in which the respondents are faced with choosing the route that they would, given different attributes and congestion scenarios in the alternative routes. If the same route experiment were based on the RP method, then the actual route choices of travellers would be observed (through GPS, for example), or asked via a survey. Examples of studies about travellers’ behaviour based on SP data are Iida et al.(1992), Adler
1.2. RESEARCH APPROACH
and McNally (1994), Mahmassani and Liu (1999), Ben-Elia and Avineri (2015); and examples based on RP data are Bierlaire and Frejinger (2008), Ramos et al. (2012), Zhu and Levinson
(2015), Yildirimoglu and Kahraman (2018b). The SP and RP methods have advantages and disadvantages (Kroes and Sheldon,1988,Bovy and Stern,1990,Train,2003). On the one hand, SP suffers from external validity of the responses, understood as the discrepancy between the stated responses and the actual behaviour of the respondents in real-life situations. The lack of external validity is caused by respondents stating intentions or opinions and not their actual behaviour, which is explained by the absence of context in the experiment (e.g. change in traffic conditions due to bad weather) or by the inadequacy of the incentives given to the participants. On the other hand, the main disadvantages of the RP method are the lack of awareness of the alternatives considered by the decision-makers and the lack of variability in the scenarios in which the choices are made. The lack of awareness on the alternatives implies that the researcher does not have information on the alternatives against which the decision-makers evaluate their choices, inevitably introducing a new source of uncertainty and reducing the internal validity of the experiments. The advent of the information technologies has facilitated new forms to carry out behavioural experiments, notably, computer-based experiments, that belong to the SP type. Although the computer-based SP experiments also suffer from the lack of validity of traditional SP methods, they possess some characteristics that could attenuate this issue. First, computer-based experiments permit to define more complex scenarios that resemble real-life situations, and to present them to the participants in a more realistic and intuitive way, providing more context to the situations in which the choices are made (Chen and Mahmassani, 1993, Koutsopoulos et al., 1994, 1995). For example, by showing the alternative routes over a map of the city. Second, by presenting the choice situations in a more intuitive way, the cognitive burden of the participants is eased, allowing to increase the amount of choices that can be collected from each individual thus reducing the costs of the experiments. Third, the computer-based SP experiments make it possible to introduce consequences, in the form of a score (score design), to the choices of the participants, allowing participants to earn points as if it were a game. This could enhance the engagement of participants, although the design of the score may also influence the respondents’ strategies (Bogers et al., 2005).
The approach in this thesis to investigate travellers’ behaviour in transportation networks is through computer-based experiments at large scale, for which a platform named the Mobility Decision Game (MDG) has been developed. Contrary to other SP experiments, the MDG allows to observe the choices of a large number of participants under different situations (see Fig. 1.1), which is essential for inferring choice models at full-scale network level. The MDG is a web-based computer game designed to confront the participants in the experiments with decision problems regarding the departure time and the route choices to complete a trip. The decision problems are placed under different hypothetical scenarios, comprising of OD pairs
joined by three alternative routes with contrasting attributes and varying traffic conditions. The scenarios occur in a dynamically simulated environment of the real network of the city of Lyon, France, in which the traffic conditions are generated in real-time by a single dynamic microscopic simulator. During a MDG experiment, multiple OD pairs are assigned to the participants, allowing to observe the choices of the same participants in different OD pairs. Furthermore, some of the participants may receive traffic information in the form of travel time.
Figure 1.1: Two OD pairs joined by three routes for the MDG experiment. The experiments consist in choosing one out of three alternative routes to complete a trip. The varying traffic conditions and route attributes allow to observe the choices of travellers in different situations over the city of Lyon in France.
The model adopted in this thesis to predict the choices of travellers is the mixed logit model (McFadden, 1984, McFadden and Train, 2000), which belongs to the random utility maximisation framework (Mcfadden, 1972). This framework assumes that individuals obtain a certain level of utility from each alternative in a choice situation, and that they choose the alternative with the maximum utility, i.e., individuals are utility maximisers. In random utility maximisation models, the utility obtained from an alternative is related to the attributes of both the alternative and the decision-maker. As a consequence, the choices of the decision-makers are, to some extent, explained by variables that can be measured and that depend on the OD pair and on the situation (OD pair and traffic conditions). Moreover, the number of assumptions about the parameters of the model is small, and these can be easily inferred from the data, obtaining succinct representations of the utility and the choice probabilities. Therefore, random utility maximisation models are well-suited for the prediction of travellers’ choices at full-scale
1.3. RESEARCH OBJECTIVES AND QUESTIONS
network. A careful selection of the scenarios over which the MDG experiments evolve, permits to estimate choice models that generalise well to the full-scale network level, and to test and select the model specification that best represent the choices of the participants in the experiments.
1.3
Research objectives and questions
The objective of this thesis is to propose and estimate choice models that predict accurately the choices of travellers over the diversity of situations found in a transport network. To attain this objective, empirical evidence on travellers behaviour is collected through computer-based SP experiments that permit to observe the choices of the participants on a diverse set of scenarios (OD pairs and routes) with varying traffic conditions and travel time information. The experiments focus on the route choices of uni-modal car trips that are based on the map of the city of Lyon, France. The number of scenarios on which the choices of the participants can be observed through the MDG is still limited, compared to the entire set of situations found on a full-scale network. Therefore, the scenarios used for the experiments need to be determined in order to represent the diversity of scenarios found on the entire network. This leads to the first specific objective of this thesis, the estimation of choice models at full-scale network level, which deals with the design of the choice experiments with the MDG. The second specific objective of the thesis, the choice model selection, concerns the finding of route and departure time models based on the collected empirical evidence. The specific objectives are stated in a succinct manner below, together with the research questions that need to be answered for their achievement.
Framework for the estimation of choice models at full-scale network level. Concerns the design of experiments, the experimentation and the generalisation of the observed choices to the full-scale network. This comprises the sample of a small set of OD pairs and routes of the road network of the city of Lyon in France, over which the route and departure time experiments are held. The sample must be representative of the road network at route attribute level, and the observed choices over these OD pairs and routes must generalise at full-scale network level. In other words, choice models estimated with data on the small representative OD pairs and routes must approximate with good accuracy the choices in the entire network.
– Is it possible to represent the OD pairs and routes in a network with a small set of OD pairs?
– Are choices in the representative OD pair set also representative of the choices in other OD pairs?