HAL Id: hal-03154533
https://hal.sorbonne-universite.fr/hal-03154533
Submitted on 1 Mar 2021
HAL is a multi-disciplinary open access
archive for the deposit and dissemination of
sci-entific research documents, whether they are
pub-lished or not. The documents may come from
teaching and research institutions in France or
abroad, or from public or private research centers.
L’archive ouverte pluridisciplinaire HAL, est
destinée au dépôt et à la diffusion de documents
scientifiques de niveau recherche, publiés ou non,
émanant des établissements d’enseignement et de
recherche français ou étrangers, des laboratoires
publics ou privés.
Effect of electrolyte flow on a gas evolution electrode
Soufiane Abdelghani-Idrissi, Nicolas Dubouis, Alexis Grimaud, Philippe
Stevens, Gwenaëlle Toussaint, Annie Colin
To cite this version:
Soufiane Abdelghani-Idrissi, Nicolas Dubouis, Alexis Grimaud, Philippe Stevens, Gwenaëlle Toussaint,
et al.. Effect of electrolyte flow on a gas evolution electrode. Scientific Reports, Nature Publishing
Group, 2021, 11 (1), pp.4677. �10.1038/s41598-021-84084-1�. �hal-03154533�
Soufiane Abdelghani‑Idrissi
, Nicolas Dubouis
, Alexis Grimaud
, Philippe Stevens
,
Gwenaëlle Toussaint
4,5& Annie Colin
1*In this study, the effect of flow of the electrolyte on an electrolysis cell and a zinc cell is investigated. The gain of energy brought by the flow is discussed and compared to the viscous losses in the cells. We point out that the balance between the gained electrical power and the viscous loss power is positive only if the hydrodynamic resistance of the circuit is correctly designed and further comment on the economical viability of the whole process. A model of the studied phenomena is proposed in the last section. This analytical model captures the dynamics of the process, gives the optimal flowing conditions and the limits of the energetical rentability of the process. This study shows that the use of flowing electrolyte in zinc–air batteries can be energetically profitable with the appropriate flowing conditions.
Oxygen electrochemistry has for many decades attracted a lot of attention in the scientific community because of its potential in the development of alternative energy technologies such as water electrolysers for the hydrogen production1, fuel cells or metal air batteries2,3. All these areas are currently active research areas because they
are part of the fight against global warming. In all these technologies it is necessary to improve the efficiency of electrochemical reactions. Water oxidation or the oxygen evolution reaction (OER) is the core reaction for these processes along with oxygen reduction reaction (ORR) and/or the hydrogen evolution reaction (HER)4.
The equilibrium half-cell potentials ( E0 ) at 1 atm and 250 C for OER and ORR are shown as follows in alkaline
conditions:
For pH = 14, E0=1.229 − (14 ∗ 0.059) V = 0.403 V vs RHE ;
E0=0.404 − 0.197V = 0.206 V vs Ag/AgCl (sat KCl).
During OER , molecular oxygen is produced via several proton/electron- coupled steps. The reaction is highly pH dependent. In acidic and neutral conditions two water molecules ( H2O ) are oxidized into four protons (H+)
and one oxygen molecule ( O2 ), while hydroxyl groups (OH-) are oxidized to H2O and O2 in basic environments4.
The production of the oxygen molecule requires the transfer of four electrons. This proceeds through by a multi-step, multi-electron transfer, which have slow kinetic properties. This induces high overpotentials and low energy efficiency in practical devices. To circumvent this problem, it is necessary to develop catalysts5. The most
promising catalysts at present are 3d transition metal oxides in alkaline conditions, and Ir-based oxides in acidic conditions. The electrolysis of water also encompasses the Hydrogen Evolution Reaction (HER). The equilibrium half-cell potentials at 1 atm and 25 °C for HER is shown as follows in alkaline conditions:
E = −1.023 V vs Ag/AgCl(sat KCl) for pH=14.
Fast compared to the OER reaction in alkaline solution, the HER kinetics are drastically affected by a change of pH from acidic to alkaline. At pH 13, the HER activity is 2 or 3 orders of magnitude lower than at pH 0 for the same surface6. As for the OER, the penetration of water electrolysis in the hydrogen market production
requires cheap and earth-abundant catalysts for the hydrogen evolution reaction. Platinum is still one of the best catalysts today7.
The slow kinetics of the OER or of the HER are not solely responsible for the low efficiency of the process. Overpotentials are also related to the ionic resistance of the electrolytes/membranes and the presence of bubbles (1) 4OH−
⇄ 2H2O(liq) + O2(g) + 4e−
(2) 2H2O(liq) + 2e−⇄ 2OH−+H2(g)
1ESPCI Paris, PSL Research University, MIE-CBI, CNRS UMR 8231, 10, Rue Vauquelin, 75231 Paris Cedex 05,
France. 2Chimie du Solide et de l’Energie, Collège de France, UMR 8260, 75231 Paris Cedex 05, France. 3Sorbonne
Université, Paris, France. 4Réseau sur le Stockage Electrochimique de l‘Energie (RS2E), CNRS FR 3459, 75005
80039 Cedex, Amiens, France. 5EDF R&D, EDF Lab Renardières, Département LME, 7 avenue des Renardières,
www.nature.com/scientificreports/
on the electrodes8. Let us underline that the role of bubbles is complex. On the one hand, bubbles make the
process less efficient. Attached to the electrodes, they mask them, decrease the effective surface area between the electrolyte and the electrodes, which creates an overvoltage. Present in the electrolyte, they decrease its conductivity and increase the ionic resistance. On the other hand, the presence of bubbles limits the amount of dissolved gaz and thus favorize the reaction. Bubble growth and even more bubble detachment, introduce convective flows that homogeneize the ionic concentration close to the electrode and avoid overpotential due to ionic concentration gradients9.
In the situation of high ionic concentration where the overpotential due to ionic gradients is low, in the situ-ation of high intensity current where bubbles are numerous, make the bubbles leave the electrode is an efficient way to enhance the efficiency of the electrochemical processes.
The use of superhydrophobic surfaces or of external fields such as super gravity, ultrasound or magnetic fields have been proposed to prevent the bubbles from sticking to the electrodes10,11. In commercial electrolysers this
phenomenon is partly combated by the use of electrolyte flow across the conductive substrate onto which the catalyst is loaded (required in a continuous process) which seems to enable the evacuation of bubbles12.
Zeng and Zhang13 obtained a small and in some situation no reduction in the cell voltage of an electrolyser
when flowing electrolyte is used. Their studies focus on very large cells. In this situation the shear stress is low and unable to sweep efficiently the bubbles12. On the other hand, Phillips12, Bongenaar-Schlenter et al.14, Hine et al.15
showed that the electrolyte flow rate reduces the cell resistance in a finite gap cell, with large reductions in cell voltage even at high current densities (> 500 mA cm−2). Wang and coworkers16 showed that the overpotential of
the gas electrodes in a zinc air battery decreases in presence of flow. They point out using numerical simulations and experiments that flow may avoid the coalescence of bubbles at the interface and promote the efficiency of the battery. This study is one of the few studies dealing with batteries and not electrolysers.
In this work, we will focus on these latter situations. Our goal is to understand whether introducing a flow that flushes out bubbles is an energetically efficient process. The cost and energy to construct and drive the flow has to be taken into account to ensure the economic profitability of the processes. Such studies have not been performed at this stage. In particular, the comparison between the viscous losses and the energy gains that are essential to understand whether the process is energy-effective or not have not been addressed.
For this purpose, we use two independent model systems:
An electrolyser made with a carbon and a platinum electrode respectively for HER and OER. The second system studied is a metal–air half-cell made with a zinc electrode and a nickel OER electrode. Zinc–Air complete batteries are often used in a configuration in which the Zinc electrode is connected to a gas-diffusion electrode during discharge and then switch to a gas-evolution electrode during the charge process17,18. In this
configura-tion, the charge process is done on a separate electrode (usually a Nickel OER electrode) without damaging the fragile gas-diffusion electrode used in discharge for ORR. The cell used in this study can thus carry out the elec-trochemical process of charging zinc–air batteries. We study in detail the dynamics of production of gas bubbles during charge at the electrodes as a function of the current density. We write a model taking into account the variation of the electrodes active surface that captures this process. We numerically simulate the viscous losses and compare these simulations to in situ measurements. We explain under which conditions flowing electrolyte is an appropriate solution to improve the efficiency of the battery. Figure 1 illustrates the two systems and their different different components.
Results
Voltammetry experiments.
The Voltammetry data are displayed in the supplementary material (see FigS1, S2, S3, S4). At the platinum electrode, only the OER and the HER are visible on the voltammogram. The oxidation reaction appears to start at 0.6 V vs (Ag/AgCl). For higher potentials the current density follows the Tafel equation I = I0exp
αnF(E−Eeq)
RT . We find I0=1.89 10−5 A and αnF
RT=20.9. On the cyclic voltammetry of nickel,
we clearly see additional oxidation and reduction peaks. After a few cycles, we observe for the positive currents a first peak around 0.5V vs Ag/AgCl. This peak is characteristic of the change in oxidation state from Ni(II) to Ni(III), where β-Ni(OH)2 is oxidized to β-NiOOH. The electrochemical equation is:
The oxidation current increase at a potential of approximately 0.6V vs Ag/AgCl, is attributed to oxygen evo-lution. For higher potentials the current density follows the Tafel equation (see supplementary materials Figure S4.). We find I0=7.2 10−3 A and αnFRT =13.9 . These parameters characterise kinetics of the oxygen evolution
reaction at our Pt and Ni electrodes.
The electrochemistry of the carbon electrode in alkaline solution is more complex and leads to the formation of a variety of functional groups on the surface of the graphite19,20. This oxidation also leads to the degradation
of the electrodes by the loss of graphitic surface layers when the layer becomes hydrophilic by the addition of oxygen functional groups. At negative currents these functional groups are reduced before the HER is observed. We find from the Tafel plot that I0=1.25 10−3 A and −αnFRT =12.4 . These parameters characterise the hydrogen
evolution reaction at our carbon electrode.
Cells voltage as a function of the flow rate.
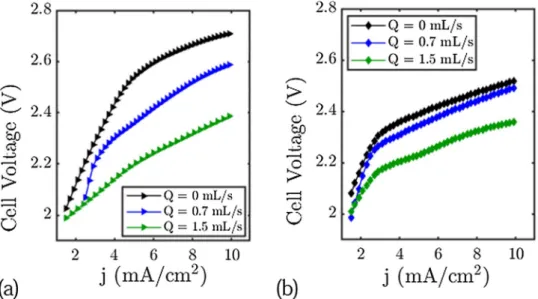
Figure 2 shows the cell voltage (the difference between the positive electrode and the negative electrode potentials) as a function of the current for different flow rates in the zinc cell and in the water electrolyser cell configuration.In both cases we observe a decrease of the cell voltage of more than 150 mV for current densities higher than 5 mA cm−2 and flow rates higher than 1.5 mL/s (160 mV for the Zinc-cell and 340 mV for the Platinum/Carbon
(3) β −Ni(OH)2+OH−→β −NiOOH + H2O + e−
cell for a flow rate of 1.5 mL s−1). For current densities lower than 2 mA cm−2, the flow just has little effect on the
cell voltage. We note that the decrease of the cell voltage is more important in the electrolysis cell. We anticipate that this is due to the electrolysis cell having two gas evolution electrodes. These data show the role of flow on cell voltage and confirm that the use of electrolyte flow is a good means of improving the performance of a rechargeable zinc cell or an electrolysis cell. In the next section, we will analyse what happens at each electrode.
Figure 1. Sketches of the two systems studied. (a) Zinc Cell and its components. (b) Electrolysis Cell and its
components.
Figure 2. Cell Voltage of the electrolysis cell and the Zinc cell setup for different flow rates. (a) Electrolysis cell.
www.nature.com/scientificreports/
Chronopotentiometry experiments: zinc cell OER nickel electrodes.
The zinc electrode. Forcur-rent densities between j = 1 mA cm−2 and j = 10 mA cm−2, we observe little impact of the flow on the Zinc
electrode overpotential (see Fig S5 in supplementary material). The variations of the cell voltage come from the variation of the Nickel OER electrode potential. Note that no gases are produced at the zinc electrode whereas oxygen is produced at the nickel electrode.
The nickel OER electrode. Figure 3 displays what happens at the nickel electrode. The situation is very differ-ent to the zinc electrode. For this electrode where oxygen bubbles are generated, the electrode potdiffer-ential during charging is lower under flow. The electrode potential decreases as a function of the flow rate, for flow rate com-prised between 0.3 mL/s and 1.5 mL s−1 and reaches a limit behavior for flow rate higher than 1.5 mL s−1. The
overpotential of the electrode is continuously increasing in absence of electrolyte flow, and a plateau is reached after only a few seconds when the electrolyte is flowing. The difference in the potential of the electrode using static and flowing electrolyte varies between 100 and 150 mV and is due to bubble removal as expected. The process may not remove all the gas bubbles from the surface in this case, the electrode overpotential obtained solely from the Butler–Volmer equation (described in the voltammetry part) is lower than the measured ones: in the low current density region (j = 3 mA cm−2), the potential with flow decreases until 0.7 V versus Ag/AgCl,
the theoretical voltage of the electrode according to Butler–Volmer equation and without taking bubble coverage in account at this current density is 0.67 V vs Ag/AgCl. The overpotential due to residual bubbles is thus limited and represents 30 mV for a flow rate of 1.5 mL s−1, while the value measured represents 130 mV for static
elec-trolyte after 10 min of experiment. (We measure a value of 150 mV at steady-state for static elecelec-trolyte). Increasing the current density leads to an increase of this overpotential: removing all the gas bubbles from the electrode surface at j = 20 mA cm−2 should give a potential around 0.8 V vs Ag/AgCl using the Butler–Volmer
equation while 0.95 V vs Ag/AgCl is measured with flowing electrolyte and more than 1 V with static electrolyte. In the high current density situation, we also measure noisy signals in the absence of flow and smooth signals when there is flow. These noisy signals (150 mV amplitude at j = 20 mA cm−2 in Fig. 3) can be attributed to the
departure of large bubbles from the electrodes. The large potential fluctuations appear after a certain time, which is inversely proportional to the current density. When this time has elapsed, the fluctuations appear randomly (typically after 130 s in Fig. 3). We will come back to the explanation of this phenomenon in the modeling section.
Chronopotentiometry experiments: platinum/carbon electrolyser.
The platinum electrode.Fig-ure 4 displays what happens at the Platinum plate.As in the previous section, the overpotential at the Pt electrode during oxygen production is reduced with flow. For j = 3 mA cm−2, we measure a potential of 0.55 V (0.7 V for
Figure 3. Chronopotentiometry of the Nickel electrode versus Ag/AgCl electrode during OER in 8M KOH/1M
static electrolyte), and the calculated overpotential from the Butler–Volmer equation gives approximately the same value. All the oxygen bubbles appear to be evacuated by the flow. Increasing the current density decreases the efficiency of the flow process as seen in the previous subsection: for j = 20 mA/cm2 , bubble-free surface of
the electrode should give 0.75 V (vs Ag/AgCl) while we are measuring 0.95 V. The process still has its interest because the potential with static electrolyte at this current density is around 1.15 V. We note that the fluctuations in potential in the absence of flow at high current densities (typically less than 0.1V at j = 20 mA/cm2 in Fig. 4)
are of smaller amplitudes than at the Nickel grid. This can be due to differences in the nature of the electrode, in geometry, and surface differences which modifies the dynamics of bubbles departure from the electrode. At low current density, we also see that the measurements decrease slowly towards a plateau value which varies between 0.6 and 0.55 Volt. We will comment this point in the modeling section.
The carbon electrode. Figure 5 displays what happens at the carbon plate during HER. The electrode exhibits a similar behaviour to those observed above.
The electrode potential during hydrogen production increases with flow: in the low current density situation, we measure − 1.23 V vs Ag/AgCl with flowing electrolyte, and − 1.29V vs Ag/AgCl with static KOH; the theoreti-cal potential for a bubble-free electrode/electrolyte interface (pH14) is − 1.20 V vs Ag/AgCl. As seen previously the process is less efficient at high current density: For j = 20 mA cm−2, the calculated potential of the bubble-free
electrode by the model is − 1.34 V vs Ag/AgCl, whereas it is measured to be − 1.47 V with flowing electrolyte (Q = 1.5 mL s−1), and around − 1.66 V at Q = 0 mL s−1. We observe a large variation of the potential under flow
which is close to 200 mV at j = 20 mA cm−2 in Fig. 5. In the high current density situation, the amplitudes of the
potential fluctuations with static electrolyte are close to 100 mV.
Bubble visualisation.
In order to link the measured signals and the mechanisms of bubble formation and detachment, we performed optical measurement using the device described in the experimental section. These measurements can be made more simply on the nickel grid and would be more complex on the Platinum and Carbon plates which are solid and opaque. We will present detailed measurements on the Nickel grid and more scattered measurements on the other two electrodes. The influence of current density and flow rate on bubbles formation and detachment are investigated.On the Nickel grid, (see Fig. 6a) for current densities below 1 mA/cm2 , we observe the formation of bubbles
that grow very slowly. Typically 2–3 bubbles appear simultaneously on the same mesh.These bubbles grow, meet and coalesce to occupy the entire mesh (the side length of a mesh is 550 microns). When two bubbles occupying
Figure 4. Chronopotentiometry of the Platinum electrode versus Ag/AgCl electrode during OER in 8M
www.nature.com/scientificreports/
two different meshes meet and coalesce, the resulting bubble leaves the electrode under the action of Archimedes’ buoyant force. The surface tension forces are no longer large enough to hold it on the grid. The average value of the radius of the bubbles leaving the grid is 550 microns. This radius might correspond to the Fritz radius i.e the size at which the buoyancy force equals the adhesion. Note that this radius might be smaller21. Indeed the excess
of surface energy generated during coalescence might be enough to overcome the adhesion energy. After a large bubble leaves, new bubbles form. These bubbles appear at the same nucleation sites as the previous ones which suggests that those are preferred nucleation spots. At these currents,the number of bubbles remains very limited.
Figure 5. Chronopotentiometry of the carbon electrode versus Ag/AgCl electrode during OER in 8M
KOH/1M zincate electrolyte. (a) j = −3 mA/cm2 . (b) j = − 10 mA/cm2 . (c) j = − 20 mA/cm2.
Figure 6. Picture of the bubbles on a grid of Nickel (a) as a function of the intensity current for Q = 0 mL s−1.
For current densities of the order of 1 mA cm−2, a second population of bubbles of smaller radius appears.
These small bubbles leave the electrode quickly in spite of their size (typically around 30 microns) and do not have time to grow. This means that they are formed at different sites from the first ones, they are less retained by the grid. This may be due to surface differences. The grid displays inhomogeneities, possibly also in the thickness of the nickel hydroxide surface layer. At these currents, the small bubbles have no impact on the large ones which follow the same evolution as for lower currents. For current densities above 3 mA cm−2, the number of small
bubbles increases. Their departure from the grid and the hydrodynamic recirculations that accompanies it favors the release of the large bubbles. The radius of the large bubbles that detach decreases from 550 micrometers for 1 mA cm−2 to 100 micrometers for 3 mA cm−2 which is certainly below the Fritz radius.
When they leave the electrodes, the small bubbles form a plume22. They are separated by a given distance and
leave perpendicularly from the interface. By increasing the current density from 5 to 20 mA cm−2 the
produc-tion of small bubbles becomes more and more intense, decreasing the critical radius of the large bubbles. At 20 mA cm−2, the average of the critical radius of large bubbles reaches 74.55 microns, their lifetime on the grid is
low, their growth is mainly due to coalescence events. The same behavior (i.e the existence of a bimodal popula-tion) is observed on the platinum plate in the electrolysis cell. However we do not observe bubbles reaching 550 microns (ie the size of the mesh of the Nickel grid) at low current densities because the geometry of the electrode is different. Figure 7a displays the bubble size distribution on the Ni grid for three current densities. These data were obtained by statistical analysis over 100 bubbles for each current density. The bubble distributions confirm the previous descriptions. The distribution is bimodal as reported in previous experiments on water electrolysis22:
in the first 10 min after initiating the current, the bubble distribution is bimodal. It evolves toward a log normal distribution when steady state is reached, which takes more than two hours. Note that experiments performed on an electrode with designed cavities gives a single mode distributrion23. The electrodes surfaces are non-ideal
and can present inhomogeneities coming from their natural roughness. Gas cavities on non-ideal surfaces are known to be nucleation and growth sites for bubbles. The electrodes used in this study can present different type of gas cavities leading to different population of bubbles. In the case of the Nickel electrode, the hydroxide layer formed during oxidation can generate other cavities reinforcing the surface inhomogeneity of the electrode.
The number of small bubbles increases with the current and then plateaus. The average size of the large bub-bles decreases with the current. Due to the opacity of the platinum plate and the carbon plate, the transmission microscope could not be used to measure and acquire the same data. However, the following conclusions can be drawn. In all cases the distribution is bimodal. The small bubbles on the platinum plate have an average size of 30 microns, the radius of the large bubbles decreases with the current from 122 to 70 microns. On the carbon electrode, the hydrogen bubbles are much smaller, the smallest ones have a radius of 15 microns and the largest ones have a radius of 45 microns which does not vary too much with the current density.
We also used this cell to perform experiments under flow. Figure 6b shows pictures of the nickel grid under a current density of 3 mA cm−2 for several flow rates at steady-state. The number of bubbles from both population
on the electrode decreases significantly when the flow rate is increased. This behavior is more pronounced for large bubbles (see Fig. 7b). For high flow rates, the distribution tends to a uni-modal distribution. Increasing the value of the flow rate also decreases the detachment radius of the two populations.
Discussion
In the following section we will propose a model of the observed phenomena based on a phenomenological approach. In this simple model we describe the effect of the flow on the bubble removal from the electrode. In this model different parameters are fitted. We analyze these fitting parameters and compare them to experimental measurements.
Reduction in energy consumed.
The previous measurements show a significant reduction in the overpo-tential of the bubble generating electrodes with flowing electrolyte. The performances of the cells are thereforeFigure 7. Size distribution of bubbles before departure from the Ni grid. (a) Influence of the current density at
www.nature.com/scientificreports/
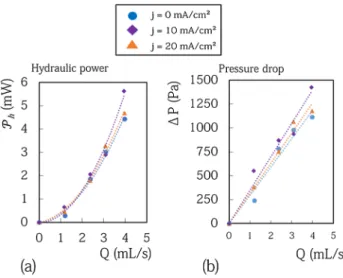
improved : the cells require less power in operation. A zinc cell can thus be charged faster for a fixed voltage and can be charged with higher energy efficiency for a given charge current. From an economical point of view, a reduction between 150 and 300 mV in these configurations is a real gain. It corresponds to a gain around 10% on the overall power of the cells. To corroborate this, it is necessary to compare the power gain due to the reduc-tion in overpotential with the power required to circulate the electrolyte in the cell Ph . We have measured the
pressure drop in the cell P as a function of the flow rate and deduced the power of the viscous losses Pcell= PQ .
The data are displayed in Fig. 8. The measured power dissipated in the cell due to viscous loss is less than 6 mW whatever the experimental conditions. These values are in perfect agreement with a crude estimate of the viscous loss that can be made assuming low Reynolds number (less than 100) and neglecting the drop of pressure in the corners and in the junctions. In this situation the power dissipated for rectangular sections writes Ph=12Q
2ηL cell
h3cellwcell
+612Q2ηLchannel
h3channelwchannel where Q is the flow rate, hcellthe thickness of the cell which is equal the thickness
of the spacer, hchannel the thickness of the channel, Lcell the length of the cell, Lchannel the length of the channels,
wchannel the width of the channel, wcell the width of the cell. The prefactor 6 for the channels term comes from the
number of channels present in the cell. For our cell we have: 12ηLcell
h3
cellwcell=1.17 10
6 Pa s m−3 . For the 6 channels the
calculation gives: 6 12ηLchannel
h3
channelwchannel=1.37 10
8 Pa s m−3 . This shows that the viscous losses happen mainly in the
chan-nels. This analysis leads to an estimated dissipated power equal to 2.8 mW for Q = 4 mL s−1. This value is in good
agreement with the measurement equal to 4 mW for Q = 4 mL s−1. The disagreement between the estimated
values and the measured ones could be related to the fact that the previous expressions are formally valid only for w
h > 10 , which is not the case for the channels. To conclude let us highlight that the measurements are very
little affected by the presence of electric current. This means that the bubbles present in the electrolyte only slightly modify its viscosity.
According to the previous measurements, the power required to circulate the electrolyte in the whole cir-cuit is equal to 0.3 mW for a flow rate of Q = 1.5 mL s−1. For the Zinc-cell, the viscous losses for Q = 1.5 mL s−1
corresponds to 2.9% of the power gained due to the decrease of the overpotential Pelec=I V where dV is the
overpotential and I the current ( Pelec=13 mW). The net power gain at j = 10 mA/cm2 is 12.7 mW and represents
6 % of the overall power of the cell. For the electrolysis cell, viscous losses represent 1.6% of the power gained and the net power gain at j = 10 mA cm−2 is 21.13 mW which represents 10% of the overall power of the cell.
At this stage, the dissipation in the tubing have not been discussed. In our set up they are negligible. They write Ptubing=8Q
2ηL
R4t , and corresponds to 185 µ W for Q = 5 mL s −1 with R
t the radius of the tubing (here 3mm),
Lt the tubing length (here 30 cm). These losses vary as a function of Rt at the power 4 suggesting that the use of
tubing with a radius of 1 mm instead of 3 mm will lead to an increase of the dissipated power in the tubing of 81 times. This shows clearly that a particular care in the choice of the tubing has to be brought in order to get a posi-tive balance at the end.
Modeling.
The hypothesis used is that the decrease in the overpotential is related to the release of the bub-bles by the electrolyte flow. Sweeping the bubbub-bles away increases the effective or working area of the electrodes and thus decreases the overpotential. We have taken into consideration two bubble populations.This hypothesis is based on our observations and on previous reported experiments22. The originality of our model is to capturethe temporal evolution of the overpotential which was not the case in the previous models24,25.For the sake of
simplicity we assume the following hypotheses: the size of the bubbles for each population is constant. The size of the small bubbles is set to Rb=15 µ m. The size of the large bubbles Ra varies as a function of the flow rate
and of the current density. We define Na(t) and Nb(t) as the number of bubbles of respectively size Ra and Rb
Figure 8. (a) Hydraulic power required to flow the electrolyte in the cell for various flow rate and various
number of bubbles that leaves the surface by unit time due to the flow for the bubbles of size Ra , and −γb(I)QNb
for bubbles of size Rb . We take the assumption that the parameters αa(I), αb(I)βa(I)βb(I)γa(I)γb(I) depend on
I and not on the local current density j, a mean field approximation which is the basis of this simple model. As the surface decreases when bubbles are present, the local current density value increases with time during the chronopotentiometry experiments. We have neglected these second order variation in the model.
The conservation of the number of bubbles is expressed by:
The parameters αa(I) , αb(I) are linked by the volume of oxygen produced.
VO2(t) is the oxygen volume produced after time t, F is the Faraday constant, Vm is the molar volume and Va &
Vb are the volumes of the bubbles of radius Ra & Rb respectively.
This set of equation enables us to calculate the active surface S(t)of the electrode as a function of time : where Sa and Sb are the surfaces covered by bubbles from population a and b. The expression of these surfaces
are related to the local supersaturation of gas, to the contact angle (which varies with the intensity of the electric field and which depends according to the material), and to the surface of the electrode24,26. In our situation, the
electrolyte is wetting the electrodes. We assume here an average value for the covered surface by bubbles which is proportional to πr2
a,b by a factor K. Following24,26,27, we take K = 1. Such definition of the bubble coverage is
correct because the current density on the shaded area below the bubbles is nil or very low. S0 corresponds to the
total surface of the electrode in contact with the electrolyte when there is no bubbles on its surface.
Finally, the Butler–Volmer equation allows us to find the evolution of the potential taking into account the surface evolution:
I is the current over the electrode. I0 and α0 are deduced from the Tafel fit. These equations take into account
the overpotential due to the kinetics of the reaction in absence of bubbles and the overpotential due to the pres-ence of the bubbles coined hyperpolarization of the electrode in28. We have neglected the Ohmic loss due to the
internal resistance of the cell, the overpotential created by the concentration gradients close to the interface, the overpotential created by the solubilization of gazes in the electrolyte. Each of these overpotential are comprised between 1 and 10 mV in our situation28.
During the Voltammetry experiments, the scan velocity is high enough to avoid the production of bub-bles over the electrode since the charge passed through this short experiment remains quite low. Voltammetry experiments were also performed in presence of flow to determine I0 , in both cases we report the same values.
This model has five independent fitting parameters αb(I), βa(I), γa(I), βb(I), γb(I) and can be resumed by the
equations 4, 5, 7, 8. Using a least squares procedure to fit the experimental values (over various voltammetry data for various flow rates), we calculated them as a function of the current. Ra and Rb have been measured in
the experimental section and are not fitting parameters.
The chronopotentiometry experiments are a close fit to this simple model (see Figs. 3, 4, 5). Before analysing the measured parameters, let us return to the remark made in the chronopotentiometry section. The fit of the low current model is not as good as the high current model in terms of kinetics. The experimental points are above the model. This is due to the fact that at low current, the initial state of the surface is very important. If bubbles have not been expelled from the surface, these bubbles will take some time to be expelled and will result (4) dNa(t)
dt =αa(I) − βa(I)Na−γa(I)QNa
(5) dNb(t)
dt =αb(I) − βb(I)Nb−γb(I)QNb
(6) dVO2(t) dt = VmI 4F =αa(I)Va+αb(I)Vb (7) S(t) = So−Na(t)Sa−Nb(t)Sb (8) E = Eeq+ RT zα0F ln( S0 S(t)) + RT zα0F ln(I I0 )
www.nature.com/scientificreports/
in higher potential than expected. At high currents, these bubbles are very quickly masked by the bubbles created by the current so that the fit works perfectly.
Table I, II and III display the values of these phenomenological parameters as a function of the current. The three electrodes tested share the same behavior. αa(I) and αb(I) are both proportional to I, they check Equation 6.
We recall that αa(I) is not a fitting parameter it is calculated from αb(I) . αb(I) is higher than αa(I) because the
number of small bubbles is higher than the number of large ones. Also, the total volume of oxygen αaVa present
in large bubbles is less than the total volume of oxygen αbVb in small bubbles even if the population A is larger
in size. βb(I) is higher than βa(I) . This is consistent with what is expected. All bubbles develop at the same rate,
it naturally takes longer for a large bubble to reach the largest size.
We recall that γ is the flow parameter which gives the number of bubbles released by the electrolyte flow per unit time. γa values are lower than γb ones, at first sight it is also surprising since the drag force of the liquid
exerted on a bubble increases with the square of the bubble radius and should thus be higher for larger bubbles24.
However, as shown by microscopic visualisation, small bubbles form trains of bubbles and the drag force in the plume is higher than the one close to a surface. This explains why the parameter γ decreases as a function of the bubble size. γ values do not depend upon the intensity of the current. This comes from the fact that the drag force is not related to the bubble formation frequency.
As mentioned at the beginning of the paragraph, the three electrodes tested have similar fit parameter values. However, there is an important difference in the γ parameters. The effect of flow is more modest on a Nickel grid than on Carbon and Platinum plates. It could be due to the geometry of the electrode which can keep bubbles trapped in the mesh. The greater the γ parameter, the greater the energy gain on the battery or electrolyser. A plate would therefore be more efficient for the application in this specific configuration.
The results in Fig. 3 illustrate this lower efficiency, especially at high current density. At j = 20 mA cm−2, the
potential difference between flowing and static electrolyte is about 60 mV, against 150 to 200 mV for the carbon and platinum electrode. Linear interpolations of the numerical parameters evolution enables the potential of the electrode to be calculated for higher current densities at a given flow rate.
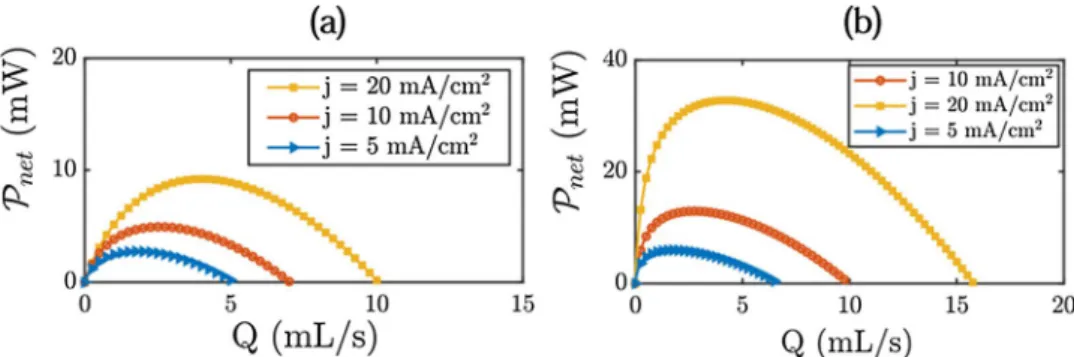
Figure 9 shows the modelling results of the total power reduction in charge by using flowing electrolyte. These results take in account the viscous losses in the cells. Viscous losses increases with the flow rate and the modelling results allow to define the flowing conditions for a positive energy gain. This gain is positive for flow rates lower than 10 mL s−1 for the Zinc cell and lower than 15 mL s−1 for the electrolysis cell. The optimal flow
rate corresponds to the maximum of the curves shown in Fig. 9. The power gained is higher on the electrolysis cell which presents two gas evolution electrodes.
Conclusion.
In this work, we have studied the behavior of gas-evolving electrodes in presence of electrolyte flow. We introduce new elements in favor of the use of flow batteries outside the renewable energies sector. It has previously been shown that flow may reduce the dendrite formation. We have shown that electrolyte flowFigure 9. Net power gained calculated by the analytical model for the different systems studied. (a) Zinc cell.
(b) Electrolysis cell.
Table 1. Modelling parameters for the platinum electrode.
J (mA cm−2) 3 5 7.5 10 20 Ra(µm) 120 90 79 77 70 Rb(µm) 15 15 15 15 15 αa(I) 7 20 23 31 69 αb(I) 104 4 7 11 15 30 βa(I) 0.0070 0.0085 0.0120 0.0180 0.0215 βb(I) 0.14 0.2 0.31 0.4 0.78 γa(I) 6000 6000 6000 6000 6000 γb(I) 105 3 3 3 3 3
also decreases the overpotential at the electrodes producing gas. This behavior is quite general and occurs both on a platinum plate and on a nickel grid electrode. The reason is simple: the flow sweeps the bubbles and avoid the decrease of the effective area of the electrode. We point out that this may induce 7.5% of gain on the overall charge power of the battery for a current density less than j = 20 mA cm−2. This gain takes into account the
vis-cous losses induced by the circulation of the electrodes.
These losses can be easily decreased by using an appropriate hydraulic circuit which avoids high hydraulic resistance. We have also developed a simple model to predict the performance of the cell. We believe that such a model is important for the scale up and industrialization phases of a battery. As the flow process is cost-effective, it could be coupled with zinc air batteries for vehicles. It should be noted that fuel cells have already been pro-posed for this type of application29,30.
Methods
Electrolytes.
The electrolyte used to study the effect of the flow on the electrodes potentials is an 8M aque-ous solution of potassium hydroxide. This electrolyte is prepared by dissolving KOH (Sigma-Aldrich) in deion-ised water. The high concentration of hydroxide ions ensures the high conductivity of the solution. For the Zinc cell, zincates ions at a concentration of 1M are electrochemically added to the 8M KOH solution to ensure zinc electrodeposition at the Zn electrode and avoid HER during the charge process.Millifluidics cells for chronopotentiometry.
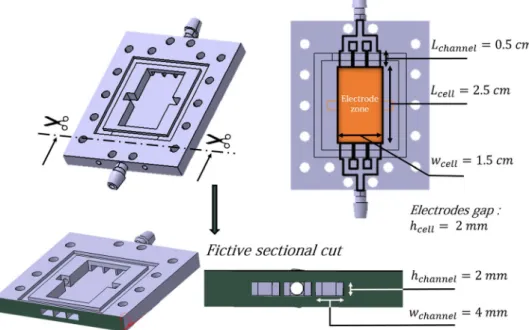
To test the various experimental conditions, two experi-mental home-made devices are used as a flow systems (see Fig. 10): a Zinc cell and a Platinum-Carbon electroly-sis cell. Both cells are used vertically. In both situations, we used a 3D UV resin printer (Form 3, Formlabs) to create the network of channels necessary for electrolyte circulation. The resin used is a mixture of methacrylic acid esters and photoinitiator (Clear Photoreactive Resin for Formlabs 3D printers, Formlabs) and the resulting shapes are chemically stable towards hydroxide ions at high concentrations.We took the advantage of additive manufacturing by developing flow cells with integrated millifluidics channels for electrolyte circulation. These type of shapes cannot be made by classical manufacturing processes. Stereolithography has the advantage of freeing itself from several manufacturing constraints inherent in other manufacturing processes. The input of the flow system is divided into 3 channels. Each of these 3 channels has a cross-section 2 mm x 4 mm, and a length of 5 mm. At the output, 3 channels identical to those of the input are combined into one output channel. The output and input channels are connected to a tank of electrolyte by tubing (PharMed BPT, Saint-Gobain) with an internal radius of 3 mm and a length of 30 cm. The electrodes lies between the input zone and the output zone (see the orange zone in Fig. 10). Their composition is displayed below. Bubble-free electrolyte from the lower part of the tank is injected into the system inlet, whilst the electrolyte with oxygen bubbles from the cell is evacuated from the system outlet and injected into the upper part of the tank using a peristaltic pump (VWR PP3300). The flow rate was varied between 0 and 1.5 mL s−1. Under these conditions, the flow remains laminarand no turbulence occurs. To characterize this feature, we calculated the Reynolds number which is the ratio
Table 3. Modelling parameters for the carbon electrode.
J (mA cm−2) 3 5 7.5 10 20 Ra(µm) 45 45 45 45 45 Rb(µm) 10 10 10 10 10 αa(I) 85 119 153 171 339 αb(I) 104 30 50 75 102 196 βa(I) 0.0850 0.0931 0.1010 0.1150 0.2561 βb(I) 0.40 0.54 0.76 1.01 1.98 γa(I) 8000 8000 8000 8000 8000 γb(I) 105 4 4 4 4 4
www.nature.com/scientificreports/
between the inertial forces and the viscous forces, Re = ρUh η =
ρQ
wη where ρ is the fluid density, U the mean
veloc-ity, h the distance between the two plates, w the width of the spacer and Q the flow rate. With w = 1.5 cm, η = 2.5 103 Pa s, ρ = 1000 kg m−3 , this leads to Reynolds number between 0 and 40 which corresponds to laminar flow. Zinc Cell. The electrodes are fixed in the zone between the inlet an the outlet (see orange zone in Fig. 10). The negative zinc electrode is a plate which is 0.25 mm thick, 2.5 cm long and 1.5 cm wide. The positive OER nickel grid electrode has a mesh size of 550 microns and is 2.5 cm long and 1.5 cm wide.
Inside this Zinc flow cell, the zinc electrode is covered by a non-selective porous membrane (Celgard 4001) with 41% porosity and a thickness of 25 µ m. This type of membrane is classically used in Zinc batteries as a separator to prevent a short-circuit between the electrodes. An additional home made separator fixes the dis-tance between the two electrodes at 2 mm. Figure 1 illustrates the Zinc-cell setup and its different components.
Platinum‑Carbon set up. The electrodes are fixed in the zone between the inlet an the outlet (see orange zone in
Fig. 10). The platinum and carbon electrodes are plates (GoodFellow). Electrodes are 0.25 mm thick, 2.5 cm long and 1.5 cm wide. A home made separator fixes the distance between the two electrodes at 2 mm. The configura-tion of the cell is the same as for the Zinc-cell setup shown in Fig. 1, replacing zinc anode and separator by the carbon electrode and the nickel OER electrode by the platinum electrode.
Optical measurements.
Home-made cells designed for optical characterisation are held at the focal length of a microscope lens (magnification: ×1.25), the microscope itself is connected to a digital microscope camera (Magnification ×10, 10 frames per seconds) (Dinolite). The counter part of the cells presented in figure ?? is replaced by a glass slide to allow the optical measurements (see Fig. 11). The setup is connected to the peristaltic pump and the current generator. This device makes it possible to carry out experiments under the microscope for several flow rates and several current densities. The counter electrode (Zinc plate) is positioned so as not to obstruct bubble visualisation at the Nickel grid. The same observations were also performed for the Platinum/ carbon system, Platinum is the positive electrode for OER in this situation. Given that it is a full, solid plate and not a grid, we are not able to monitor the formation of the oxygen bubbles on this electrode, we just characterize the size of the bubbles after their departure from the Platinum plate.Electrochemical characterization.
The electrochemical behaviour of each electrode in our 2 systemswas studied using a CH Instrument 600E potentiostat. The nickel electrode or the platinum electrode are setup as the working electrode whilst the zinc electrode or the carbon electrode are counter electrodes.
Cyclic Voltammetry. The systems were characterised by cyclic Voltammetry at a scan rate of 50 mV.s−1. In all
experiments, a silver chloride Ag/AgCl (KCl sat.) reference electrode was used to measure the potential of the working electrode.
Figure 10. CAD sketch of the cell and associated dimensions. The output and input channels are connected to
a Tank of electrolyte by a tubing (PharMed BPT, Saint-Gobain) with an internal radius of 3 mm and a length of 30 cm.
Chronopotentiometry. A constant current is caused to flow between the working electrode and the counter
electrode. The potential changes of the working and counter electrodes are recorded with respect to the refer-ence electrode.
The chronopotentiometry experiments are performed in absence and in presence of the flow. We used flow rates between 0 mL s−1 and 1.5 mL s−1, these corresponds to Reynolds numbers range between 0 and 24. Each
experiment with electrolyte flow is made following a well defined protocole. First a current is applied in absence of flow. The potential of both electrodes is simultaneously recorded for 10 min, then the current is interrupted and the remaining bubbles are swept by using the electrolyte flow (Q = 1.5 mL s−1) for 10 s. This allows us to
sweep the bubbles and start the measurement with a clean surface. We anticipate that a few bubbles may remain on the surface even with the use of flow. We will see in the following that this may cause a slight discrepancy between the modeling and the data. The interruption of the previous flow (ie Q=1.5 mL s−1) or a change of this
flow used to remove bubbles combined with the start of the current marks the beginning of the next experiment. The following currents were studied: 3, 5, 7.5, 10, 20 mA cm−2.
Measurements of the viscous losses.
In order to measure the viscous losses related to the flow in the cell, we carried out pressure drop measurements as a function of the flow rate (see Fig. 12). For this we connect the cell with a syringe and applied a pressure drop Pglobal between the top of the syringe and the outlet of thecell thanks to a pressure controller (Fluigent). The maximal applied pressure by the controller is 700 mbar and the precision over the full range of measurement is equal to 10 Pa according to the manufacturer’s specifications. We set the pressure at the inlet of the cell and the outlet is at atmospheric pressure. To measure the flow rate, we weight the mass of electrolyte which flow from the cell with a precision scale. The measurements are averaged over 5 min. These experiments are performed in presence or absence of the electrical current in order to probe the influence of the bubbles over the hydrodynamic losses.
We get a relation between the global pressure drop Pglobal and the flow rate. In order to separate the
contri-bution of pressure drop upstream of the cell (i.e in the syringe and in the tubing) Pst and of the one occurring
in the cell itself P , the same experiments are carried out in the absence of the cell. We measure the relation
Figure 11. Schematic view of the microscope observations set-up. 1: Acquisition system, 2: Camera, 3: Mirror,
4: Microscope lens, 5: Electrochemical cell, 6: Scattered light.
www.nature.com/scientificreports/
between the pressure drop in the syringe and in the tubing Pst and the flow rate. The pressure drop in the cell
P is deduced by making the difference between the two measurements ( P = Pglobal− Pst ). The flow rate
Q is measured by weighing the quantity of fluid leaving the cell after 5 min of flow. These measurements are
carried out in the presence and absence of electric current in order to probe the role of bubbles in viscous losses. The power of viscous losses in the cell Ph corresponds to the product Ph= PQ.
Received: 27 October 2020; Accepted: 15 January 2021
References
1. Carmo, M., Fritz, D. L., Mergel, J. & Stolten, D. A comprehensive review on PEM water electrolysis. Int. J. Hydrogen Energy 38(12), 4901–4934 (2013).
2. Lee, J. S. et al. Metal-air batteries with high energy density: Li-air versus Zn-air. Adv. Energy Mater. 1, 34–50 (2011).
3. Fu, J. et al. Electrically rechargeable zinc-air batteries: progress, challenges, and perspectives. Adv. Energy Mater. 29, 1604685 (2017).
4. Tahir, M. et al. Electrocatalytic oxygen evolution reaction for energy conversion and storage: a comprehensive review. Nano Energy
37, 136–157 (2017).
5. Fabbri, E., Habereder, A., Waltar, K., Kötz, R. & Schmidt, T. J. Developments and perspectives of oxide-based catalysts for the oxygen evolution reaction. Catal. Sci. Technol. 4(11), 3800–3821 (2014).
6. Troostwyk, A.P.V., & Deiman, J.R., Sur une manière de décomposer l’Eau en Air inflammable et en Air vital. Observations sur la physique, sur l’histoire naturelle et les arts. 35, 369–378 (1789).
7. Dubouis, N. & Grimaud, A. The hydrogen evolution reaction: from material to interfacial descriptors. Chem. Sci. 10(40), 9165–9181 (2019).
8. LeRoy, R. L., Janjua, M. B. I., Renaud, R. & Leuenberger, U. Analysis of time-variation effects in water electrolyzers. J. Electrochem.
Soc. 126(10), 1674–1682 (1979).
9. Angulo, A., van der Linde, P., Gardeniers, H., Modestino, M. & Rivas, D. F. Influence of bubbles on the energy conversion efficiency of electrochemical reactors. Joule 4(3), 555–579 (2020).
10. Wang, M., Wang, Z., Gong, X. & Guo, Z. The intensification technologies to water electrolysis for hydrogen production-A review.
Renew. Sustain. Energy Rev. 29, 573–588 (2014).
11. Darband, G. B., Aliofkhazraei, M. & Shanmugam, S. Recent advances in methods and technologies for enhancing bubble detach-ment during electrochemical water splitting. Renew. Sustain. Energy Rev. 114, 109300 (2019).
12. Phillips, R., Edwards, A., Rome, B., Jones, D. R. & Dunnill, C. W. Minimising the ohmic resistance of an alkaline electrolysis cell through effective cell design. Int. J. Hydrogen Energy 42(38), 23986–23994 (2017).
13. Zhang, D. & Zeng, K. Evaluating the behavior of electrolytic gas bubbles and their effect on the cell voltage in alkaline water electrolysis. Ind. Eng. Chem. Res. 51(42), 13825–13832 (2012).
14. Bongenaar-Schlenter, B. E., Janssen, L. J. J., Van Stralen, S. J. D. & Barendrecht, E. The effect of the gas void distribution on the ohmic resistance during water electrolytes. J. Appl. Electrochem. 15(4), 537–548 (1985).
15. Hine, F., Yasuda, M., Ogata, Y. & Hara, K. Hydrodynamic studies on a vertical electrolyzer with gas evolution under forced circula-tion. J. Electrochem. Soc. 131, 1,83 (1984).
16. Wang, K. et al. Dendrite growth in the recharging process of zinc-air batteries. J. Mater. Chem. 3, 22648–22655 (2015). 17. Wang, K. et al. Growth of oxygen bubbles during recharge process in zinc-air battery. J. Power Sources 296, 40–45 (2015). 18. Toussaint, G., Stevens, P., Akrour, L., Rouget, R. & Fourgeot, F. Development of a rechargeable zinc-air battery. ECS Trans. 28(32),
25 (2010).
19. Yi, Y. et al. Electrochemical corrosion of a glassy carbon electrode. Catal. Today 295, 32–40 (2017).
20. Noel, M. & Anantharaman, P. N. Voltammetric studies on glassy carbon electrode I: electrochemical behaviour of glassy carbon electrodes in H2SO4, Na2SO4 and NaOH media. Surf. Coat. Technol. 28, 161–179 (1986).
21. Soto, Á. M., Maddalena, T., Fraters, A., Van Der Meer, D. & Detlef, L. Coalescence of diffusively growing gas bubbles. J. Fluid Mech.
846, 143–165 (2018).
22. Chandran, P., Bakshi, S. & Chatterjee, D. Study on the characteristics of hydrogen bubble formation and its transport during electrolysis of water. Chem. Eng. Sci. 138, 99–109 (2015).
23. Lee, S., Sutomo, W., Liu, C. & Loth, E. Micro-fabricated electrolytic micro-bubblers. Int. J. Multiph. Flow 31(6), 706–722 (2005). 24. Eigeldinger, J. & Vogt, H. The bubble coverage of gas-evolving electrodes in a flowing electrolyte. Electrochim. Acta 45(27), 4449–
4456 (2000).
25. Hine, F., Yasuda, M., Nakamura, R. & Noda, T. Hydrodynamic studies of bubble effects on the IR-drops in a vertical rectangular cell. J. Electrochem. Soc. 122, 9,1185 (1975).
26. Vogt, H. The quantities affecting the bubble coverage of gas-evolving electrodes. Electrochim. Acta 235, 495–499 (2017). 27. Vogt, H. Contribution to the interpretation of the anode effect. Electrochim. Acta 42(17), 2695–2705 (1997).
28. Leistra, J. A. & Sides, P. J. Voltage components at gas evolving electrodes. J. Electrochem. Soc. 134(10), 2442 (1987).
29. Kordesch, K. et al. Intermittent use of a low-cost alkaline fuel cell-hybrid system for electric vehicles. J. Power Sources 80(1–2), 190–197 (1999).
30. Zeng, K. & Zhang, D. Recent progress in alkaline water electrolysis for hydrogen production and applications. Prog. Energy Com‑
bust. Sci. 36(3), 307–326 (2010).
Acknowledgements
We acknowledge support from the Agence Nationale de la Recherche (project Fluididense ANR-17-CE07- 0040), from Institut Pierre-Gilles de Gennes (laboratoire d’excellence, Investissements d’avenir program ANR-10-IDEX-0001-02 PSL and ANR-10-LABX-31 and ANR-10-EQPX-34), and the Association Nationale de la Recherche et de la Technologie (ANRT).
Author contributions
S.I., A.C., A.G., N.D., P.S., G.T. designed the experiments, S.I., N.D. did the experiments, A.C., S.I. wrote the main manuscript text and prepare the figure. All authors reviewed the manuscript.
Competing interests
permitted by statutory regulation or exceeds the permitted use, you will need to obtain permission directly from the copyright holder. To view a copy of this licence, visit http://creat iveco mmons .org/licen ses/by/4.0/.