HAL Id: hal-01599993
https://hal.archives-ouvertes.fr/hal-01599993
Submitted on 7 Nov 2018
HAL is a multi-disciplinary open access
archive for the deposit and dissemination of
sci-entific research documents, whether they are
pub-lished or not. The documents may come from
teaching and research institutions in France or
abroad, or from public or private research centers.
L’archive ouverte pluridisciplinaire HAL, est
destinée au dépôt et à la diffusion de documents
scientifiques de niveau recherche, publiés ou non,
émanant des établissements d’enseignement et de
recherche français ou étrangers, des laboratoires
publics ou privés.
Surface characterization of reservoir rocks by inverse gas
chromatography: Effect of a surfactant
K. Bendada, B. Hamdi, L. Boudriche, H. Balard, Rachel Calvet
To cite this version:
K. Bendada, B. Hamdi, L. Boudriche, H. Balard, Rachel Calvet. Surface characterization of reservoir
rocks by inverse gas chromatography: Effect of a surfactant. Colloids and Surfaces A:
Physico-chemical and Engineering Aspects, Elsevier, 2016, 504, p. 75-85. �10.1016/j.colsurfa.2016.05.047�.
�hal-01599993�
Surface characterization of reservoir rocks by inverse gas
chromatography: Effect of a surfactant
K. Bendada
a, B. Hamdi
a,b, L. Boudriche
c, H. Balard
d, R. Calvet
e,∗aLab. d’Etude Physico-Chimique des matériaux et Application à l’Environnement, Faculté de Chimie, USTHB, BP 32 El Alia, Bab Ezzouar, 16111 Alger, Algérie bENSSMAL, BP 19 Bois des Cars, Dely Ibrahim, 16320 Alger, Algérie
cCentre de Recherche Scientifique et Technique en Analyses Physico-Chimiques (C.R.A.P.C), BP 384, Bou-Ismail, RP, 42004 Tipaza, Algérie dAdscientis, 1 Rue Kastler, 68310 Wittelsheim, France
eUniversité de Toulouse, Mines Albi, CNRS UMR 5302, Centre RAPSODEE, Campus Jarlard, F-81013, Albi Cedex 09, France
g r a p h i c a l a b s t r a c t
0 0.02 0.04 0.06 0.08 0.1 0.12 0.14 0.16 0.18 5 10 15 20 25 30 35 40 45 Energy (kJ/mol) Afterimpregnation with surfactant Raw rock χ(ε)(µmol/(kJ/mol)) IsopropanolThe asymmetric distribution function obtained by Inverse gas chromatography at finite concentration on a reservoir rock becomes symmetric after the surface covering by the surfactant. This latter hid chemical functions likely to interact with the injected isopropanol probe.
Keywords: Reservoir rocks Surface properties Inverse gas chromatography Surface heterogeneity
a b s t r a c t
The description of the surface chemistry of reservoir rock is essential in understanding the physico-chemical interaction between the rock surface and its environment. In this study, inverse gas chromatography (IGC) is used to characterize the surface chemistry of rocks extracted from four petroleum reservoirs in Algeria. By means of IGC at infinite dilution (IGC-ID), the dispersive compo-nent of the surface energy (! sˆd), the nanomorphological index I M (" t) and the specific compocompo-nent of the surface energy were determined at 100◦C. IGC at finite concentration (IGC-FC) was
imple-mented using n-octane and isopropanol probes, allowing the irreversibility indexes and the adsorption isotherms to be obtained. From the latter, the BET specific surface area and BET constant of the injected probes were determined. Energy distribution functions and indexes of heterogeneity were also com-puted for the n-octane and isopropanol probes. The results showed that the polar probe, isopropanol, interacts more strongly with the rock surface than the apolar probe. In the second part of this study, the influence of a surfactant used in drilling mud on the heterogeneity of the surface energy was
∗ Corresponding author.
investigated. Different surfactant impregnation ratios were examined by means of IGC-FC. The results indicated that the progressive covering of the solid surface by the surfactant hid chemical functions likely to interact with the injected probes and made the surface smooth by covering the roughness of the surface, which led to the decrease in all parameters obtained by IGC-CF.
1. Introduction
Oil recovery is strongly dependent on the oil wettability of an oil-field reservoir. Wettability describes the tendency of fluid to adhere to a solid surface in the presence of another immiscible fluid[1]. For reservoir rock-fluid systems, it is the measure of the affinity that the rock has for either oil or water. Cuiec[2]proved the exis-tence of water-wet, mixed-wet or oil-wet rocks. The wettability of the reservoir rock may change due to the interactions of drilling mud with reservoir rocks. A change in wettability from water-wet to oil-wet conditions is accompanied by a decrease in the relative permeability to oil and a corresponding increase in the water/oil production ratio[3–5].
The wettability properties of reservoir rocks are related to their surface energies and surface heterogeneities. Thus, an accurate description of the surface chemistry of the reservoir rock is essential to improve understanding of the factors affecting reservoir wetta-bility, and thus accurately predict reservoir performance.
Previous studies have mostly been conducted by means of two commonly-used methods to determine the surface energy of a solid: wetting (contact angle) measurements by means of liquid probes, and vapor adsorption measurements (IGC) using vapor probes. Contact angle measurement is one of the most widely-used methods for determining the surface energy of solids. However, the results obtained with this method provide only a macroscopic aver-age of the surface energy of the studied solid and the measurements are difficult to implement on powders due to their surface rough-ness, porosity and irregular shapes. The limitations of the various methods for measuring contact angles for powders are discussed in a review by Buckton[6].
Vapor adsorption measurements using IGC-ID are not affected by these surface roughness problems and they provide microscopic variations of the surface properties. This method makes it possi-ble to study the interactions of a probe molecule with the surface adsorption sites. Recently, Arsalan and Palayangoda [7,8], suc-cessfully quantified the fundamental interactions of the reservoir rock-fluid system by characterizing the surface energy of sandstone and carbonate rocks using IGC-ID.
Despite its huge potential, IGC-ID has its drawbacks when used on heterogeneous surfaces, where only high-energy sites are con-sidered under these conditions. In other words, IGC-ID delivers absolute thermodynamic parameters only on a perfectly homo-geneous surface, i.e. a surface for which the interaction potential remains constant from one adsorption site to another. No real solid can be considered as truly homogeneous and the presence of sites having different interaction potentials will influence the behavior of the injected probe, and thus the properties measured by IGC-ID
[9].
It is therefore of great interest to have a method to estimate the degree of heterogeneity of the solid surface. For this reason, IGC-FC was performed in this work after a standard study of the rocks by IGC-ID.
When the concentration of the injected probes is increased, a growing number of less active sites become involved in the interaction with the probe molecules. In this case IGC-FC allows the determination of desorption isotherms and is a suitable
method for evaluating the heterogeneity of the surface energy of powders.
To the best of our knowledge, no practical experimental study has been carried out to characterize the surface heterogeneity of natural reservoir rocks at the molecular level. The present paper is an attempt to contribute to this goal.
2. Theory of inverse gas chromatography
IGC is a well-suited method for exploring the chemical surface properties of non-volatile materials at the molecular scale. It is receiving more attention as it offers several advantages, such as ease and rapidity of measurement, the possibility of using a variety of probes and a large range of temperatures.
The outcome of an IGC measurement is the retention time of the injected probe tr. This value reflects the intensity of interactions between the solid surface and the probe.
The retention volume, namely the volume of the carrier gas required to sweep out an injected probe from the column is related to the retention time by Eq.(1):
Vn= (tr− t0) × Dc (1)
where tris the retention time of the probe, t0 the retention time measured with a non-retained probe (methane) and Dcis the cor-rected flow rate, which is related to Dm, the flow rate measured with the flow meter, according to Eq.(2):
Dc= Dm× j ×
!
Tc273, 15
"
(2) where Tcis the oven temperature, and j the James Martin coefficient for taking into account the compressibility of the carrier gas under the effect of the pressure drop !P, as shown in Eq.(3):
j =32
#
1 + "P Patm$
2 − 1#
1 + "P Patm$
3 − 1 (3) Depending on the amount of probe molecules injected into the column, two IGC techniques may be distinguished, at infinite dilu-tion (IGC-ID) and at finite concentradilu-tion (IGC-FC).2.1. Inverse gas chromatography at infinite dilution (IGC-ID) At infinite dilution conditions, a very small quantity of probe molecules (vapor) are injected in the column at the limit of detec-tor sensitivity, in such a way that the interaction between probe molecules will be negligible and only the solid surface-probe molecule interactions are favored. Under these conditions, Henry’s law can be applied and the retention volume is directly related to the free energy of adsorption[10]according to Eq.(4):
− "Ga0= RTLn (Vn) + K (4)
where R is the ideal gas constant, T the temperature, Vnthe net retention volume and K a constant that depends on the choice of a reference state of the adsorbed probe and also on the total area of the solid accessible to the probe.
0 1 2 3 4 5 6 3 3.5 4 4.5 5 5.5 6 6.5 Alkanes line Polar probe ISP=ΔGaSP ΔGad -RTLn (Vn)(kJ/mol) Topological index Cyclic probe δΔGaM ΔGapolar probe ΔGaCH2
Fig. 1. Experimental measurements of the free energy of adsorption for different probes. One column.
From the free energy of adsorption and depending on the chem-ical nature of the injected probe molecule, IGC-ID provides access to many parameters:
2.1.1. The dispersive component of the surface energy
This parameter expresses the ability of the solid surface to estab-lish non-specific interaction with probe molecules. It is calculated according to the Dorris and Gray approach[11], by injecting lin-ear alkanes. The slope of the straight line obtained when plotting RTLn(Vn) versus the number of carbon atoms of the alkane probes, "GCH2
a , gives access to #Sdby applying Eq.(5):
#d s = 1 4#CH2
%
"GCH2 a NaCH2&
2 (5) where N is Avogadro’s number, aCH2 the surface area of amethy-lene group (0.06 nm2), #
CH2the surface energy of a solid made up
entirely of methylene groups (i.e. polyethylene),
#CH2 = 35, 6 + 0, 058 (293 − T) in mJ/m2, with T being the oven
temperature.
2.1.2. The nanomorphological index IM($t)
This value delivers information about the regularity of the solid surface at the scale of the injected probe. The accessibility to the sur-face of a solid depends strongly on the probe encumbrances (cyclic and branched probe) and the surface morphology of the studied solid. This effect of the surface morphology can be quantified with the nanomorphological index, by comparison with the adsorption behavior of linear and non-linear alkanes. The nanomorphological index[9]is obtained according to Eq.(6)and illustrated inFig. 1: IM($t) = exp − ı"G M a RT
'
(6) where − #"GMa is the variation between the representative point of the branched or cyclic alkane and the reference n-alkane straight line, and "t the topology index proposed by Brendlé and Papirer[12]and derived from Wiener’s topology indices.
When IM("t) is equal to 1, the solid surface can be considered as flat at the molecular scale. Under these conditions, the bulky (branched or cyclic) alkanes and the linear alkanes have access to the same surface.
When the surface roughness increases,IM("t) decreases and its value can reach 0.1, as in the case of talc[13]. Access to the rough parts of the surface is more limited for cyclic (or branched) alkane molecules than for linear ones due to steric hindrance.
0 2000 4000 6000 8000
Signal
time (s) IGC-CF chromatogram
peak of thermodesorption
Fig. 2. Experimental chromatogram and the associated peak of thermodesorption acquired for the n-octane probe on the reservoir rock. One column.
2.1.3. The specific component of the surface energy (ISP)
The term ‘specific’ includes all type of interactions, i.e. polar, hydrogen bonding, and metallic or magnetic interactions, except the dispersive ones, which are obtained by injecting polar probes
[9]. The difference between the global free energy of the injected polar probe and the straight line of linear alkane probes represents the contribution of specific interactions "Gsp
a also notedIsp(Fig. 1):
"Ga= "Gspa + "Gda (7)
The principal advantages and limitations of IGC-ID have been summarized in a review by Balard et al.[9].
2.2. Inverse gas chromatography at finite concentration (IGC-FC) In the case of an IGC-FC approach, a liquid probe is injected instead of vapor, which leads to the formation of a probe monolayer on the solid surface. Then a strong asymmetric chromatographic peak is obtained when ideal, non linear conditions are fully fulfilled. 2.2.1. Isotherm of adsorption
By applying the elution characteristic point method (ECP) to the reversible isothermal part of the experimental chromatogram, IGC-FC allows access to the desorption isotherm[14]. The first derivative of this isotherm is directly related to the net retention time of each point of the diffuse front of the chromatogram through Eq.(8):
∂
N∂
P'
L,tr
= DC(tmRTr− t0) (8)
where for a given characteristic point of the diffuse front of the chromatogram, N is the number of adsorbed probe molecules, P the partial pressure of the probe at the output of the column, directly related to the height of the signal, trthe retention time and t0the retention time of a molecule that is not retained by the solid surface (methane), Dc the corrected flow rate, m the masse of the solid contained in the column, L the column length.
The integration of the above equation gives access to the des-orption isotherm, from which several items of information can be deduced, such as the specific surface area aBET, the BET constant and Henry’s constant.
2.2.2. Irreversibility index
Due to the presence of very high-energy adsorption sites, a non-negligible part of the injected probe is not necessarily eluted in time for the return of the signal to the base line. In order to assess this irreversibly-adsorbed amount, the temperature of the chromato-graph oven is increased to the conditioning temperature, leading to the appearance of a small secondary peak on the right side of IGC-FC chromatogram (Fig. 2).
The irreversible part of the adsorption phenomenon can be accessed from the ratio of the area of the thermodesorption peak to the total area of the chromatogram, and defined as an irreversibility index (Iirr)[15]according to Eq.(9):
Iirr= Sth
Srv+ Sth (9)
where Srvis the area of the main chromatographic peak and Sththe area corresponding to the thermodesorption peak.
Moreover, it is obvious that the shape of the desorption isotherm is influenced by the surface heterogeneity. Molecules retained on the sites having the highest energy will remain for a longer time in the chromatographic column than those adsorbed on the sites of lower energy. Hence, the shape analysis of the isotherm will deter-mine the distribution function of the adsorption energies of the probe.
2.2.3. Distribution function of the adsorption energies (DF) and heterogeneity index
The surface heterogeneity is described by a distribution func-tion (DF) corresponding to the relative abundance of each type of domain having the same characteristic energy of interaction. The calculation of the DF is based on a physical adsorption model which admits that the global isotherm may be considered as a sum of local isotherms of adsorption on isoenergetic domains (patchwork model)[16–18].
The physical adsorption on heterogeneous solid surfaces was described by the following integral form Eq.(10):
N(Pm, Tm) = N0 ε
(
maxεmin
'(ε, Pm, Tm) $ (ε) dε (10)
where N (Pm, Tm) is the number of molecules adsorbed at the pres-sure Pmand temperature Tmof measurement, N0 the number of molecules needed for the formation of a monolayer, ' (ε, Pm, Tm) the local isotherm (generally Langmuir’s isotherm) corresponding to adsorption sites having the same characteristic adsorption ε, and $(ε) the distribution function (DF) of the sites seen by the probe. The range of adsorption energies is calculated between minimal (εmin) and maximal (εmax) values.
The characteristic energy (ε) is related to the pressure of mea-surement by Eq.(11):
ε = − RTLn
#
P/K$
WithK = C10√MT (11)where M is the probe molecular weight and C a constant depending on the pressure unit:
C = 2.346 × 10³when the pressure is expressed in kPa. The integral equation above is not a trivial task because it has no general solution, except when admitting a step function as a local isotherm known as the condensation approximation. The distribu-tion funcdistribu-tion for the condensadistribu-tion approximadistribu-tion (DFCA) is then directly related to the first derivation of the isotherm, according to Eq.(12):
$CA(ε) =RTP′ dPd′
)
N′N(P′)0 (12)
where N′and P′are respectively the amount of adsorbed probe and the equilibrium pressure of the probe corrected for the multilayer adsorption[19].
This approximation is acceptable only for a measurement tem-perature approaching absolute zero. In the usual IGC measurement conditions, at room temperature and above room temperature, this approximation is no longer valid, and it becomes necessary to use other approximated forms of the local isotherm. Among them, for Langmuir’s local isotherms, the extended[17]method allows the computation of the actual distribution function (DFRJ) through a
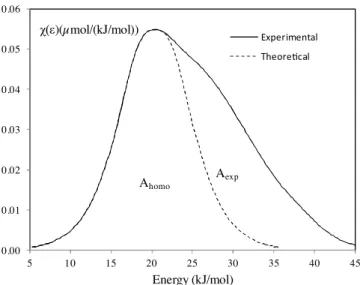
0.00 0.01 0.02 0.03 0.04 0.05 0.06 5 10 15 20 25 30 35 40 45 Energy (kJ/mol) Experimental Theore!cal χ(ε)(µmol/(kJ/mol)) Ahomo Aexp
Fig. 3. Determination of heterogeneity index from DFCA. One column.
limited development of the even derivatives of the DFCA, according to Eq.(13): $(ε) = +∞
*
j=0 (RT)2jb2j$2jCA(ε) withb0= 1 andb2j= (− 1) j (2j (2j + 1)! (13) On the other hand, by comparing the computed DF with the DF corresponding to a homogeneous surface that fit the left descend-ing branch of the experimental DF, towards the lower interaction energies (Fig. 3), an index of surface heterogeneity Ihete[15]can be found, by using Eq.(14):Ihete= 100
Aexp− Ahomo
Aexp (14)
where Aexpis the area under the experimental DF and Ahomothat of the homogeneous DF.
This index is used to compare the surface heterogeneity of the studied solids.
For IGC-FC measurements, all the calculations were performed using special software from the ADSCIENTIS company (Wit-telsheim, France).
3. Materials and methods 3.1. Reservoir rocks
In this study, four rocks were collected from four different reser-voirs located in the Hassi Messaoud site in south-eastern Algeria and noted OKJ21, OMO62, OKN54 and OKN46.
To remove all liquid from the contaminated core and restore the natural state of the reservoir, the rocks were cleaned of all drilling mud using a distillation/extraction method (Dean-Stark and Soxh-let). Each sample was placed in a Soxhlet or Dean-Stark apparatus and cleaned with refluxing solvent (toluene). In the Dean-Stark apparatus, the toluene is continuously distilled, condensed and then distributed over the top of the sample. In the Soxhlet appara-tus, the sample is soaked in the hot solvent, which is periodically siphoned off, then distilled, condensed and distributed back to the extractor[20].
The cleaned reservoir rocks were ground using a mortar and pestle and were subsequently sieved to obtain a size fraction less than 100 $m.
Table 1
The characteristics of the surfactant.
Product Supplier Recommended use
Classe % (g/cm3)
VERSAMUL MISwaco/ Shlumberger OBMaemulsify Cationic 71% 0.928 aOil Based Mud.
3.2. Impregnation protocol
The surfactant used for the preparation of the impregnated rock samples was selected because of its use on drilling mud. Some properties of this surfactant are listed inTable 1. For reasons of con-fidentiality, no further information was supplied by the petroleum company.
The mass of reservoir rock required to fill the chromatographic column was put in a beaker and mixed with a given mass of sur-factant in 20 mL of carbon tetrachloride, used as a solvent, until the mixture became homogeneous (∼5 h). After the evaporation of the solvent in an oven at 333 K, the column was filled with the reservoir rock impregnated with the surfactant.
Depending on the mass of the surfactant, a wide range of impregnation ratios ()), expressed in% and calculated by Eq.(15), were examined:
)(%) =mms
r× 100 (15)
where msand mrwere the mass of the surfactant and the mass of the reservoir rock respectively.
3.3. Characterization methods
Phase identification was performed on a Panalytical X’PERT-Pro diffractometer (Philips) with an X-ray copper anticathode tube (&= 1.5418). Diffraction data were acquired by exposing the pow-der samples to Cu-K' radiation at a voltage of 45 kV and to a current of 40 mA. The data were collected over a range of 8◦to 90◦with a step size of 0.0167◦. Data analyses were performed with the X’Pert Data Collector software and phase identification was carried out by means of PANALYTICAL High Score Plus software in conjunction with the ICDD Powder Diffraction File 2 database and the Crystal-lography Open Database.
The elementary analyses were obtained using a PANALYTICAL EPSILON 3XL X-Ray Fluorescence Spectrometer with RX: 50 kV gen-erator power.
Particle morphology was investigated using a scanning electron microscope (SEM) (Philips XL 30 model ESEM-FEG) operating at 10 kV.
Thermogravimetric analysis (TGA) coupled with differential calorimetric scanning analysis (DSC) provided information about the mass changes of the sample according to heating rate. In this study the device used was a ATG-DSC 111 SETARAM. Thermal anal-ysis was performed with a temperature rise of 283 K/min from 293 K to 473 K under nitrogen flow of about 50 mL/min.
The specific surface areas and BET constants were determined with an ASAP 2010 Micromeritics Analyser, and evaluated using the Brunauer-Emmet-Teller (BET) equation. Prior to measurements, the samples were degassed by heating to 383 K in a vacuum for 24 h at a pressure of 10− 2mbar. The analyses were carried out with krypton at a temperature of 77 K (liquid nitrogen temperature).
IGC measurements were performed using an Agilent 7890 appa-ratus, fitted with sensitive flame ionization detectors (FID). Helium was used as the carrier gas with a flow rate of about 30 mL/min measured with an electronic flow meter (flow 500-Agilent). The temperature of the injector and the detector were respectively 403 and 473 K. Stainless steel columns with an internal diameter of 6.35 mm and a length varying between 10 and 20 cm were filled
Table 2
Atomic composition of studied reservoir rocks.
Chemical composition (%)
Element OMO62 OKJ21 OKN46 OKN54
Si 94.11 91.46 96.29 94.27 Al 2.33 2.52 0.33 0.85 K – 4.17 0.17 0.33 Ca 0.77 0.75 0.44 1.14 Fe 0.27 0.72 0.30 0.70 Na 0.26 – 0.20 –
with a mixture of the reservoir rock and glass beads (90 $m median diameter). The interest of glass beads was to reduce the mass of reservoir rocks and so the pressure drop through the column in order to avoid fitting leaks. The powder mass range in the column was generally between 1 and 2 g. The column was then closed with a bit of glass wool at both ends. The columns were then conditioned at 443 K overnight in the oven chromatograph. Net retention times were calculated by subtracting the retention time of a non-retained molecule (Methane) from the retention time of the probe.
The IGC-ID study was performed with an oven temperature of 373 K. The probes used were linear alkanes (n-hexane C6, n-heptane C7, n-octane C8, n-nonane C9), a branched alkane (2,5-dimethylhexane 2,5-DMH), a cyclic alkane (Cycloheptane Cycl7) and a polar probe (Dichloromethane CH2Cl2). These probes were of
chromatographic grade purity (>99%).
The IGC-FC measurements were performed with an oven tem-perature of 313 K. Two probes were examined in IGC-FC, an apolar probe, n-octane (C8), to study the surface morphology, and a polar probe, isopropanol (IP), to study the surface chemistry. These probes were of chromatographic grade purity (>99%).
4. Results and discussion
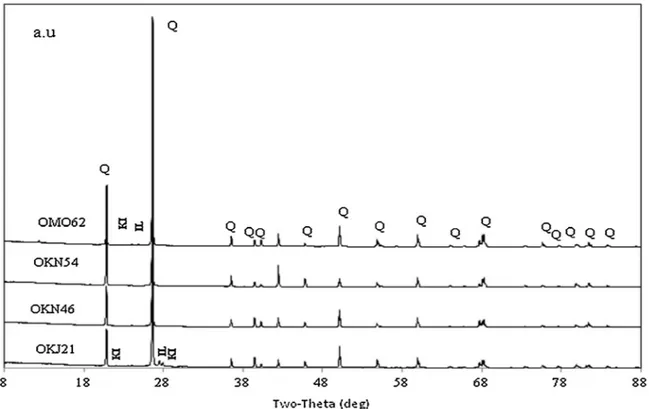
4.1. Mineralogical analysis by X-ray diffraction The diffraction patterns are illustrated inFig. 4.
There was no significant difference in the mineral composition of the four samples. They all contained predominantly Quartz. Apart from quartz, in the OKJ21 and OMO62 samples, the presence of different clay components such as kaolinite and illite was observed but at a very low percentage. Thus it was concluded that the studied rocks were quartz with a high purity.
4.2. Chemical composition analysis by elemental analysis
The results of X-ray Fluorescence (XRF) analyses of the studied rocks are summarized inTable 2.
The chemical composition analyses reveal a significant presence of silicon in all samples. The XRF results correlate to a very large extent with the results obtained with XRD, in particular with regard to the dominance of the silicon species in all samples. The presence of other elements was also noted, such as aluminum, iron, calcium and potassium, but at very small percentages.
4.3. Morphological analysis by SEM
Observation by SEM (Fig. 5) revealed that the studied rocks showed similar surfaces, composed of small particles that get stuck on the surface of larger ones.
4.4. BET surface analysis
Because of the low specific surface areas of the samples, the adsorbed gas selected was krypton at liquid nitrogen temperature
Fig. 4. X-ray diffraction patterns of the studied rocks showing the identified minerals (Q: Quartz, KI: Kaolinite, IL: Illite). One column.
Fig. 5. SEM micrographs of the studied rocks. two columns.
(77 K). The molecular size of krypton, 0.152 nm2, and its low satu-ration pressure at liquid nitrogen temperature make it possible to obtain high accuracy on the small adsorbed volume. In other words, Krypton is the suitable gas for the measurement of low specific
surface areas[21]. The values of specific surface area (aBET), and BET constant (CBET), obtained by exploiting the adsorption isotherms of Kr at 77 K are produced inTable 3.
The results obtained using gas adsorption manometry indi-cate that the specific surface areas were very low for all samples
Table 3
Values of specific surface areas and BET constants obtained by the adsorption of Krypton at 77 K.
Reservoir rock aKrm2/g CBET
OKN54 0.65 25.8 OMO62 0.46 18.6 OKN46 0.44 28.6 OKJ21 0.36 41.6 Table 4 Values of #d
s, IM($t), and Ispof the studied rocks determined at 373 K.
Reservoir rocks #d s(mJ/m2) ± 5 IM($t) ± 0.1 Isp(kJ/mol) ± 1.6 2,5-DMH Cycl7 CH2Cl2 OKN46 137 0.1 0.2 11.6 OKJ21 89 0.5 0.6 10.0 OMO62 80 0.4 0.6 11.0 OKN54 56 0.5 0.8 9.6
(<1 m2/g). Similar results were obtained by Arsalan on sandstone
originating from Ottawa, Canada, and on Berea sandstone from Oberlin Ohio[7], indicating surface areas varying between 0.2 and 4 m2/g.
4.5. Characterization of samples by IGC
4.5.1. Inverse gas chromatography at infinite dilution (IGC-ID) Parameters such as the dispersive component of the surface energy, #d
s, the nanomorphological index, IM($t), and the specific component of the surface energy, Ispobtained by IGC-ID at 373 K on the studied rocks samples are presented inTable 4.
The values of #d
s obtained with the rocks OKJ21 and OMO62 are close, testifying to similar surface properties. These values are in agreement with those obtained in the literature, for instance, on sandstone originating from Ottawa, (approximately 85 mJ/m2, at 353 K), and Berea sandstone originating from Oberlin, Ohio (approximately 60 mJ/m2, at 353 K) [7]. The lowest #d
s value is obtained with the OKN54 rock. The OKN46 sample stands out from the other rocks, since it gives a high value of #d
s(137 mJ/m2) reflect-ing a greater affinity of alkane probes for this rock surface. On the other hand, the dispersive component of the surface energy mea-sured for various silica surfaces in the literature varies from 30 to 156 mJ/m2[22].
This difference in #d
s values observed on the studied sam-ples can be explained by the surface morphology. To obtain more information about this morphology at the molecular scale, the nanomorphological indexes obtained with cycloheptane (Cycl7) and 2,5-dimethylhexane (2,5-DMH) probes were determined at 373 K (Table 4).
The lower nanomorphological index values obtained with the branched probe, the 2,5-DMH, reflect accessibility to a more limited surface roughness with this probe compared to those obtained with the cyclic one (Cycl7), indicating that the branched probe seems to be more sensitive to the surface morphology of the studied rocks.
The lowest IM($t) values are obtained with OKN46, which exhibits the highest value of #d
s, indicating a high surface rough-ness for this rock. On the contrary, the highest IM($t)and lowest #d
s values obtained with the OKN54 rock, indicate a flatter surface compared to the other rocks. The OKJ21 and OMO62 rocks exhibit almost the same values of IM($t), indicating similar morphologies. By injecting acidic probes, such as dichloromethane, the specific interaction parameter, Isp, was also determined (Table 4). It can be noted that all the samples show almost the same behavior towards the polar probe. However, the measured values of Ispof the studied samples are higher than those determined, for instance, for amor-phous and crystalline silica[23], testifying to the strongly acidic
Table 5
Values of specific surface areas and BET constants obtained on the studied rocks by krypton adsorption and IGC-FC with n-octane and isopropanol probes.
Kr n-Octane Isopropanol Rocks aKr(m2/g) CKr aC8(m2/g) ± 0.3 CC8± 0.5 aIP(m2/g) ± 0.3 CIP± 5.8 OKJ21 0.36 41.6 3.4 9.0 2.3 11.8 OKN46 0.44 28.6 1.2 11.2 0.6 14.0 OMO62 0.46 18.6 0.8 10.0 0.6 13.8 OKN54 0.65 25.8 1.8 7.0 1.2 8.8 Table 6
Values of irreversibility indexes (Iirr) measured at 313 K using n-octane and
iso-propanol probes on the studied rocks.
Reservoir rock IirrC8 (%) ± 0.7 IirrIP (%) ± 0.8
OKJ21 3.7 11.8
OKN46 5.3 7.6
OMO62 3.2 11.0
OKN54 1.1 6.5
character of the studied rocks. This character may results from the higher density of the superficial hydroxyl groups.
When IGC-ID was applied, among the four samples, OKN46 exhibited the highest surface energy, reflecting a high surface roughness. The lowest surface energy was obtained with the OKN54 rock. However, the IGC parameters are clearly related to the adsorp-tion sites having the greatest energy of interacadsorp-tion[9]. To provide more information on the whole surface of the studied rocks, IGC-FC experiments were implemented using octane and isopropanol. 4.5.2. Inverse gas chromatography at finite concentration (IGC-FC)
The studied rocks were submitted to IGC-FC analysis using n-octane, an apolar probe, which is mainly sensitive to the surface morphology, and a polar probe, isopropanol, which is mainly sen-sitive to the surface functionality.
4.5.2.1. Study of desorption isotherms. From the desorption isotherms of the studied rocks, the specific surface areas and the BET constants of n-octane and isopropanol probes were deter-mined. The results are compared with those obtained by krypton at liquid nitrogen temperature, 77 K, inTable 5.
The organic probes lead to specific surface area values higher than those obtained by adsorption of krypton at 77 K. This deviation was already observed in the study of milled graphite by IGC-FC[15], and was attributed to the difference in the occupied area by both n-octane and isopropanol probes adsorbed on the solid surface.
Moreover the specific surface areas obtained using n-octane probes are higher than those obtained with isopropanol. This dif-ference could be explained by the more irreversible character of isopropanol adsorption compared to that obtained with n-octane, as testified by their respective irreversibility indexes (Iirr), reported inTable 6.
The values of the irreversibility index of the polar probe obtained for the studied rocks are higher than those obtained using n-octane, reflecting a higher irreversible adsorption of the isopropanol probe compared to the n-octane probe. It should be remembered that the amount of the probe adsorbed irreversibly on the surface of the solid is not taken into account for the calculation of the spe-cific surface area, and contributes to its decrease. This can actually be the reason why the specific surface values measured using an isopropanol probe are lower compared to those obtained with the n-octane probe.
Moreover, it is observed that the irreversibility index Iirr obtained with n-octane on the studied rocks follows the same trend as the #d
Table 7
Value of heterogeneity index measured by IGC-FC for n-octane probe on the studied rocks.
Reservoir rock Ihete(C8) % ± 2.6
OKN46 33.1
OKJ21 28.1
OMO62 28.4
OKN54 12.8
obtained with the OKN46 rock and the lowest ones with the OKN54 rock.
Even if the two parameters are not obtained from the same injection conditions, the first, #d
s, being obtained under IGC-ID
con-ditions and the second under IGC-FC concon-ditions, both reflect the interactions between the injected probes and the high energy sites. This may be the origin of the good correlation obtained between these two parameters.
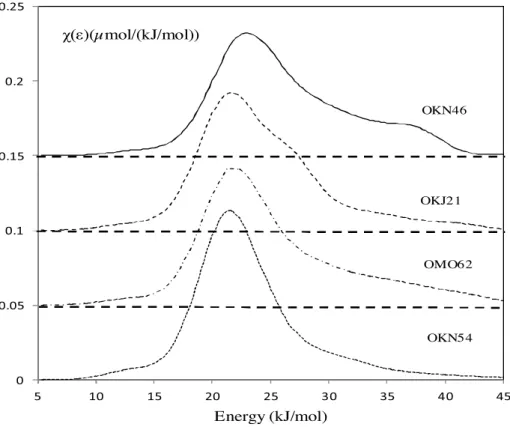
4.5.2.2. Characterization of surface heterogeneity.Using the distri-bution function of the adsorption energies (DF) is a good way to reveal the heterogeneity of the surface of the studied rocks. It was first evaluated with a non polar probe, n-octane (Fig. 6), which exchanges only dispersive interactions with the surface of the stud-ied rocks.
The DFs obtained with n-octane are essentially monomodal and asymmetrical. A maximum is observed at about 22 kJ/mol.
The DF obtained with the OKN46 sample shows a shoulder extending towards the high energies which can be explained by the higher surface heterogeneity of this rock compared to the other samples. The most symmetrical DF is given by the OKN54 rock, testifying to the more homogeneous surface of this rock.
The surface heterogeneity can be quantified with the hetero-geneity index (Ihete) obtained from the asymmetrical part of the distribution function and given by Eq.(14). The values were deter-mined for n-octane (Table 7). As expected, the highest value of
Table 8
Values of heterogeneity indexes measured by IGC-CF for isopropanol probe on the studied rocks.
Reservoir rocks Ihete(IP) % ± 2.8
OKN46 42.0
OKJ21 41.4
OMO62 36.8
OKN54 33.6
the Ihete (33%) was obtained with the OKN46 rock, indicating a
more heterogeneous surface than the others from the morpholog-ical point of view. Slightly lower values were obtained with OKJ21 and OMO62. The OKN54 sample exhibited a more homogeneous surface with a Iheteclose to 13%.
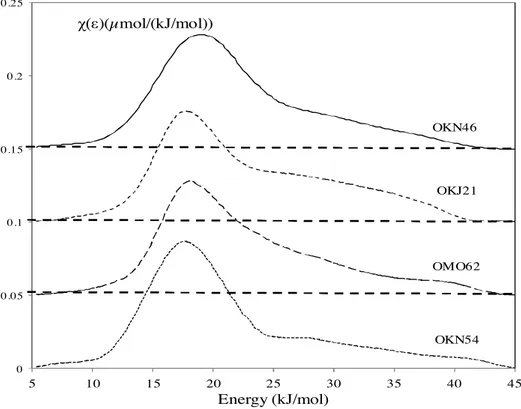
On the other hand, by its ability to exchange strong interac-tions through hydrogen bonding, the isopropanol probe is sensitive to the surface functionality. The DFs obtained with isopropanol (Fig. 7) are all monomodal and highly asymmetrical. They exhibit a main component centered on 18 kJ/mol, while the maximum for the OKN46 rock is situated at a higher value of about 20 kJ/mol. Moreover these DFs exhibit a shoulder towards the high energies up to 45 kJ/mol. A similar DF was also obtained in an Algerian Atta-pulgite[24]. The first peak can be attributed to the siloxane sites and the shoulder towards high energy to other functions, among them silanol groups.
The heterogeneity index values of the isopropanol probe calcu-lated from the obtained DFs, according to Eq.(14), are presented in
Table 8.
For all the studied samples, the Ihetevalues are higher than 30%. Once again, the OKN46 rock exhibits one of the highest Ihetevalues, 42.0%, compared to 33.6% obtained with the OKN54 rock.
The heterogeneity index (Ihete) of isopropanol is much greater than that of n-octane for all samples, because the former interacts more strongly with the surface functional groups through hydrogen bonds, i.e. with silanol groups, whereas the latter exchanges only
0 0.05 0.1 0.15 0.2 0.25 5 10 15 20 25 30 35 40 45
Energy (kJ/mol)
OKJ21χ(ε
)(µmol/(kJ/mol))
OKN46 OMO62 OKN540 0.05 0.1 0.15 0.2 0.25 5 10 15 20 25 30 35 40 45
Energy (kJ/mol)
χ(ε
)(µmol/(kJ/mol))
OKN46 OKJ21 OMO62 OKN54Fig. 7. Adsorption energy distribution functions of the isopropanol probe measured at 313 K on the studied rocks. One column. Table 9
Values of the specific surface area (aBET), BET constant (CBET), and irreversibility index (Iirr) using n-octane and isopropanol probes on the raw and impregnated rock OKJ21,
obtained by IGC-FC at 313 K.
Impregnation ratio (%) n-Octane Isopropanol
aC8(m2/g) ± 0.1 CC8± 0.1 Iirr± 0.6 aIP(m2/g) ± 0.6 CIP± 0.1 Iirr(%) ± 0.1 0 3.4 9.0 3.7 2.3 21.0 11.8 0.35 1.1 7.7 1.4 0.6 10.5 2.3 0.75 0.9 6.3 0.7 0.4 7.8 1.0 3 1 6.5 0.2 0.7 9.5 0.3 5 0.7 6.8 0.1 0.4 8.7 0.4
non-specific interactions with the surface and is quite insensitive to the surface functionality.
IGC-FC allowed us to gain a close insight into the surface het-erogeneity of the studied rocks at the molecular scale. Between the four samples, OKN54 exhibited the lowest surface heterogeneity, as shown by the lowest values of heterogeneity indexes obtained with n-octane and isopropanol probes, while OKN46 exhibited the highest.
Good correlation was obtained between the IGC-ID and the IGC-FC results, where OKN46 always exhibiting the highest param-eter values, reflecting a more energetic, rough and hparam-eterogeneous surface. The lowest values were obtained with the OKN54 rock, testifying to a less energetic, flatter, and more homogeneous sur-face on this rock. The OKJ21 and OMO62 rocks exhibited almost the same parameters values, testifying to similar surface properties. 4.6. Effect of the surfactant impregnation on the surface
properties
In this part of this study, the influence induced by a surfactant used in drilling mud was studied on the properties determined by IGC-FC using n-octane and isopropanol probes. A drilling mud addi-tive was used to impregnate the surface of the OKJ21 rock. Before filling the chromatographic columns, thermogravimetric analysis was implemented on the impregnated sample to confirm that it
remained stable even at high temperature. The TGA-DSC analysis indicated that the impregnated sample underwent a very weak loss in mass of about 0.4% of the initial mass. This result confirms that the impregnated sample is thermally stable.
4.6.1. Variation of the specific surface area
The isotherms obtained on OKJ21 impregnated with surfactant show a classic type II shape regardless of the impregnation ratio (Fig. 8).
The adsorbed quantities at a given relative equilibrium pressure depend on the impregnation ratio of the surfactant. It decreased from 0% to 5% (Fig. 8).
The variations in specific surface area, the corresponding BET constant, and the irreversibility index as a function of the impreg-nation ratio, are summarized inTable 9.
It can be observed that whatever the probe used, the specific surface area, the BET constant and the irreversibility index follow the same trend, the weakest impregnation ratio (0.35%) is sufficient to reduce these parameters.
The decrease on the specific surface area and BET constant gives evidence to the recovery of the solid surface with the surfac-tant, this latter shields the porosity and consequently the highest energy sites since the first impregnation ratio (0.35%). Above this ratio, the polymer covers the most of the surface, and the two
0 1 2 3 4 5 6 7 0 0.1 0.2 0.3 0.4 0.5 0.6
P/Psat
A
n
ads(mmol/g)
0%
0.35%
0.75%
3%
5%
0 2 4 6 8 10 12 14 16 0 0.05 0.1 0.15 0.2 0.25 0.3 0.35P/Psat
B
n
ads(mmol/g)
0%
0.35%
0.75%
3% 5%
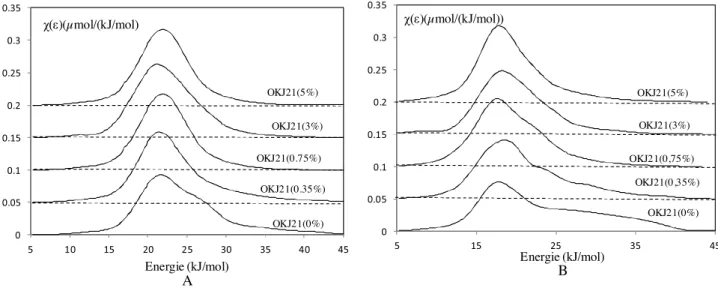
Fig. 8. Plots of the n-octane (A) and isopropanol (B) isotherms obtained on OKJ21 impregnated at different surfactant ratios obtained by IGC-FC at 313 K two columns.
0 0.05 0.1 0.15 0.2 0.25 0.3 0.35 5 10 15 20 25 30 35 40 45 Energie (kJ/mol)
A
χ(ε)(µmol/(kJ/mol) OKJ21(5%) OKJ21(3%) OKJ21(0.75%) OKJ21(0.35%) OKJ21(0%) 0 0.05 0.1 0.15 0.2 0.25 0.3 0.35 5 15 25 35 45 Energie (kJ/mol)B
OKJ21(5%) OKJ21(3%) OKJ21(0,75%) OKJ21(0,35%) OKJ21(0%) χ(ε)(µmol/(kJ/mol))Fig. 9. Distribution functions of the adsorption energies of n-octane (A) and isopropanol (B) probes measured on the raw and impregnated OKJ21 rock. two columns.
parameters obtained with the injected probes remain almost stable and independent of the surfactant coverage rate.
On the other hand, the irreversibility index also decreases with the impregnation ratio, testifying that the injected probes interact less strongly with the impregnated samples than with the raw one.
4.6.2. Variation of the surface heterogeneity
The influence of the surfactant impregnation ratio was also examined on the surface heterogeneity.Fig. 9depicts the variations of the DF of the adsorption energies, for both n-octane (Fig. 9.A) and isopropanol (Fig. 9.B) probes as a function of the impregnation ratio on the OKJ21 rock.
The two probes, n-octane and isopropanol, are sensitive to the surface modification induced by the surfactant impregnation. The progressive disappearance of the shoulder towards high energies can be noted starting from the first impregnation ratio of 0.35%. Above this ratio, the DFs obtained become more symmetrical as the impregnation ratio increases. To support this observation, the variation of the heterogeneity index of n-octane and isopropanol probes was monitored, as a function of the surfactant coverage. The results obtained are illustrated inFig. 10.
0 10 20 30 40 50 0 1 2 3 4 5 6 C8 IP I hete(%) Impregnation ratio (%)
Fig. 10. Variation of heterogeneity index (Ihete) of n-octane (C8) and isopropanol
(IP) obtained by IGC-FC at 313 K as a function of the surfactant impregnation ratio. One column.
As depicted inFig. 10, the values of the heterogeneity index of the injected probes decrease significantly from 28.1% to 11.4% with n-octane, and from 42.0% to 20.1% with isopropanol, at 0.75% of the
impregnation ratio. This decrease in the heterogeneity indexes is consistent with the progressive covering of the solid surface by the surfactant. The hydroxyl chemical functions of the surfactant inter-act with the isopropanol probe, and make the surface smooth and nearly homogeneous by covering the surface roughness. Above this coverage ratio (0.75%), the heterogeneity indexes obtained with the two probes remain stable and independent of the surfactant coverage. This observation may be related to the fact that above an impregnation ratio of 0.75%, the surfactant covers the entire rock surface and the injected probe interacts with the thick film produced, instead of with the rock surface.
5. Conclusion
This work provides a comprehensive study of the surface chem-istry of four Algerian reservoir rocks, using XRD, XRF, adsorption manometry and IGC. The XRD diffractograms confirmed that the reservoir rocks are quartz-based minerals with traces of kaolinite and illite. The XRF results were in good correlation by exhibiting Silicon as the highest chemical element in the studied rocks. The adsorption manometry analyses were performed with krypton as the adsorbed gas, with results indicating that the specific surface areas were very low for all samples, < 1m2/g.
IGC was used to investigate the surface properties of the studied rocks. Using IGC at infinite dilution conditions, among the stud-ied rocks, the highest #d
s value was obtained with the OKN46 rock, indicating a rough, high-energy surface, as shown by the low nanomorphological index values obtained with the cyclic and branched probes. On the other hand, OKN54 exhibited the lowest #d
s value, demonstrating a smooth, low-energy surface, as shown by the higher values of the nanomorphological index obtained with the cyclic and branched probes on this rock surface.
IGC at finite concentration was used in order to obtain a more realistic description of the whole surface. The DFs obtained with n-octane were monomodal and symetrical for two reservoir rocks (OKJ21 and OMO62) and asymetrical for the other ones, while the DFs obtained with the polar probe were highly asymmetrical whetever the solid, exhibiting a large tail towards the high ener-gies up to 45 kJ/mol. Between the four samples, OKN54 exhibited the lowest surface heterogeneity.
The DFs obtained with n-octane were all monomodal and almost symmetrical, while the DFs obtained with the polar probe were asymmetrical, exhibiting a large tail towards the high energies up to 45 kJ/mol. Between the four samples, OKN54 exhibited the lowest surface heterogeneity.
The effect on the surface properties of a surfactant used in drilling mud was further examined by IGC-FC. It was established that the BET surface area, BET constant and the irreversibility index, obtained with n-octane and isopropanol probes, decreased with the increase in the surfactant impregnation ratio, then reached a plateau. The distribution functions of the studied rock also con-firm a decrease in the number of the high energy sites according to the impregnation ratio. The disappearance of the tail towards high energy was noted in the first impregnation ratio, and the DF obtained became more symmetrical with the increase in the sur-factant impregnation ratio.
This study provides evidence that IGC is a powerful method for obtaining a more realistic description of the surface characteristics of a solid, in particular in studying of the influence of a treat-ment (e.g. a polymer impregnation) on the physicochemical surface properties of a solid. However care should be taken in interpreting
the results with regard to the influence of the surfactant on the wet-tability of the reservoir rock, owing to the fact that reservoir fluids are usually a mixture of crude oil and brine. Much further work is required to fully utilize the potential of inverse gas chromatogra-phy in the study of the effect of drilling mud on the wettability of reservoir rocks.
Acknowledgment
The authors gratefully acknowledge the contribution of the petroleum company, CRD-SONATRACH, Algeria, for providing the drilling mud additives and the reservoir rocks.
References
[1]M. Crocker, L. Marchin, Wettability and adsorption characteristics of crude-oil asphaltene and polar fractions, J. Petrol. Technol. 40 (1988) 470–474.
[2]L. Cuiec, Mouillabilité et réservoirs pétroliers, Oil Gas Sci. Technol. 41 (1986) 487–509.
[3]M. Sharma, R. Wunderlich, The alteration of rock properties due to interactions with drilling-fluid components, J. Petrol. Sci. Eng. 1 (1987) 127–143.
[4]L. Skalli, J. Buckley, Y. Zhang, N. Morrow, Surface and core wetting effects of surfactants in oil-based drilling fluids, J. Petrol. Sci. Eng. 52 (2006) 253–260.
[5]J. Yan, M. Sharma, Wettability alteration and restoration for cores contaminated with oil-based muds, J. Petrol. Sci. Eng. 2 (1989) 63–76.
[6]G. Buckton, Contact angle, adsorption and wettability—a review with respect to powders, Powder Technol. 61 (1990) 237–249.
[7]N. Arsalan, S.S. Palayangoda, D.J. Burnett, J.J. Buiting, Q.P. Nguyen, Surface energy characterization of sandstone rocks, J. Phys. Chem. Solids 74 (2013) 1069–1077.
[8]N. Arsalan, S.S. Palayangoda, D.J. Burnett, J.J. Buiting, Q.P. Nguyen, Surface energy characterization of carbonate rocks, Colloids Surf. A: Physicochem. Eng. Asp. 436 (2013) 139–147.
[9]H. Balard, E. Brendlé, E. Papirer, Determination of the acid—base properties of solid surfaces using inverse gas chromatography: advantages and limitations, Acid-Base Interact.: Relevance Adhes. Sci. Technol. 2 (2000) 299–316.
[10] D. Lloyd, T.C. Ward, Inverse Gas Chromatography Characterization Of Polymers And Other Materials (Acs Symposium Series) Author: DR Lloyd Th 1989.
[11]G.M. Dorris, D.G. Gray, Adsorption, spreading pressure, and London force interactions of hydrocarbons on cellulose and wood fiber surfaces, J. Colloid Interface Sci. 71 (1979) 93–106.
[12]E. Brendlé, E. Papirer, A new topological index for molecular probes used in inverse gas chromatography for the surface nanorugosity evaluation, J. Colloid Interface Sci. 194 (1997) 207–216.
[13]M.-P. Comard, R. Calvet, J.A. Dodds, H. Balard, Coupling of inverse gas chromatography at infinite dilution (IGC-ID) with a controlled modification of a solid surface, J. Chromatogr. A 969 (2002) 93–96.
[14]J.R. Conder, C.L. Young, Physicochemical Measurement by Gas Chromatography, Wiley, New York, 1979.
[15]H. Balard, D. Maafa, A. Santini, J. Donnet, Study by inverse gas
chromatography of the surface properties of milled graphites, J. Chromatogr. A 1198 (2008) 173–180.
[16]W. Rudzinski, D.H. Everett, Adsorption of Gases on Heterogeneous Surfaces, Academic Press, 2012.
[17]W. Rudzi ´nski, J. Jagiełło, Y. Grillet, Physical adsorption of gases on heterogeneous solid surfaces: evaluation of the adsorption energy distribution from adsorption isotherms and heats of adsorption, J. Colloid Interface Sci. 87 (1982) 478–491.
[18]H. Balard, Estimation of the surface energetic heterogeneity of a solid by inverse gas chromatography, Langmuir 13 (1997) 1260–1269.
[19] P.F.U. MESSEN, Carbon Black using Inverse Gas Chromatography Techniques. [20]P.L. Gant, W.G. Anderson, Core cleaning for restoration of native wettability,
SPE Formation Eval. 3 (1988) 131–138.
[21]I.M. Ismail, Adsorption of nitrogen and krypton at 77 K on silicas and graphitized carbons, Carbon 28 (1990) 423–434.
[22]E. Papirer, Adsorption on Silica Surfaces, CRC Press, 2000.
[23]H. Hadjar, H. Balard, E. Papirer, An inverse gas chromatography study of crystalline and amorphous silicas, Colloids Surf. A: Physicochem. Eng. Asp. 99 (1995) 45–51.
[24]L. Boudriche, R. Calvet, B. Hamdi, H. Balard, Effect of acid treatment on surface properties evolution of attapulgite clay: an application of inverse gas chromatography, Colloids Surf. A: Physicochem. Eng. Asp. 392 (2011) 45–54.