HAL Id: hal-03126983
https://hal-amu.archives-ouvertes.fr/hal-03126983
Submitted on 1 Feb 2021
HAL is a multi-disciplinary open access
archive for the deposit and dissemination of
sci-entific research documents, whether they are
pub-lished or not. The documents may come from
teaching and research institutions in France or
abroad, or from public or private research centers.
L’archive ouverte pluridisciplinaire HAL, est
destinée au dépôt et à la diffusion de documents
scientifiques de niveau recherche, publiés ou non,
émanant des établissements d’enseignement et de
recherche français ou étrangers, des laboratoires
publics ou privés.
Distributed under a Creative Commons Attribution| 4.0 International License
Reproducibility in speech rate convergence experiments
Simone Fuscone, Benoit Favre, Laurent Prevot
To cite this version:
Simone Fuscone, Benoit Favre, Laurent Prevot. Reproducibility in speech rate convergence
exper-iments. Language Resources and Evaluation, Springer Verlag, 2021, �10.1007/s10579-021-09528-6�.
�hal-03126983�
(will be inserted by the editor)
Reproducibility in Speech Rate Convergence
Experiments
Simone Fuscone1,2 · Benoit Favre2 · Laurent
Pr´evot1,3
Received: date / Accepted: date
Abstract The reproducibility of scientific studies grounded on language
cor-pora requires approaching each step carefully, from data selection and pre-processing to significance testing. In this paper, we report on our reproduction of a recent study based on a well-known conversational corpus (Switchboard). The reproduced study [9] focuses on speech rate convergence between speakers in conversation. While our reproduction confirms the main result of the original study, it also shows interesting variations in the details. In addition, we tested the original study for the robustness of its data selection and pre-processing, as well as the underlying model of speech rate, the variable observed. Our analysis shows that another approach is needed to take into account the com-plex aspects of speech rate in conversations. Another benefit of reproducing previous studies is to take analysis a step further, testing and strengthening the results of other research teams and increasing the validity and visibility of interesting studies and results. In this line, we also created a notebook of pre-processing and analysis scripts which is available online.
Keywords: reproduction study, convergence, speech rate
1 Introduction
Throughout the course of a conversation, each conversational partner, the
-’speaker’- and the -’interlocutor’-, changes a number of parameters of speech
production. Convergence phenomena refer to the tendency of conversational partners to co-adjust their speaking styles. Convergence between conversa-tional partners has been shown to occur at various levels, including syntactic and lexical levels [36], [4], [18], [6] and acoustic levels (intensity [32], [29]; fundamental frequency [17], [13]; speech rate [46]). Most of these studies use
1Aix-Marseille Univ, CNRS, LPL, Aix-en-Provence, France ·2Aix Marseille Univ, CNRS,
carefully controlled datasets in which all parameters except the scrutinized variable have been neutralized. This study sought to reproduce and expand the research [9] grounded on an existing corpus rather than experimentally con-trolled material. Cohen Priva et al. showed evidence of convergence in speech rate production using the Switchboard corpus [14]. The goal of our study was firstly to show that it was possible to reproduce the results of Cohen Priva et al. following the same procedures and using the same statistical tools and then to check the robustness of their findings. Replicability and reproduction have become a major focus as can be judged by the proliferation of special issues and conferences on these subjects in various fields, including psychology [34], [8] economics, and [42] medicine. The difference between replicability and reproducibility had been explored in [16, 37] and more specifically in language issues in [5]. Reproducibility is the calculation of quantitative scientific results by independent scientists using the original datasets, while replication is the practice of independently implementing scientific experiments to validate spe-cific findings. Reproducibility is beginning to receive well-deserved attention from the Natural Language Processing (NLP) community. In language sciences and in particular in NLP, reproducing a result may involve many detailed steps from the raw data to actual results. Our reproduction adopted the original au-thors’ choices in data selection and pre-processing and attempted to follow the exact procedure of the different steps in the analysis. Interestingly, while the main lines and results of the reproduced study were confirmed, specific results differed despite our having taken care not to alter the original experimental setup. Moreover, based on our reproduction we were able to explore the ro-bustness of the results by varying some of the parameters of the original study. We believe this constitutes another interest in reproducing a study.
Our reproduction study includes two parts: (i) the first part is related to the effects of gender and age on speech rate; (ii) the second part deals with the convergence of a speaker’s speech rate to their baseline and their interlocutor’s speech rate baseline. The latter part will show further analysis that we car-ried out on the corpus using the model from the reproduced study. First, we used different subsets of the main corpus, changing the number of minimum conversations per speaker. We then tested another approach to computing a crucial ingredient of the reproduced study, the expected word duration, and finally validated the model with a k-fold cross-validation technique. In this last part, we also demonstrated the benefit of using a different approach that took into account the temporal dynamic of speech rate, showing an example of the complex nature of convergence phenomena.
The paper is organized as follows: after describing the general interest of the research question (Section 2), we present our reproduction (Section 3) of the different experiments. We then present our additions to the initial study in Section 4, in particular with regard to dataset selection and the underlying model, and we call attention to the issue of speech rate dynamics.
2 Related Work and Motivation
Speech rate is a feature that has been explored extensively in the sphere of inter-speaker convergence. Studies in experimental settings using confederates ([41, 24]) have shown that speakers modify their speech rate in response to confederates’ variation. The study conducted by [11] using quasi-natural con-versations established that speakers tend to adjust their speech rate to each other. These speech rate variations are related to intended communicative and social goals. For example, in [44, 45, 46] conversants increased their speech rate to fit the impression that speakers with higher speech rates are considered to be more competent. In [7] speech rate accommodation is linked to intimacy and sociability. Finally, [30] showed that convergence in speech rate predicts cooperation.
The gender and age of participants can also affect speech rate and its convergence, as shown by [19, 25]. Specifically, women tend to converge more than men [39, 12, 48]; mixed-gender pairs tend to converge the most [28, 31], while in same-gender interactions, [33] found that male-male pairs showed the greatest degree of convergence. [25] found that speech rates were more strongly affected by the interlocutor’s gender than by the speaker’s gender. More precisely, both male and female speakers spoke at a similar, slow rate when interviewed by a woman, and faster when the interviewer was a man. Another trend is to evaluate convergence using third-party judgment (human judgment), such as in [31, 15], which compared speech rates within the same conversation or with those of various shadow participants [46, 29, 33, 40]. In the study reproduced here, Cohen Priva et al. compared the speech rate of both participants with the average value of their speech rates, or baseline, taken from other conversations. In the second part of their study, the conversants’
baselines, along with their gender and age, were investigated. It was shown that
a speaker may increase their usual speech rate, or baseline, in response to a fast-speaking interlocutor, or vice versa. Computing the baseline speech rate using more than one conversation makes it possible to compare speech rate robustly. Another benefit of this approach is to smooth out other external factors that could affect speech rate, such as the topic of the conversation. Cohen Priva et al.’s study is well suited for reproducibility studies due to its precise baseline model and the general availability of the dataset, the Switchboard corpus [14]. This corpus is composed of about 2400 conversations and 543 speakers, which meant that we could also carry out additional analyses by varying and altering the shape of the original dataset.
3 Reproduction of the Original Study
To ease comparison with the study conducted by Cohen Priva et al., we will use the same definitions. The speaker’s speech rate while speaking with the interlocutor I is indicated as SI, while the interlocutor’s speech rate with the
conversa-tions with anyone except I is indicated as SB (speaker baseline). Similarly,
IB (interlocutor baseline) is the speech rate baseline of the interlocutor while
speaking with anyone except S.
The data used in the reproduction are the same as in the original paper, the Switchboard corpus [14], in which participants took part in multiple telephone conversations. The 543 speakers in the corpus, with about 2400 transcribed conversations, were set up in both mixed and same gender and age dyads. The speakers were strangers to each other, and each speaker was paired randomly by a computer operator with various other speakers; for each conversation, a topic (from a list of 70 topics) was assigned randomly. In the pure reproduc-tion stage we only took into account conversareproduc-tions in which both participants had participated in at least one additional conversation with a different speak-er/interlocutor, as in the original study. After filtering the data by excluding speakers who took only took part in one conversation, we were left with 4788 conversation sides and 483 speakers.
3.1 Speech Rate
In their study, Cohen Priva et al. computed the Pointwise Speech Rate (PSR) for an utterance as the ratio between the utterance duration and expected
utterance duration.
PSR = utterance real duration utterance expected duration =
PN w=1t real w PN w=1t expected w (1) In Equation 1, treal
w is the time used by the speaker to pronounce the word
w in that utterance while texpected
w is the expected time necessary to pronounce
the word. N is the number of words in the utterance. Note that a value of PSR
> 1 means that the speaker rate is slower than expected. Conversely, a value
of < 1 means that the speaker rate is faster than the expected rate.
To calculate each word’s expected duration, Cohen Priva et al. used a linear regression model in which the median duration of the word across the entire Switchboard corpus, the length of the utterance, and the distance to the end of the utterance (in words) are the predictors of the word’s duration. Medians were used because the distribution of word durations are not symmetric. The authors also included the length of the utterance and the distance to the end of the utterance because it has been shown that these factors can affect speech rate ([23, 38, 22]).
We found that the mean word duration was 246 ms for both actual and ex-pected scenarios; the median word duration was 205 ms for actual and 208 ms for expected scenarios.
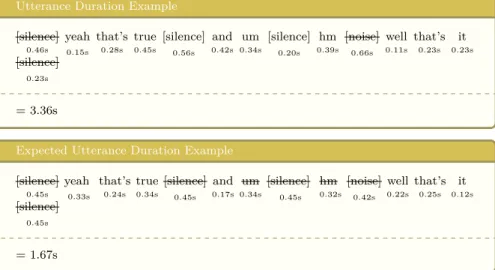
Expected utterance duration is defined as the sum of the expected
and oh). Real utterance duration is defined as the time from the beginning of the first word in an utterance, excluding silences and filled pauses, to the end of the last word in that utterance, excluding silences and filled pauses, but including intermediate silences and filled pauses. [noise], [vocalized-noise],
[laughter] were excluded from the computation of both utterance duration and
expected utterance duration.
Figure 1 shows an example of how time-aligned transcripts were used to compute speech rate.
Utterance Duration Example [silence] 0.46s yeah 0.15s that’s 0.28s true 0.45s [silence] 0.56s and 0.42s um 0.34s [silence] 0.20s hm 0.39s [noise] 0.66s well 0.11s that’s 0.23s it 0.23s [silence] 0.23s = 3.36s
Expected Utterance Duration Example [silence] 0.45s yeah 0.33s that’s 0.24s true 0.34s [silence] 0.45s and 0.17s um 0.34s [silence] 0.45s hm 0.32s [noise] 0.42s well 0.22s that’s 0.25s it 0.12s [silence] 0.45s = 1.67s
Fig. 1 Example of Speech Rate calculation for a given utterance.
In Equation 2, we calculated the speaker’s speech rate as the mean of the logarithm of the Pointwise Speech Rate (Equation 1) of all utterances with four or more words. Shorter utterances were not included because many of them were back-channels [49], such as isolated ’yeah’ or ’uhuh’, which may exhibit different phenomena in terms of speech rate; n is the number of utterances.
Speech rate = n X j=1 N≥4 log(P SRj) n (2)
Finally, both the speaker’s and interlocutor’s baseline speech rates were cal-culated using their mean speech rate from other conversations (SB and IB,
3.2 Statistical Models
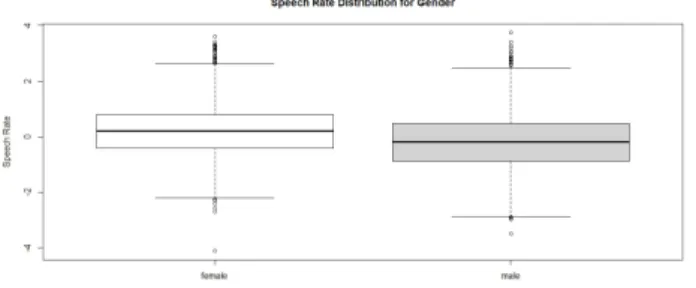
The statistical model used in the original study was a linear mixed regres-sion model with speech rate as the predicted value. The slope of the linear regression gives information about the effect of the fixed effect scrutinized. In Study 1 (Table 1), the model captures the differences between male and female populations, also illustrated in Figure 2. In this example, the negative slope indicates that the female population has a faster speech rate compared to the male population.
Fig. 2 Gender effect on speech rate; in this corpus the female population has a higher
speech rate value compared to that of the male population.
The lme4 library in R, version 3.4.3 [1] was used to fit the models and provide t-values. The lmerTest package [27], which encapsulates lme4, was used to estimate degrees of freedom (Satterthwaite approximation) and cal-culate p-values. All numerical predictors were standardized. All models used the interlocutor id, conversation id, and topic identity as random intercepts. The original Study 1 also used speaker id as a random intercept. Following the original study, we used the R p.adjust function to adjust p-values for multi-ple comparisons using the FDR (false discovery rate) method, as described by [3], in order to control the false discovery rate, with the expected proportion of false discoveries.
3.3 Study 1: Gender and Age Effects on Speech Rate
This part of our study sought to validate previous studies establishing that age and gender affect speech rate. Studies have found younger speakers to have faster speech rates than older speakers [10, 20, 21] and male speakers to have slightly faster rates than female speakers [22, 23, 25]. Gender, age, and their interaction were used as fixed effects.
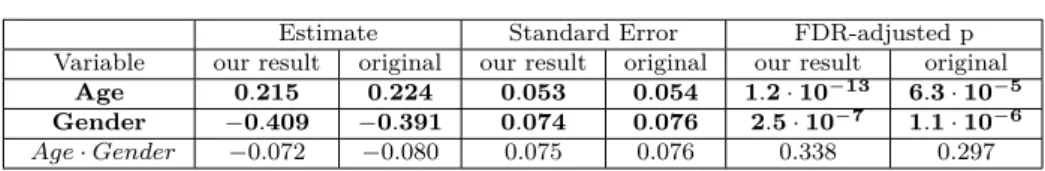
Results Similarly to Cohen Priva et al., we confirmed that older speakers are
Estimate Standard Error FDR-adjusted p Variable our result original our result original our result original
Age 0.215 0.224 0.053 0.054 1.2 · 10−13 6.3 · 10−5 Gender −0.409 −0.391 0.074 0.076 2.5 · 10−7 1.1 · 10−6
Age · Gender −0.072 −0.080 0.075 0.076 0.338 0.297
Table 1 Results - Comparison between our reproduction and the original Study 1
= 0.0532, p < 10−5, FDR-adjusted p < 10−6). Male speakers are generally more likely to have a faster rate of speech (β = -0.4089, SE = 0.0744, p < 10−7 , FDR-adjusted p < 10−6). Age did not affect male and female speakers differently (β = -0.0716, SE = 0.0748, unadjusted p = 0.3389 , FDR-adjusted
p > 0.05). A summary of these results is shown in Table 1 and compared
with the results of Cohen Priva et al. As shown, our study revealed the same tendencies as Cohen Priva et al.; in other words, both the age and gender of speakers affect speech rate.
3.4 Study 2: Converging to the Baseline
The second part of the original study attempted to determine to what extent speakers converge with their interlocutor’s baseline rate and verify the influ-ence of other features like gender and age on converginflu-ence. The method used was the same as that explained in Section 3.3, with several predictors added. First, two predictors were used for speech rate: speaker baseline speech rate, estimated from the speaker’s conversations with other interlocutors (SB), and
interlocutor baseline speech rate, estimated from the interlocutor’s
conversa-tions with others (IB).
Other predictors were included, as described by Cohen Priva et al., to take into account the identity of the speaker, and speaker and interlocutor properties like gender and age that could affect speech rate. To summarize, the predictors were:
– Age (standardized) of the interlocutor, and its interaction with the
(stan-dardized) age of the speaker: InterlocutorAge; InterlocutorAge ·SpeakerAge
– Gender of the interlocutor, and its interaction with the gender of the
speaker: Interlocutor Gender; Interlocutor Gender · Speaker Gender
– Interactions between the interlocutor’s baseline speech rate and all other
variables:
– Interlocutor Baseline · Speaker Baseline; – Interlocutor Baseline · Speaker Age; – Interlocutor Baseline · Interlocutor Age;
– Interlocutor Baseline · Interlocutor Age · Speaker Age; – Interlocutor Baseline · Speaker Gender;
– Interlocutor Baseline · Interlocutor Gender;
Estimate Standard Error FDR-adjusted p Variable(s) our results original our results original our results original
SB 0.7777 0.7940 0.0929 0.0090 2 · 10−16 2 · 10−16 IB 0.0464 0.0540 0.0094 0.0190 7 · 10−6 0.034 IAge 0.0231 0.0249 0.0089 0.0100 0.038 0.043 IGender −0.0181 0.0099 0.0927 0.0230 0.134 0.844 IB· SAge 0.0048 0.0025 0.0089 0.0090 0.720 0.844 IB· IAge −0.0004 −0.0079 0.0082 0.0090 0.960 0.630 IB· SAge −0.2094 −0.0230 0.0092 0.0100 0.111 0.053 IB· SGender −0.0075 0.0084 0.0092 0.0250 0.553 0.844 IB· SB −0.0173 −0.0176 0.0095 0.0100 0.183 0.162 IB· IGender −0.0144 −0.0009 0.0093 0.0270 0.246 0.974 IGender· SGender 0.0022 −0.0676 0.0101 0.0270 0.945 0.043 IB · SAge· IAge 0.0064 0.0040 0.0078 0.0070 0.550 0.844
IAge· SGender· IGender −0.0130 −0.0561 0.0091 0.0340 0.261 0.193
Table 2 Results - Comparison between our reproduction and the original Study 2, SB:
speaker baseline ; IB : interlocutor baseline; I/SAge: interlocutor / speaker age ; I/SSex:
interlocutor / speaker gender
Results As shown in Table 2, our reproduction is in agreement with the results
of Cohen Priva et al.; a speaker’s baseline speech rate has the most significant effect on their own speech rate in a conversation (β = 0.7777, standard error (SE) = 0.0929, p < 10−16, FDR-adjusted p < 2 · 10−16). Interlocutor base-line rate has a smaller significant effect on speaker speech rate (β = 0.0464, standard error (SE) = 0.0094, p < 8 · 10−8, FDR-adjusted p < 0.05 ). The positive coefficient indicates convergence: when speaking with an interlocutor who speaks slower or faster, the speaker’s speech rate changes in the same di-rection. The difference in the effects of speaker baseline rate and interlocutor baseline rate on speaker speech rate suggest that speakers are more consistent than they are convergent, and that they rely much more on their own baseline. Interlocutor age also has a significant effect on speaker speech rate (β = 0.0231, SE = 0.0089, p < 0.05, FDR-adjusted p < 0.05). The positive coefficient of this variable indicates that speakers are categorically slower while speaking with older speakers, regardless of the interlocutor baseline speech rate.
Finally, contrary to the results of Cohen Priva et al., the gender combi-nation of the speakers and interlocutors was not found to be significant in affecting speech rate.
4 Additional Analyses
In this section, we will describe additional analyses that we carried out on the Switchboard corpus to test the model proposed by [9]. We extended three aspects of the study in particular: (i) we used a subset of the corpus in order to only include speakers involved in more than two conversations; (ii) we applied a different model to compute expected word duration, and (iii) we tested the model on different data subsets following a k-fold approach.
4.1 Taking a More Conservative Stance on Baseline Estimates
As seen above, external factors like the topic of a conversation can affect speech rate. A speaker might vary their speech rate depending on how immersed they are in the discussion or according to how important they consider the topic to be. We mitigated this effect by applying the same model to subsets of the Switchboard corpus which only included speakers who were involved in at least N = 2, 3, 4, 5, or 6 conversations. We preferred to use a greater number of conversations per speaker to compute SB and IB, even if this meant that the
analysis was then based on a smaller number of total speakers. In this way, we obtained five different datasets with 483, 442, 406, 385, and 357 differ-ent speakers, respectively, and 4788, 4630, 4418, 4264, and 4018 conversation sides. The decision to use these datasets was also due to other factors. For example, emotion can affect a speaker’s manner of speaking and subsequently their speech rate. Previous studies such as [47] compared the effect of emo-tions by recognizing them through speech analysis using several databases, while [43] demonstrated that people who feel sad may speak more slowly and softly. Using a greater number of conversations per speaker made it possible to smooth out these effects when computing the baseline. As for Study 2, we only took into account the predictors which were significant in the previous study. Table 3 shows the magnitude of the estimates (for Study 1) for each subset. The magnitude of the effect of gender on speech rate increased with the number of conversations, while the effect of age decreased. Moreover, both variables preserved significance with an adjusted p-value which in the worst case (corresponding to the dataset with six conversations per speaker) was
p = 0.009 for speaker age and p ∼ 10−8 for speaker gender. The meaning of the estimates was still significant, even when a smaller amount of data was used. These results demonstrate the model’s robustness.
Speaker Gender Speaker Age Gender.Age
N Est. SD adj.p Est. SD adj.p Est. SD adj.p
2 −0.409 0.075 3.10−7 0.215 0.053 1.10−4 −0.072 0.075 0.338
3 −0.466 0.077 1.10−8 0.208 0.054 2.10−4 −0.027 0.077 0.726
4 −0.486 0.079 6.10−9 0.206 0.056 4.10−4 −0.059 0.079 0.455
5 −0.475 0.081 4.10−8 0.185 0.059 0, 002 −0.056 0.082 0.496
6 −0.475 0.083 9.10−8 0.163 0.060 0, 009 −0.003 0.085 0.968
Table 3 Estimate, standard deviation and adjusted p-value for the gender, age and gender ·
age for different subsets of the Switchboard corpus. The subsets contain at least N = 2, 3, 4, 5, and 6 conversations per speaker.
In our extension of Study 2, we only took into account significant predic-tors. The results in Table 4 show that the magnitude of the speaker baseline, the interlocutor baseline and the interlocutor age all increased, but age lost significance as the minimum number of conversations increased. The speech rate results were mainly affected by the speaker baseline and interlocutor base-line. Moreover, the fact that interlocutor age did not seem to affect speech rate
convergence implies that the results would not be reproduced if we reduced the size of the dataset. These results suggest reviewing the threshold of the p-value, as discussed in [2].
Speaker Baseline Interlocutor Baseline Interlocutor Age
N Est. SD adj.p Est. SD adj.p Est. SD adj.p
2 0.778 0.009 2.10−16 0.046 0.009 7.10−6 0.023 0.009 0.038 3 0.782 0.009 2.10−16 0.059 0.019 0.018 0.022 0.009 0.084
4 0.782 0.010 2.10−16 0.060 0.019 0.019 0.021 0.009 0.138
5 0.780 0.010 2.10−16 0.059 0.0200 0.023 0.021 0.009 0.144
6 0.780 0.010 2.10−16 0.065 0.0200 0.009 0.022 0.010 0.106
Table 4 Estimate, standard deviation and adjusted p-value for the speaker baseline,
inter-locutor baseline and interinter-locutor age for different subsets of the Switchboard corpus. The subsets contain at least N = 2, 3, 4, 5, and 6 conversations per speaker.
4.2 Variation on Expected Duration Computation
The definition of speech rate at the utterance level is taken to be the ratio between utterance duration and expected utterance duration. Speech rate is therefore influenced by the way the expected duration of each word is com-puted. Assuming that the duration of a word depends on the length of the utterance, the position of the word in the utterance and the median duration of that word in the entire corpus, we fitted the expected duration using an artificial neural network regression with a one-hidden layer of 10 neurons and an adaptive learning method. The model was integrated by the use of the Scikit-Learn package in Python [35]. In this case, we found that the median of the expected word duration was ∼ 205 ms, just like the median word dura-tion in the corpus. Applying the same procedure as described in the previous paragraph, we obtained the results in Table 5. The direction of the estimates and SD results remained similar to what was found in Section 4.1, thus re-inforcing the hypothesis that both speaker baseline and interlocutor baseline affect speech rate.
Speaker Baseline Interlocutor Baseline Interlocutor Age
N Est. SD adj.p Est. SD adj.p Est. SD adj.p
2 0.780 0.009 2 · 10−16 0.055 0.019 0.035 0.023 0.009 0.048 3 0.787 0.009 2 · 10−16 0.058 0.019 0.019 0.022 0.009 0.078
4 0.785 0.010 2 · 10−16 0.058 0.019 0.022 0.021 0.009 0.137
5 0.782 0.010 2 · 10−16 0.058 0.019 0.024 0.021 0.009 0.140
6 0.797 0.010 2 · 10−16 0.065 0.024 0.009 0.022 0.010 0.093
Table 5 Results obtained using the method described in Section 4.2 to compute the
ex-pected word duration. Estimate, standard deviation and adjusted p-value for the speaker baseline, interlocutor baseline and interlocutor age for different subsets with at least N = 2, 3, 4, 5 and 6 conversations.
4.3 Validation of the Model on Smaller Datasets
Finally, to further validate the model, we applied a cross-validation (k-fold) approach to determine if the results were still significant in smaller datasets. We used k = 5 to obtain each subset from the main corpus. We filtered the data to create a non-independent (the subset could contain overlapping data) with conversation size representing 80% of the total duration of the corpus, used in Section 3. In this way, each dataset contained 3830 conversation sides with the condition that each speaker participated in at least two conversations. We compared the results of Study 2 (Section 3.4) with the mean and standard deviation of the results computed on the subsets as detailed in Table 4.3. We found that although interlocutor baseline and interlocutor age (estimates and standard deviation values) were consistent with the values in Section 3 and showed the same direction of effect, they no longer were statistically significant. Moreover, the estimate for the speaker baseline appeared to be slightly lower compared to the result of the whole dataset but still was significant. The lack of significance cannot be attributed to the smaller number of speakers in the datasets. The minimum number of speakers involved in the subsets was 452, which is about 95% of the total number used in Section 3. The difference in the results could be attributed to the use of fewer conversation sides per speaker in the k-fold subsets (after the filtering processing), which reinforces our proposal to take into account more than two conversations per speaker. These results suggest that speech rate is mainly affected by the speaker baseline when both the number of conversations and the number of speakers decrease.
estimate SD adj-p
Variable k-fold all k-fold all k-fold all
SB 0.764 ± 0.011 0.778 0.011 ± 0.002 0.009 2 · 10−16 2 · 10−16 IB 0.055 ± 0.007 0.046 0.001 ± 0.010 0.009 0.110 ± 0.071 7 · 10−6
IAge 0.016 ± 0.008 0.023 0.011 ± 0.001 0.009 0.130 ± 0.029 0.038
Table 6 Estimate, standard deviation and adjusted p-value for the speaker baseline,
inter-locutor baseline and interinter-locutor age averaged on the 5 different subsets and compared with the value computed in Section 3.4
.
4.4 Beyond Averages
The reproduction we carried out, including additional analyses to test the ro-bustness of the model, use speech rate as the mean value of all the utterances produced by the speaker in the whole conversation. Even if this approach captures the general properties and behavior of the speakers and their in-terlocutors while conversing, it cannot account for the complex dynamics of speech rate precisely over the course of the conversation. To get a closer view
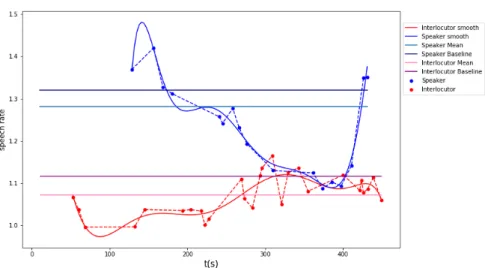
of what speech rate variation looks like in conversation, we produced a series of speech rate plots in actual conversations, as shown in Figure 3.
Fig. 3 Blue (upper part) and red (bottom part) indicate the speaker and interlocutor
variables, respectively.
First of all, we note that Study 2 focused on comparing baselines and aver-age speech rates (straight lines). To illustrate the variability and complexity of speech rate in a conversation, we plotted the speech rate for each utterance for both the speaker and the interlocutor. We smoothed the data using a moving average with a window (n = 6). We then applied a polynomial fit p(x) of order
k = 8 to the filtered data to obtain the trend of the speech rate as a smoothed
function. As we can see, the difference between the average speech rate of the speaker and the interlocutor (respectively in light blue and pink) is ∼ 0.4. These averaged values are in accordance with the punctual speech rate (blue for speaker and red for interlocutor) at the utterance level for the first part of the conversation (up to 300 s) that shows a considerable difference between the conversants. However, this hides the fact that the difference is less than 0.05 in the temporal interval of 300 − 400 s. In this interval of the conversa-tion, the speaker and interlocutor have a similar trend in their speech rates, each converging toward their respective interlocutor. A model that uses the average speech rate over the course of the whole conversation ignores the com-plex dynamic of the speaker’s behavior that can alternate between attitudes of convergence, divergence or ignorance during the conversation. Moreover, average speech rate is sensitive to outliers. This issue could affect the analy-sis of speech rate in conversations, leading to an erroneous description of the conversants’ behavior. The variation we found in speech rate over the course
of a conversation points to the need for new analytical approaches that take conversational dynamics into account.
5 GitHUb Repository
In order to facilitate further reproductions and replications, we created a JuPyteR [26] notebook with the code developed to reproduce the study of [9] as well as the additional analyses described in this paper in Sections 4, 4.1, and 4.2. The notebook contains Python scripts and can be used to perform the following tasks:
1. Pre-Processing the transcripts of the Switchboard corpus 2. Computing the speech rate as described in detail in Section 3.1 3. Computing the baseline and standardizing the data
In addition, we added R scripts to use to perform the statistical analysis described in Sections 3.2, 3.3, and 3.4.
The code is accessible at https://github.com/simonefu/Converging_ to_baseline
6 Conclusion
The results of our reproduction of the study of [9] confirmed that the gender and age of speakers affect speech rate production (Study 1), as stated in the original work. In Study 2, our reproduction confirmed that both speaker base-line and interlocutor basebase-line affect speech rate, supporting the theory that speakers’ speech rates tend to converge, as explained in the original paper. In particular, the speaker’s baseline has a stronger effect on their own speech rate than the interlocutor’s baseline. Conversely, the interaction of interlocutor baseline and speaker gender did not have a significant effect on convergence. Moreover, our verification of the robustness of the model revealed that only the speaker baseline effect retained significance when we reduced the number of speakers.
More generally, despite their key importance, replication/reproduction stud-ies in language sciences of the kind presented here have been too rare. They constitute a crucial ingredient needed to make scientific results more reliable and more credible inside and outside the community. Furthermore, replicated studies constitute the perfect ground for extending previous work. We hope that the benefits exhibited in this paper can convince more NLP and language science researchers to initiate replications and present them in dedicated pa-pers.
Finally, the visual exploration of speech rate we have presented here allowed us to grasp the distances between the study we focused on, our replication, and the actual complexity of the phenomena. Our results add to the interest of the reproduced study and reveal how much we still have left to understand about conversational dynamics.
Acknowledgements This project has received funding from the European Union’s Horizon
2020 research and innovation programme under the Marie Sk lodowska-Curie grant agree-ment No713750. Also, the project was carried out with the financial support of the Regional Council of Provence- Alpes-Cˆote d’Azur and with the financial support of the A*MIDEX (n ANR- 11-IDEX-0001-02), funded by the Investissements d’Avenir project funded by the French Government, managed by the French National Research Agency (ANR). Our re-search was also supported by ANR-16-CONV-0002 (ILCB) and ANR-11-LABX-0036 (BLRI) grants.
References
1. Bates, D., Maechler, M., Bolker, B., Walker, S., et al.: lme4: Linear mixed-effects models using eigen and s4. R package version 1(7), 1–23 (2014)
2. Benjamin, D.J., Berger, J.O., Johannesson, M., Nosek, B.A., Wagenmakers, E.J., Berk, R., Bollen, K.A., Brembs, B., Brown, L., Camerer, C., et al.: Redefine statistical signif-icance. Nature Human Behaviour p. 1 (2017)
3. Benjamini, Y., Hochberg, Y.: Controlling the false discovery rate: a practical and pow-erful approach to multiple testing. Journal of the Royal statistical society: series B (Methodological) 57(1), 289–300 (1995)
4. Bock, J.K.: Syntactic persistence in language production. Cognitive psychology 18(3), 355–387 (1986)
5. Branco, A., Cohen, K.B., Vossen, P., Ide, N., Calzolari, N.: Replicability and repro-ducibility of research results for human language technology: introducing an lre special section (2017)
6. Brennan, S.E., Clark, H.H.: Conceptual pacts and lexical choice in conversation. Journal of Experimental Psychology: Learning, Memory, and Cognition 22(6), 1482 (1996) 7. Buller, D.B., Aune, R.K.: The effects of speech rate similarity on compliance:
Appli-cation of communiAppli-cation accommodation theory. Western Journal of CommuniAppli-cation
56(1), 37–53 (1992)
8. Camerer, C.F., Dreber, A., Forsell, E., Ho, T.H., Huber, J., Johannesson, M., Kirchler, M., Almenberg, J., Altmejd, A., Chan, T., et al.: Evaluating replicability of laboratory experiments in economics. Science 351(6280), 1433–1436 (2016)
9. Cohen Priva, U., Edelist, L., Gleason, E.: Converging to the baseline: Corpus evidence for convergence in speech rate to interlocutor’s baseline. The Journal of the Acoustical Society of America 141(5), 2989–2996 (2017)
10. Duchin, S.W., Mysak, E.D.: Disfluency and rate characteristics of young adult, middle-aged, and older males. Journal of communication disorders 20(3), 245–257 (1987) 11. Freud, D., Ezrati-Vinacour, R., Amir, O.: Speech rate adjustment of adults during
conversation. Journal of Fluency Disorders 57, 1 – 10 (2018). DOI https://doi.org/ 10.1016/j.jfludis.2018.06.002. URL http://www.sciencedirect.com/science/article/ pii/S0094730X17301195
12. Gallois, C., Callan, V.J.: Communication accommodation and the prototypical speaker: Predicting evaluations of status and solidarity. Language and Communication 8(3), 271 – 283 (1988). Special Issue Communicative Accomodation: Recent Developments 13. Giles, H., Powesland, P.: Accommodation theory. In: Sociolinguistics, pp. 232–239.
Springer (1997)
14. Godfrey, J.J., Holliman, E.C., McDaniel, J.: Switchboard: Telephone speech corpus for research and development. In: Acoustics, Speech, and Signal Processing, 1992. ICASSP-92., 1992 IEEE International Conference on, vol. 1, pp. 517–520. IEEE (1992) 15. Goldinger, S.D.: Echoes of echoes? an episodic theory of lexical access. Psychological
Review 105(2), 251–279 (1989)
16. Goodman, S.N., Fanelli, D., Ioannidis, J.P.: What does research reproducibility mean? Science translational medicine 8(341), 341ps12–341ps12 (2016)
17. Gravano, A., Beˇnuˇs, ˇS., Levitan, R., Hirschberg, J.: Three tobi-based measures of prosodic entrainment and their correlations with speaker engagement. In: Spoken Lan-guage Technology Workshop (SLT), 2014 IEEE, pp. 578–583. IEEE (2014)
18. Gries, S.T.: Syntactic priming: A corpus-based approach. Journal of psycholinguistic research 34(4), 365–399 (2005)
19. Hannah, A., Murachver, T.: Gender and conversational style as predictors of conver-sational behavior. Journal of Language and Social Psychology 18(2), 153–174 (1999). DOI 10.1177/0261927X99018002002
20. Harnsberger, J.D., Shrivastav, R., Brown, W., Rothman, H., Hollien, H.: Speaking rate and fundamental frequency as speech cues to perceived age. Journal of voice 22(1), 58–69 (2008)
21. Horton, W.S., Spieler, D.H., Shriberg, E.: A corpus analysis of patterns of age-related change in conversational speech. Psychology and aging 25(3), 708 (2010)
22. Jacewicz, E., Fox, R.A., O’Neill, C., Salmons, J.: Articulation rate across dialect, age, and gender. Language Variation and Change 21(2), 233–256 (2009). DOI 10.1017/ S0954394509990093
23. Jiahong Yuan Mark Liberman, C.C.: Towards an integrated understanding of speaking rate in conversation. Proceedings of Interspeech, Pittspurgh pp. 541–544 (1980) 24. Jungers, M.K., Hupp, J.M.: Speech priming: Evidence for rate persistence in unscripted
speech. Language and Cognitive Processes 24(4), 611–624 (2009)
25. Kendall, T.: Speech rate, pause, and linguistic variation: An examination through the sociolinguistic archive and analysis project. Phd Thesis, Duke University (2009) 26. Kluyver, T., Ragan-Kelley, B., P´erez, F., Granger, B., Bussonnier, M., Frederic, J.,
Kel-ley, K., Hamrick, J., Grout, J., Corlay, S., Ivanov, P., Avila, D., Abdalla, S., Willing, C.: Jupyter notebooks – a publishing format for reproducible computational workflows. In: F. Loizides, B. Schmidt (eds.) Positioning and Power in Academic Publishing: Players, Agents and Agendas, pp. 87 – 90. IOS Press (2016)
27. Kuznetsova, A., Bruun Brockhoff, P., Haubo Bojesen Christensen, R.: lmertest: tests for random and fixed effects for linear mixed effects models. See https://CRAN. R-project. org/package= lmerTest (2014)
28. Levitan, R., Gravano, A., Willson, L., Beˇnuˇs, S., Hirschberg, J., Nenkova, A.: Acoustic-prosodic entrainment and social behavior. In: Proceedings of the 2012 Conference of the North American Chapter of the Association for Computational Linguistics: Human language technologies, pp. 11–19. Association for Computational Linguistics (2012) 29. Levitan, R., Hirschberg, J.: Measuring acoustic-prosodic entrainment with respect to
multiple levels and dimensions. In: Proceedings of Interspeech 2011 (2011)
30. Manson, J.H., Bryant, G.A., Gervais, M.M., Kline, M.A.: Convergence of speech rate in conversation predicts cooperation. Evolution and Human Behavior 34(6), 419 – 426 (2013)
31. Namy, L.L., Nygaard, L.C., Sauerteig, D.: Gender differences in vocal accommodation:: The role of perception. Journal of Language and Social Psychology 21(4), 422–432 (2002). DOI 10.1177/026192702237958
32. Natale, M.: Convergence of mean vocal intensity in dyadic communication as a function of social desirability. Journal of Personality and Social Psychology 32(5), 790 (1975) 33. Pardo, J.S.: On phonetic convergence during conversational interaction. The Journal of
the Acoustical Society of America 119(4), 2382–2393 (2006)
34. Pashler, H., Wagenmakers, E.J.: Editors’ introduction to the special section on repli-cability in psychological science: A crisis of confidence? Perspectives on Psychological Science 7(6), 528–530 (2012)
35. Pedregosa, F., Varoquaux, G., Gramfort, A., Michel, V., Thirion, B., Grisel, O., Blondel, M., Prettenhofer, P., Weiss, R., Dubourg, V., et al.: Scikit-learn: Machine learning in python. Journal of Machine Learning Research 12(Oct), 2825–2830 (2011)
36. Pickering, M.J., Garrod, S.: Toward a mechanistic psychology of dialogue. Behavioral and brain sciences 27(2), 169–190 (2004)
37. Plesser, H.E.: Reproducibility vs. replicability: a brief history of a confused terminology. Frontiers in neuroinformatics 11, 76 (2018)
38. Quen´e, H.: Multilevel modeling of between-speaker and within-speaker variation in spon-taneous speech tempo. The Journal of the Acoustical Society of America 1104(123) (2008)
39. R.Bilous, F., M.Krauss, R.: Dominance and accommodation in the conversational be-haviours of same-and mixed-gender dyads. Language and Communication 8(3), 183–194 (1988)
40. Sanker, C.: Comparison of phonetic convergence in multiple measures. in Cornell Work-ing Papers in Phonetics and Phonology pp. 60–75 (2015)
41. Schultz, B.G., O’Brien, I., Phillips, N., Mcfarland, D.H., Titone, D., Palmer, C.: Speech rates converge in scripted turn-taking conversations. Applied Psycholinguistics 37(5), 1201–1220 (2016)
42. Shekelle, P.G., Kahan, J.P., Bernstein, S.J., Leape, L.L., Kamberg, C.J., Park, R.E.: The reproducibility of a method to identify the overuse and underuse of medical procedures. New England Journal of Medicine 338(26), 1888–1895 (1998)
43. Siegman, A.W., Boyle, S.: Voices of fear and anxiety and sadness and depression: the effects of speech rate and loudness on fear and anxiety and sadness and depression. Journal of Abnormal Psychology 102(3), 430 (1993)
44. Smith, B.L., Brown, B.L., Strong, W.J., Rencher, A.C.: Effects of speech rate on per-sonality perception. Language and Speech 18(2), 145–152 (1975)
45. Smith, B.L., Brown, B.L., Strong, W.J., Rencher, A.C.: Effects of speech rate on per-sonality attributions and competency evaluations (1980)
46. Street, R.L.: Speech convergence and speech evaluation in fact-finding iinterviews. Hu-man Communication Research 11(2), 139–169 (1984). DOI 10.1111/j.1468-2958.1984. tb00043.x
47. Ververidis, D., Kotropoulos, C.: Emotional speech recognition: Resources, features, and methods. Speech communication 48(9), 1162–1181 (2006)
48. Willemyns, M., Gallois, C., Callan, V.J., Pittam, J.: Accent accommodation in the job interview: Impact of interviewer accent and gender. Journal of Language and Social Psychology 16(1), 3–22 (1997). DOI 10.1177/0261927X970161001
49. Yngve, V.H.: On getting a word in edgewise. In: Chicago Linguistics Society, 6th Meet-ing, pp. 567–578 (1970)