Publisher’s version / Version de l'éditeur:
Carbon, 124, pp. 201-211, 2017-07-03
READ THESE TERMS AND CONDITIONS CAREFULLY BEFORE USING THIS WEBSITE.
https://nrc-publications.canada.ca/eng/copyright
Vous avez des questions? Nous pouvons vous aider. Pour communiquer directement avec un auteur, consultez la
première page de la revue dans laquelle son article a été publié afin de trouver ses coordonnées. Si vous n’arrivez pas à les repérer, communiquez avec nous à PublicationsArchive-ArchivesPublications@nrc-cnrc.gc.ca.
Questions? Contact the NRC Publications Archive team at
PublicationsArchive-ArchivesPublications@nrc-cnrc.gc.ca. If you wish to email the authors directly, please see the first page of the publication for their contact information.
NRC Publications Archive
Archives des publications du CNRC
This publication could be one of several versions: author’s original, accepted manuscript or the publisher’s version. / La version de cette publication peut être l’une des suivantes : la version prépublication de l’auteur, la version acceptée du manuscrit ou la version de l’éditeur.
For the publisher’s version, please access the DOI link below./ Pour consulter la version de l’éditeur, utilisez le lien DOI ci-dessous.
https://doi.org/10.1016/j.carbon.2017.07.005
Access and use of this website and the material on it are subject to the Terms and Conditions set forth at
Variation of the optical properties of soot as a function of particle mass Dastanpour, Ramin; Momenimovahed, Ali; Thomson, Kevin; Olfert, Jason; Rogak, Steven
https://publications-cnrc.canada.ca/fra/droits
L’accès à ce site Web et l’utilisation de son contenu sont assujettis aux conditions présentées dans le site LISEZ CES CONDITIONS ATTENTIVEMENT AVANT D’UTILISER CE SITE WEB.
NRC Publications Record / Notice d'Archives des publications de CNRC:
https://nrc-publications.canada.ca/eng/view/object/?id=c87de977-263a-4991-8ec3-b93101414531 https://publications-cnrc.canada.ca/fra/voir/objet/?id=c87de977-263a-4991-8ec3-b93101414531
Variation of the Optical Properties of Soot as a Function of Particle Mass
Ramin Dastanpoura*, Ali Momenimovahedb, Kevin Thomsonb, Jason Olfertc, Steven Rogaka
aDepartment of Mechanical Engineering, University of British Columbia, Vancouver, British
Columbia, Canada
bMeasurement Science and Standards, National Research Council, Ottawa, Ontario, Canada cDepartment of Mechanical Engineering, University of Alberta, Edmonton, Alberta, Canada
Abstract
Light absorption and scattering properties of combustion-generated soot particles are important to measurement methods and are used as the inputs for climate models. For decades, mass-specific absorption cross section (MAC) of soot has been assumed to be independent of its size and mass. Here we investigate the size-dependent optical properties of particles produced by a single source.
Soot particles were produced by combustion of CH4, and CH4 - N2 mixtures, within a laminar
inverted diffusion flame. Extinction and scattering coefficients of mass-classified particles were measured by a Cavity Attenuated Phase Shift Single Scattering Albedo Spectrometer. Primary particle diameter and morphology of particles were characterized by transmission electron microscopy. Graphitization level of the size-classified particles was also investigated by Raman spectroscopy.
Here, for the first time we observed that MAC and graphitization level of the soot particles increase with the particle mass. MAC number increases from approximately 4.5 to 8.5 (m2g-1) with the particle mass increasing from 0.05 fg to 8 fg. The soot aggregate size is correlated with primary particle size, which may reflect the inhomogeneity of the combustion environment that could affect the optical properties of soot.
1. Introduction
Soot particles are agglomerates of smaller primary particles formed by incomplete combustion of hydrocarbons. These aerosols are known to be responsible for adverse health effects [1] and climate forcing [2]. With a radiative forcing ranging between 0.5 W m-2 and 0.9 W m-2, soot is considered as the greatest anthropogenic aerosol contributor to global warming [3–7]. Unlike greenhouse gases, soot has a brief atmospheric lifetime of approximately 6 to 10 days [8] and reduction of its emissions could lead to rapid mitigation of the climate forcing on a short time scale. These issues have motivated governments to introduce more stringent emission control regulations aiming to reduce the production of the climate-forcing species. In spite of numerous investigations, uncertainties in the net radiative forcing of atmospheric aerosols are still
relatively large. The accuracy of climate models and health studies can be enhanced by accurate measurement of emission rates and properties of soot particles.
A large group of emission and dispersion measurements are based on the estimation of the particle mass [9,10] and its hydrodynamic properties [11–17]. Great effort has also been devoted to the estimation of soot radiative properties as inputs for climate models and a method for indirect measurement of mass emission rates. Absorption and scattering properties of soot have been measured in several studies [4,18–24]. Mass-specific absorption cross section (MAC), mass-specific scattering cross section (MSC), and single scattering albedo (� ) are important parameters required for accurate measurement of the emission rates and modeling of climate forcing.
For decades, the MAC of soot particles has been assumed to be independent of particle size and mass. Values in the range of 3.5 (m2 g-1) to 8.3 (m2 g-1), at a wavelength of 660 nm, have been reported in literature for MAC numbers [5,18,20–22,25–30] of soot particles of different ages produced by different fuels and combustion environments. In these studies, MAC is considered to be independent of particle morphology and size; and only a single number is reported for the ensemble of particles produced at each condition. However, recent simulations of Wu et al. [31] have showed that MAC is weakly correlated by the primary particle size. Published values of MAC, MSC, and � are summarized in Tables 1–3.
A few recent studies have shown that the primary particle diameter is correlated with the diameter of the soot aggregates in many combustion sources [11,12,32–35]. Dastanpour &
Rogak (2014) have also shown that the primary particles are distributed more uniformly within individual aggregates compared to the ensemble of particles produced in a single operating condition for different sources. This suggests that these aggregates are formed in relatively homogeneous microscopic regions; after formation and growth, aggregates from different regions are mixed to form the ensemble emissions. Particles experiencing different formation and oxidation patterns and/or residence time may have different internal structures and optical properties. Here, we have investigated the variation of the optical properties, morphology, and internal structure of the soot particles produced by a laboratory-scale inverted burner at different operating conditions.
2. Experimental
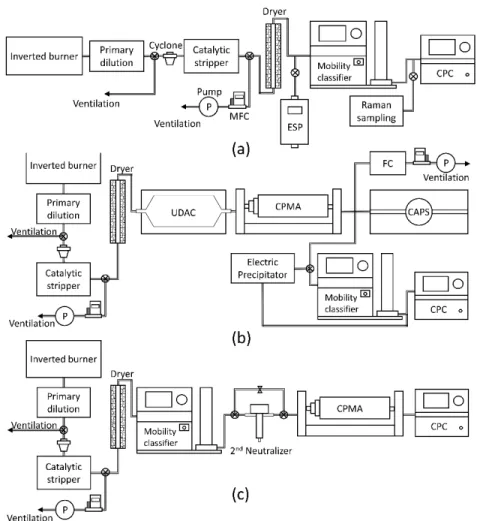
Three distinct configurations were used for the measurements reported here (Figure 1). These include (1) size measurement and particle collection for electron microscopy and Raman
spectroscopy (Figure 1, panel a), (2) measurement of the optical properties and size distributions of the particles classified based on their mass-to-charge ratio (Figure 1, panel b), and (3)
effective density measurement (Figure 1, panel c).
Figure 1: Experimental configuration. Acronyms used in this figure are as follows: MFC: mass flow controller, ESP: electrostatic precipitator, CPC: condensation particle counter, UDAC: unipolar diffusion particle charger, CPMA: centrifugal particle mass analyzer, FC: faraday cup, CAPS: cavity attenuated phase shift spectrometer. Note that each mobility classifier consists of a
2.1 Particle generation and treatment
Soot particles were produced by an inverted coflow methane/air diffusion flame. This type of flame was first introduced by [36]. The inverted design prevents the flame from flickering and provides a stable source for soot with a wide range of size distributions [37–39]. The inverted burner was run at two setpoints: (1) High EC (Elemental Carbon), and (2) N2-diluted. The
combustion air and fuel flow rates for both set points were 15.2 and 1.21 lpm, respectively. The mixing Nitrogen flow rate for the N2-diluted set point was 0.52 lpm. ”Primary” particle-free
dilution air at 60°C was added to the system at approximately 10–20 cm downstream of the flame tip to prevent the condensation of semi-volatile material. Primary dilution air flow rates of 200 lpm and 150 lpm were used for High EC and N2-diluted operating conditions, respectively.
At both operating conditions, soot aerosols were passed through a catalytic denuder (often called a catalytic stripper) operated at 350°C. A cyclone with the cut point of 1 m at 25 lpm was employed upstream of the catalytic denuder in order to remove relatively larger particles. A vacuum pump along with a flow controller was used after the catalytic denuder in parallel with other measurement devices to maintain a constant flow rate of 25 lpm through the cyclone- catalytic denuder at all test conditions (panels a-c). To confirm the removal of organic material, the mass ratio of the elemental carbon to total carbon, EC/TC, was measured downstream of the catalytic denuder using quartz filters and a thermal-optical EC/TC Aerosol Analyzer from Sunset Laboratory, run on a thermal-optical transmittance protocol (D6877-13e1, 2013). Measured EC/TC ratios were greater than 97% in both operating conditions.
The sample was drawn from the main exhaust line of the burner, approximately 1.5 meter downstream of the flame tip. In order to decrease the measured scattering intensities, a secondary unheated dilution air was mixed with the sample. A sample line with a length of 5 meter was used to transfer the sample from sampling point to the measurement instruments.
For all measurements conducted here, excess aerosol flow was extracted upstream of the
catalytic denuder by a mass flow controller (MFC) in order to maintain a flowrate of 1.5 lpm for size measurement and particle collection experiments, 3 lpm for effective density measurements, and 3.2 lpm for optical measurements through the instrument. For all cases, the denuded stream was then passed through a TSI diffusion dryer (model 3062) filled with silica gel to remove remaining water vapor.
2.2 Size distributions
Size distributions and concentrations of the particles produced at both operating conditions were measured by a TSI scanning mobility particle sizer (SMPS), as shown in panel a of Figure 1. SMPS consists of a condensation particle counter (CPC; model 3776), and a classifier (model 3080) equipped with a neutralizer (model 3077A) and a differential mobility analyzer (DMA; model 3081).
2.3 Electron microscopy
Soot particles were collected for electron microscopy by a point-to-plane electrostatic
precipitator (electric field of ~5 kV), ESPnano from DASH Connector Technology [41]. Copper grids with carbon substrate were used for electron microscopy. Images were produced using a Hitachi H7600 transmission electron microscope operated at 80 kV under high-resolution mode. Images were taken at the center and four other locations around the grid; and at optimum optical focus with nominal resolution of 0.2 nm. An open-source automatic image processing program [42] was used for the characterisation of the morphological parameters from the TEM images.
2.4 Raman Spectroscopy
Raman spectroscopy was performed on size-classified soot samples at mobility-equivalent diameters of 125 nm, 250 nm, and 300 nm generated at High EC operating condition. These samples were collected on preheated quartz filters using unheated filter holders. Considering the roughness of the filter surface, the average Raman spectra was acquired over several individual particles.
Soot samples were excited by a commercial microRaman system (LabRAM HR, Horiba Jobin Yvon) at 632.8 nm radiation and a power of 0.17 mW. Incident radiation was coupled into an Olympus BX51 optical microscope and focused to a 1.6 mm diameter spot through a Leica 50x low-working-distance objective with a numerical aperture of 0.55. The objective collects the retro-reflected radiation and guides it through a notch filter to remove the Rayleigh-scattered radiation. The Raman signal was recorded over a frequency range of 646–2792 cm-1 with a
resolution of 2 cm-1.
Several studies have shown that the Raman spectra of carbonaceous material is well represented by a five-band fit method [43,44]. Considering this, the measured spectra was fitted by 4
Lorentzian-shaped bands (G centered at 1580 cm-1, D1 centered at 1350 cm-1, D2 centered at 1620 cm-1, D4 centered at 1200 cm-1) and one Gaussian-shaped band (D3 centered at 1500 cm-1) [44]. Detailed description of these bands and spectra analysis is provided by Saffaripour et al. 2016 [45].
2.5 Optical properties
The experimental setup used for the measurement of light scattering and extinction is illustrated in Figure 1, panel b. The conditioned aerosol was first charged by a unipolar diffusion aerosol charger (UDAC, Cambustion Ltd.) [46] operated at a flowrate of 3.2 lpm. Particles passing through this instrument gain high net-positive charge distribution. Charged particles were then classified by a centrifugal particle mass analyzer (CPMA, Cambustion Ltd) at sample flowrate of 3.2 lpm. This instrument consists of two concentric rotating electrodes. Based on the balance between the centrifugal and electrostatic forces acting on the charged particles, only particles of a narrow range of the mass to charge ratio will exit the instrument [47].
The CPMA was run at different mass-to-charge ratios in the ranges of 0.05 to 0.5 and 0.03 to 0.2 fg per elementary charge for High EC and N2-diluted operating conditions, respectively. An
aerosol flow meter (AFM; Cambustion Ltd.) was used downstream of the CPMA for measurement of the sample flow rate.
After the flowmeter the flow is split and sent to a cavity attenuated phase shift spectrometer (CAPS-PMssa monitor, Aerodyne Research Inc.), SMPS, and an electrometer. The electrometer is used to measure the electric charge density of the aerosol. Since the aerosol exiting the CPMA has a narrow range of mass to charge ratio, the electrical charge density is directly proportional to the mass concentration. Thus CPMA-electrometer system produces an aerosol of known mass concentration with relatively low uncertainty [48]. This system has been used in the past to calibrate black carbon mass instruments [49].
A potential problem with the CPMA-electrometer system is that uncharged particles can pass through the CPMA if it is rotating slowly which results in particle mass that is not measured by the electrometer [48]. Therefore, the concentration of uncharged particles was occasionally checked downstream of the CPMA using an electric precipitator and a CPC. The charged particle
number concentration was found to be less than 5 cm-3, resulting in an effectively negligible error.
Mass concentration, size distribution, and optical properties of the particles classified based on their mass-to-charge ratio were measured simultaneously downstream of the CPMA. Mass concentration of the particles classified based on their mass-to-charge ratio was measured using a Faraday cup aerosol electrometer operated at a flowrate of 2 lpm. Extinction and scattering coefficients of particles were measured using a CAPS operated at a wavelength of 660 nm. The extinction measurement is based on cavity-attenuated phase shift (CAPS) technique, while scattering is measured using integrating nephelometry by incorporating a Lambertian integrating sphere within the sample cell. The precision of both extinction and scattering measurements is better than 1 Mm-1 (1s, 1�). CAPS-PMssa scattering was calibrated with non-absorbing polystyrene latex particles (PSLs) prior to the experiments. Measured extinction, � x , and scattering, � , coefficients were corrected for the actual pressure and temperature of the measuring cell using equation 1.
� x / = � ��� � x / , (1)
where � is the ambient pressure, � is 5 K above ambient temperature, and � and � are the pressure and temperature of the measuring cell.
Given that extinction is the sum of the absorption and scattering, mass-specific absorption cross section (MAC, m2 g-1), mass-specific scattering cross section (MSC, m2 g-1), and single
scattering albedo, � , can be calculated from Equations 2–4, respectively.
MAC =� = � x − � (2)
MSC =� (3)
� =MSC + MACMSC (4)
Where and � are the mass concentration and absorption coefficient of particles, respectively.
2.6 Effective density, and mass distributions
Effective density is an important parameter commonly used to correlated mass and mobility and aerodynamic diameters of a cluster. It can be determined by the following correlation,
= 6 �p
�m (5)
where �p and �m are the peak mass and peak mobility-equivalent diameter of the particles determined by CPMA and SMPS, respectively.
The mass of a particle is often found to scale with �m in a power-law relationship,
�p = �m�m (6)
where is a prefactor, and m is the mass-mobility exponent. Inserting equation (6) into equation (5), effective density can be correlated to the mass-mobility exponent by equation 7,
= ��m�m− (7)
where � is a prefactor.
Effective density measurements were made using a DMA, CPC, and CMPA configuration as shown in panel c of Figure 1. Particles were first classified based on their electrical mobility-equivalent diameter using a DMA column. Particles passing through the neutralizer obtain a charge distribution and larger particles carrying more than one elementary charge may have an electrical mobility similar to smaller particles carrying a single charge. As a result of this, a lower concentration of larger particles will also pass through the DMA and may reduce the accuracy of effective density measurements. In this work, multiple charging probability was greatly reduced by using a second neutralizer (soft-x-ray neutralizer, TSI Inc.) downstream of the DMA column [50]. Then particles were passed through the CPMA. Resolution of the CPMA was set between 3.15 and 8. This resolution is defined as the mass to charge ratio divided by the full width of the CPMA transfer function where the transmission efficiency is half the maximum value [51].
Using a CPMA-electrometer configuration (as shown in figure 1, panel c), mass-to-charge ratios can be converted to mass concentrations, which were used for the measurement of MAC
at each setting, it is important to measure the mass distributions of these classified particles and their corresponding median values. This median mass can be used in the representation of the measured MAC numbers at each mass-to-charge ratio.
A combination of size distribution and effective density measurement were used for the measurement of the mass distribution of the particles classified based on their mass-to-charge ratio. To this end, size distributions were measured by SMPS downstream of the CMPA, using the configuration shown in panel b of Figure 1.
Once size distributions and effective densities are measured, mass distributions can be calculated from a re-arranged version of equation 5 (� = �m/6).
3. Results and discussion
The inverted burner was run at both High EC and N2-diluted operating conditions. Three sets of
data were collected for effective density and optical properties at each operating condition.
3.1 Morphology and primary particle diameter
Approximately 45 images were produced for each test point. Diameters of the primary particles, �p, and projected area equivalent diameters of the aggregates, � , were measured for more than
90 particles at each operating condition.
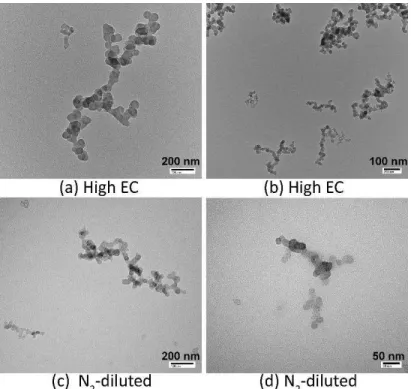
Typical TEM images produced for High EC and N2-diluted operating conditions (Figure 2) show
the structures typical of the soot produced in different combustion environments [32]. Qualitative observation of the TEM images shows higher coalescence and less clear boundaries between the primary particles at N2-diluted operating condition (Figure 2, panel d).
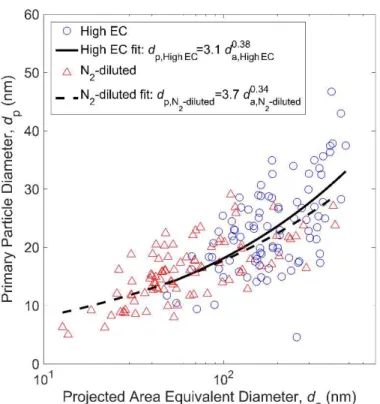
In Figure 3, the average primary particle diameter of individual aggregates (from TEM) is plotted against the projected-area equivalent diameter of each aggregate. Although the average primary particle diameter is smaller at the N2-diluted test point, it increases with � in both
operating conditions. First-order power law correlations were fitted to the measured data. Regression results show that the slopes of the fitted correlations are similar for both operating conditions. The variation of the primary particle size with aggregate size can also be observed in the sample TEM images shown in Figure 2. The observed correlation of �p with � is consistent with the results reported for different types of reciprocating engines [11,32,52] and a jet engine
[15,32,35]. The observed correlation suggests that the primary particles and aggregates are mainly formed in small zones where combustion conditions are relatively homogeneous; after formation and growth, aggregates from different regions, with different soot formation patterns and residence times, are mixed.
Figure 3: Primary particle diameter versus projected-area equivalent diameter of particles measured from TEM images.
3.2 Size distributions
To ensure the stability of the burner, size distributions were measured before and after the measurements of the effective density and optical properties. Inversion of the data collected by the SMPS to size distributions were performed by an in-house non-negative least squares
(NNLS) program. NNLS inversion algorithm uses a similar kernel function and results in similar mobility size distributions compared to TSI aerosol instrument manager (AIM) program [53,54]; however, it provides options for: (1) consideration of the variation of the primary particle
diameter with agglomerate size in the calculation of the surface area and mass distributions, and (2) application of the effective density results in the calculation of the mass distributions. Size distributions of the particles produced in both operating conditions are illustrated in Figure 4. As shown, particles produced at the High EC operating condition are larger than the N2-diluted test
point. Measured geometric mean mobility equivalent diameters are approximately 240 nm and 140 nm for High EC and N2-diluted operating conditions, respectively. As illustrated in Figure 4,
mobility distributions calculated by the non-negative least squares (NNLS) program are in agreement with the outputs of AIM software.
Figure 4: Size distributions obtained with NNLS compared to TSI AIM software.
3.3 Effective density
As discussed in the experimental section, a tandem-neutralizer configuration was used in order to reduce the multiple charging probability. Sample mass distributions of the mobility-classified particles measured with CPMA downstream of a single neutralizer are compared with those obtained with the application of tandem-neutralizer and NNLS predictions in the online
supplementary information (Figure SI.1, online supplementary information). Results presented here were obtained from the tandem-neutralizer configuration.
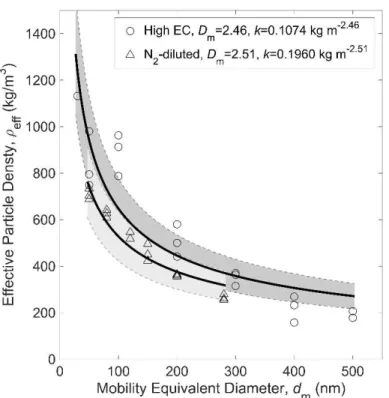
Results of the effective density measurements performed for High EC and N2-diluted operating
conditions are illustrated in Figure 5. As expected, effective density decreases with particle size in both operating conditions. This is due to the fact that the fractal particles incorporate more open space as they grow in size. Particles produced at the High EC operating condition have higher effective densities.
Conventional first-order power law correlations (Eq. 3) were fitted to the effective density data and mass-mobility exponents were calculated. The shaded region represents an uncertainty of ±20% in effective density. As illustrated in Figure 5, the power law regression overestimates the
effective densities of larger particles at the High EC operating condition. As an alternative, a second-order polynomial equation was fitted to the High EC effective density (Figure SI.2, online supplementary information). However, as discussed in section 3.5, application of either power law or polynomial regressions for the representation of the effective density has minor impacts on the results obtained for optical properties. Consequently, unless mentioned otherwise, power law correlations are used for the estimation of the effective density of both High EC and N2-diluted particles in the following sections.
Figure 5: Effective density versus diameter obtained for High EC and N2-diluted operating
conditions.
3.4 Median mass of particles of specific mass-to-charge ratio
As described in section 2.6, particles passing through the CMPA operated at different mass-to-charge ratios have a range of masses. A combination of effective density and size distributions were used to calculate the mass distribution of these classified particles. Inserting the effective density and size distribution results in equation (5), mass distributions of the particles produced at High EC and N2-diluted operating conditions were calculated with the non-negative least
mass-to-charge ratios of 0.32 (fg/C) and 0.08 (fg/C) are illustrated in Figure SI.3 (online supplementary information) for HighEC operating condition. Geometric standard deviation of the mass distributions of particles downstream of the CPMA are in the range of 1.5 to 1.9. Medians of the calculated mass distributions were calculated at each mass-to-charge ratio and were used as the representative of the masses of the classified particles. Variation of the calculated median mass with the mass-to-charge ratio setting of the CPMA is illustrated in Figure 6.
Figure 6: Variation of median mass with CPMA mass-to-charge ratio. The continuous lines are only eye guides.
As expected, median mass increases with mass-to-charge ratio; however, particles produced at the N2-diluted operating condition have higher mass at each mass-to-charge ratio set point of the
CPMA. Median number of the elementary charges at each mass-to-charge ratio setpoint of the CPMA is illustrated in Figure SI.4 (online supplementary information). As shown in Figure SI.4, N2-diluted particles gain higher number of elementary charges at each setpoint.
In a similar approach, size distributions of the unclassified particles (total emissions) were converted to mass distributions for both operating conditions. Median mass values of 3.6 fg and 0.5 fg were measured for the particulate emissions at High EC and N2-diluted operating
3.5 Mass-specific absorption cross section
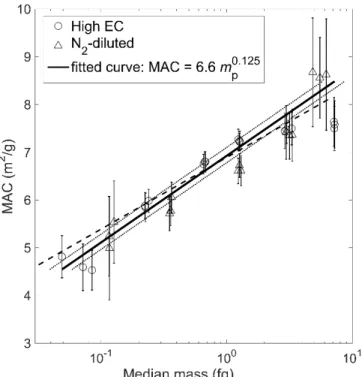
Mass-specific absorption cross sections were measured for different mass-to-charge ratios at High EC and N2-diluted operating conditions. The results in Figure 6 were then used to find the
median mass for each experiment (estimated mass distributions have a geometric standard deviation in the range of 1.5 to 1.9); MAC is plotted against the median mass in Figure 7. Standard deviations of the measured MAC values were calculated using the standard deviations of mass and absorption measurements. Large standard deviations at very small and very large masses are due to low concentrations of mass-classified particles which increases the
uncertainties of absorption and mass measurements.
Figure 7: MAC versus particle median mass. Error bars are the standard deviations of the MAC measurements. Dotted lines represent the influence of ±20% uncertainty in , when modelled by a power law correlation, on the MAC vs. particle mass results. Dashed line represents the best
fit of MAC vs. particle mass data when is modelled by a second order polynomial correlation.
Mass-specific absorption cross sections reported in literature for different fuels and combustion sources [5,18,20–22,25–31] are provided in Table 1. MAC values reported in literature are recalculated for the 660 nm wavelength, �, used in this study considering a �− dependence for
absorption. As shown, results obtained in this study are well within the range of the published data.
Our results show that the MAC values increase substantially with particle mass for both burner conditions. Considering this along with the correlation observed between the primary particle and aggregate diameters it may be speculated that the small and large particles have different nanostructure and may have different levels of graphitisation. This is consistent with the hypothesis that the aggregates are mainly formed in microscopic scales; after which particles with different formation, growth, and oxidation histories are mixed to form the ensemble
emissions. Interestingly, results obtained for both operating conditions follow a similar trend and can be represented by a single first order power law correlation (R2=0.89).
Table 1: Review of the MAC numbers reported in literature for different sources and different measurement techniques. MAC (m2/g) (nm) MAC (m2/g) at =660 nm Particle source
Bond & Bergstrom
(2006) 7.5±1.2 550 6.25±1.0
Review article: Averaged over 17 published measurements Schnaiter et al (2003) 5.2±0.3 700 5.52±0.31 Diesel Moosmüller et al. (2001) 8.47 532 6.83 Scherrer (1981) 9.05 550 7.54
Radney et al. (2014) 5.69±0.83 405 3.49±0.51 Santoro-style ethylene diffusion flame, contained high OC content Cross et al. (2010) 7.45 to
8.68 532 6.0-7.0
McKenna burner operated on ethylene premixed with O2 and N2
Zhang et al. (2008) 8.7 532 7.01 Santoro-type propane diffusion burner Schnaiter et al (2006) 5.5 550 4.58 CAST propane co-flow diffusion
flame, contained OC/TC=8.5±2.9% Horvath (1995) 10 550 8.33 Flame and Diesel engine Suo-Anttila et al.
(2005) - - 4.0
Resin cakes, Jet-A fuel, and suitcase burning (warehouse burning) Liu et al. (2005) 6.2 628 6.37 Simulation (mass=1.51 fg, �p=20 nm,
=1.8, � =1.19, m=1.75+0.435i) Wu et al. (2017) 6.5 550 5.42 Simulation (�p=40 nm, =1.8, =1.8
g/cm , p=100, m=1.95+0.79i)
Recent simulations of Wu et al. [31] have showed that the MAC number decreases slightly with the primary particle diameter (4% decrease in MAC with 66% increase in �p), assuming constant density and refractive index for particles of different sizes. Considering the trends illustrated in Figures 3 and 7, our results show substantial increase in MAC with �p. This may be attributed to different internal structures and/or graphitization levels for particles of different sizes, and cannot be explained by the effects considered by Wu et al [31].
The sensitivity of the results to effective density measurements was investigated with the
consideration of ±20% uncertainty in the first order power law correlations obtained for effective densities (dotted lines in Figure 7). Results obtained with the application of the second order polynomial correlation for effective density of High EC particles (dashed line) are also compared with those obtained with the utilization of the power law regression (continuous line) in Figure 7.
R2 of the regressions presented in Figure 7 are all greater than 0.82. As shown in this figure, the
observed increase of MAC with particle mass is not influenced substantially with the regression uncertainties for effective density.
Using the calculated first-order power law correlation between MAC and particle mass (��),
MAC = 6.6 ��. (where �� is in fg), mass distributions, obtained from combined size distribution and effective density information, were converted into MAC distributions; and arithmetic mean values of 7.5 (m2g-1) and 6.5 (m2g-1) (at �=660 nm) were calculated for High EC and N2-diluted operating conditions, respectively.
3.6 Mass-specific scattering and extinction cross sections
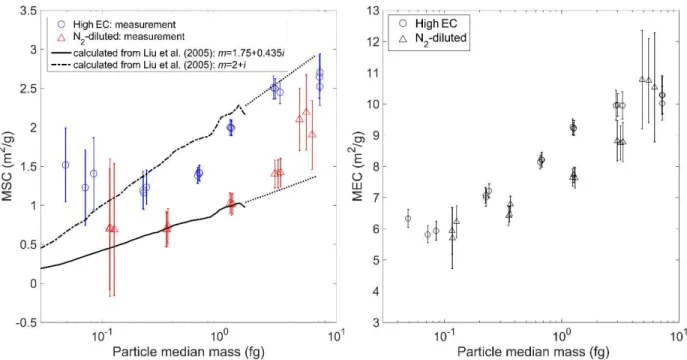
Mass-specific scattering and extinction cross sections measured at High EC and N2-diluted
operating conditions are plotted against the median mass values in Figure 8.
Continuous lines illustrated in this figure are calculated from the simulation results reported by Liu and Mishchenko (2005). In their study, variation of the MSC with the number of the primary particles, �, was calculated using the superposition T-matrix method. Fractal dimension, �, and prefactor, ��, of the agglomerates used in their simulations were 1.82 and 1.19, respectively. Their simulations were performed at a wavelength of 625 nm, ��=20 nm (approximately
consistent with the average monomer diameter in our study), and two refractive indexes of
m=1.75+0.435i and m=2+i. Here, � is converted to mass using the material density and primary
particle diameter considered in their simulations, and results are corrected for a wavelength of 660 nm considering �− dependence for scattering (Rayleigh–Debye–Gans theory [55]). It worth mentioning that the confirmation of our results with Liu and Mishchenko (2005) simulations does not necessarily mean that the particles produced at High EC and N2-diluted operating
Figure 8: Right panel: MSC results obtained from experiment compared with simulations. Dotted lines are extrapolation of the modeling data to larger mass. Left panel: MEC results vs. particle
mass.
A summary of the MSC values reported in literature for different fuels and combustion sources [18,22,30,56] is provided in Table 2. As shown here, results obtained in this study are well within the range of the published data.
Results illustrated in Figure 8 show that the particles produced at High EC operating condition have higher MSC. Both modeling and experiment show an increase in MSC with particle mass. This is mainly due to the increase in the number of the monomers as the scattering cross section varies with � while the particle mass varies with �. Standard deviations of the measured MSC is considerably larger at very small mass. This is due to the low concentration and weak
scattering signal at these measurement points. This suggests that the increase observed in MSC for smaller particle mass may be an artifact of the measurement uncertainties.
Considering the MEC results illustrated in Figure 8 (right panel), in an extreme case MSC should increase from approximately zero to 5 in order to obtain a constant MAC over the whole range of the mass distribution; which is impossible.
Table 2: Review of the MSC values reported in literature for different sources and different measurement techniques. MSC (m2/g) (nm) MSC (m2/g) at =660 nm Particle source Perera et al. (2011) 5.5 520 2.12 Diesel Schnaiter et al (2003) 0.8±0.2 700 1.01±0.25 Diesel
Suo-Anttila et al.
(2005) - - 1.5
Resin cakes, Jet-A fuel, and suitcase (warehouse burning) Radney et al. (2014) 6.51 405 0.92 Santoro-style ethylene diffusion
flame, contained high OC content
3.7 Single scattering albedo
Results obtained for the single scattering albedo at High EC and N2-diluted operating conditions
are plotted in Figure 9. Similar to MSC, measurement uncertainties increase substantially at small mass. Summary of the values reported for single scattering albedo in the literature for different fuels and combustion sources [18,20,22,28,29,57–59] is also provided in Table 3. As shown in this table, values measured here at �=660 nm are within the range of 0.15 to 0.3 reported in literature for the wavelengths in the range of 532 nm to 700 nm. As expected, the albedo increases with particle size, but at a rate that is decreased by the increasing MAC values.
Figure 9: Single scattering albedo versus mass
Table 3: Review of the single scattering albedos reported in literature for different sources and measurement techniques. � (nm) Particle source Scherrer (1981) 0.17±0.05 550 Diesel Colbeck et al. (1997) 0.3 632 Schnaiter et al. (2003) 0.17±0.01 700 Mulholland (1998) 0.19 & 0.25 633
Laminar & turbulent acetylene and ethylene flames
Schnaiter et al (2006) 0.22±0.01 700 CAST co-flow propane diffusion flame, contained ~30% OC
Zhang et al. (2008) 0.1 532 Santoro-type propane diffusion burner Radney et al. 2014 0.5±0.03 405 Santoro-style ethylene diffusion flame,
contained high OC content Kim et al. 2015 0.7 530 miniCAST propane diffusion flame,
contained EC/TC=0.77 Colbeck et al. (1989) 0.28±0.25 632 LPG combustion
Liu et al. (2005) 0.15 628 Simulation (mass=1.51 fg, �p=20 nm, =1.8, � =1.19, m=1.75+0.435i)
3.8 Raman spectroscopy
Average Raman spectra was normalized by the peak of the D bands. Normalized average Raman spectra of the size-classified soot particles collected from the High EC operating condition of the inverted burner and corresponding four Lorentzian- and one Gaussian-shaped fitted bands are illustrated in Figures SI.5 to SI.7 (online supplementary information). The average intensities of the fitted bands (I) were characterized by the area under each individual band. These average intensities and the ratios of the average intensities of the individual D bands to the average intensity of the G band are reported in Table 4. These ratios are commonly used to separate the contribution of each band to the total spectrum.
Table 4: Average intensities of the individual bands and their ratios for High EC soot. �m=125 nm (�p=0.75 fg) �m=250 nm (�p=3.63 fg) �m=300 nm (�p=5.06 fg) I(D1) 260.λ7 246.4λ 274.33 I(D2) 35.0λ 31.0λ 38.14 I(D3) 50.80 45.77 31.30 I(D4) 31.12 41.56 28.22 I(G) 24.4λ 33.87 43.70 I(D1)/I(G) 10.66 7.28 6.28 I(D2)/I(G) 1.43 0.λ2 0.87 I(D3)/I(G) 2.07 1.35 0.72 I(D4)/I(G) 1.27 1.23 0.65
As shown in Table 4, the ratio of average intensities of all D bands to the G band decrease
substantially with the particle size. G band represents crystalline graphitic structures consisted of sp2-bonded carbon atoms in unreactive basal planes, while D1 band represents defects occurring at the edge planes of the graphitic crystallites. The structural disorder associated with the PAH layers at the boundaries of the crystallites are represented by the D2 band [60]. I(D1)/I(G) is correlated with the edge-to-volume ratio of the graphite crystallites, while I(D2)/I(G) is correlated to the surface area-to-volume ratio of the graphitic crystallites.
D4 band originates from carbon atoms with sp3 and mixed sp2-sp3 hybridization states (possibly caused by curved PAH layers in graphitic crystallites). Considering this, smaller values of
I(D4)/I(G) for larger particles indicate higher levels of graphitization and higher concentration of
sp2-hybridized carbon atoms. The origin of the D4 band is also sometimes considered to be from the single carbon-carbon bonds in polyacetylene-like structures [61]. In that case, smaller values of I(D4)/I(G), indicate a lower concentration of polyacetylene compounds in larger particles. Finally, the sources of the D3 band are amorphous carbon (complex mixtures of sp2- and sp3 -bonded carbon atoms with no order) and ionic impurities. Therefore, smaller values of
I(D3)/I(G) indicate that the larger particles are less amorphous. Considering the Raman
spectroscopy results, it can be concluded that the larger aggregates are more graphitic and have a higher level of structural order compared to the smaller particles. This is consistent with the observation of higher MAC numbers for larger soot particles.
4. Conclusions
Based on measurements of optical properties of mass-classified soot particles produced by an inverted burner, there is a correlation between mass-specific absorption cross section and particle mass. It was shown that the MAC increases substantially with particle mass. This is consistent with the measurements of increased graphitization and structural orders for larger soot particles by Raman spectroscopy. Moreover, analysis of the samples collected for ex-situ transmission electron microscopy also show an increase in primary particle diameter with the projected-area equivalent diameter of the soot particles. Measured single scattering albedo was also increased with particle mass.
Variations in primary particle diameter, MAC, and Raman intensities are consistent with the previously proposed hypothesis based on which aggregates are formed in relatively
homogeneous microscopic regions; after which particles with different formation, growth, and oxidation histories are mixed and formed the total emission. These results suggest that the particles formed in a single operating condition may have experienced different graphitization processes and have differences in their nanostructure and/or fringe morphology. The fact that we see evidence of these variations in post-flame samples may result from diluting the samples near the flame, reducing coagulation that would result (given enough time) uniform optical properties across all aggregate size. The conditions investigated in our work are not universal, but they are
not atypical. It has been previously shown that the size of the primary particles is correlated to the size of the soot aggregates in several combustion sources [32]. Similar to what was studied here, this size correlation may be an indication of different optical properties for those sources. Further investigation of similar properties is suggested for other heterogeneous and also homogeneous combustion environments.
According to the results discussed here, it is not appropriate to assume that all aggregates formed in a combustion environment have the same optical properties. Consideration of the observed variations in optical properties of soot is essential in accurate estimation of the emission rates, specially using optical methods. Accuracy of the climate models would also be enhanced with the consideration of these variation.
Acknowledgments
We thankfully acknowledge the support of Dr. Li-Lin Tay, Measurement Science and Standards at National Research Council of Canada, for obtaining the Raman spectra used in this study.
Appendix A. Supplemental material
Supplemental data for this article can be accessed on the publisher’s website.
References
[1] X. Chen, Y. Sun, Q. Zhao, X. Song, W. Huang, Y. Han, J. Shang, T. Zhu, A. Wu, S. Luan, Design and characterization of human exposure to generated sulfate and soot particles in a pilot chamber study., J. Air Waste Manag. Assoc. 66 (2016) 366–76.
doi:10.1080/10962247.2015.1136712.
[2] M.Z. Jacobson, Short-term effects of controlling fossil-fuel soot, biofuel soot and gases, and methane on climate, Arctic ice, and air pollution health, Geophys. Res. 115 (2010) D14209. doi:10.1029/2009JD013795.
[3] V. Ramanathan, G. Carmichael, Global and regional climate changes due to black carbon, Nat. Geosci. 1 (2008) 221–227. doi:10.1038/ngeo156.
[4] P. a. Bueno, D.K. Havey, G.W. Mulholland, J.T. Hodges, K. a. Gillis, R.R. Dickerson, M.R. Zachariah, Photoacoustic Measurements of Amplification of the Absorption Cross
Section for Coated Soot Aerosols, Aerosol Sci. Technol. 45 (2011) 1217–1230. doi:10.1080/02786826.2011.587477.
[5] T.C. Bond, R.W. Bergstrom, Light Absorption by Carbonaceous Particles: An Investigative Review, Aerosol Sci. Technol. 40 (2006) 27–67.
doi:10.1080/02786820500421521.
[6] M. Sato, J. Hansen, D. Koch, A. Lacis, R. Ruedy, O. Dubovik, B. Holben, M. Chin, T. Novakov, Global atmospheric black carbon inferred from AERONET., Proc. Natl. Acad. Sci. U. S. A. 100 (2003) 6319–24. doi:10.1073/pnas.0731897100.
[7] M.Z. Jacobson, Strong radiative heating due to the mixing state of black carbon in atmospheric aerosols., Nature. 409 (2001) 695–7. doi:10.1038/35055518.
[8] W.F. Cooke, J.J.N. Wilson, A global black carbon aerosol model, J. Geophys. Res. Atmos. 101 (1996) 19395–19409. doi:10.1029/96JD00671.
[9] H. Saathoff, K.-H. Naumann, M. Schnaiter, W. Schöck, E. Weingartner, U. Baltensperger, L. Krämer, Z. Bozoki, U. Pöschl, R. Niessner, U. Schurath, Carbon mass determinations during the AIDA soot aerosol campaign 1999, J. Aerosol Sci. 34 (2003) 1399–1420. doi:10.1016/S0021-8502(03)00365-3.
[10] M.M. Maricq, N. Xu, The effective density and fractal dimension of soot particles from premixed flames and motor vehicle exhaust, J. Aerosol Sci. 35 (2004) 1251–1274. doi:10.1016/j.jaerosci.2004.05.002.
[11] B. Graves, J. Olfert, B. Patychuk, R. Dastanpour, S. Rogak, Characterization of Particulate Matter Morphology and Volatility from a Compression-Ignition Natural-Gas Direct-Injection Engine, Aerosol Sci. Technol. 49 (2015) 589–598.
doi:10.1080/02786826.2015.1050482.
[12] R. Dastanpour, S.N. Rogak, B. Graves, J. Olfert, M.L. Eggersdorfer, A.M. Boies, Improved sizing of soot primary particles using mass-mobility measurements, Aerosol Sci. Technol. 50 (2015) 101–109. doi:10.1080/02786826.2015.1130796.
morphology and mobility diameter of the fractal agglomerates in different flow regimes, J. Aerosol Sci. 94 (2016) 22–32. doi:10.1016/j.jaerosci.2015.12.005.
[14] T. Thajudeen, S. Jeon, C.J. Hogan Jr, The mobilities of flame synthesized
aggregates/agglomerates in the transition regime, J. Aerosol Sci. 80 (2015) 45–57. doi:10.1016/j.jaerosci.2014.11.003.
[15] A.M. Boies, M.E.J. Stettler, J.J. Swanson, T.J. Johnson, J.S. Olfert, M. Johnson, M.L. Eggersdorfer, T. Rindlisbacher, J. Wang, K. Thomson, G. Smallwood, Y. Sevcenco, D. Walters, P.I. Williams, J. Corbin, A.A. Mensah, J. Symonds, R. Dastanpour, S.N. Rogak, Particle Emission Characteristics of a Gas Turbine with a Double Annular Combustor, Aerosol Sci. Technol. 49 (2015) 842–855. doi:10.1080/02786826.2015.1078452. [16] M. Abegglen, L. Durdina, B.T. Brem, J. Wang, T. Rindlisbacher, J.C. Corbin, U.
Lohmann, B. Sierau, Effective density and mass–mobility exponents of particulate matter in aircraft turbine exhaust: Dependence on engine thrust and particle size, J. Aerosol Sci. 88 (2015) 135–147. doi:10.1016/j.jaerosci.2015.06.003.
[17] M.M. Maricq, D.H. Podsiadlik, R.E. Chase, Size Distributions of Motor Vehicle Exhaust PM: A Comparison Between ELPI and SMPS Measurements, Aerosol Sci. Technol. 33 (2000) 239–260. doi:10.1080/027868200416231.
[18] M. Schnaiter, H. Horvath, O. Möhler, K.-H.H. Naumann, H. Saathoff, O.W.W. Schöck, UV-VIS-NIR spectral optical properties of soot and soot-containing aerosols, J. Aerosol Sci. 34 (2003) 1421–1444. doi:10.1016/S0021-8502(03)00361-6.
[19] J.G. Slowik, E.S. Cross, J.-H. Han, J. Kolucki, P. Davidovits, L.R. Williams, T.B. Onasch, J.T. Jayne, C.E. Kolb, D.R. Worsnop, Measurements of Morphology Changes of Fractal Soot Particles using Coating and Denuding Experiments: Implications for Optical Absorption and Atmospheric Lifetime, Aerosol Sci. Technol. 41 (2007) 734–750. doi:10.1080/02786820701432632.
[20] R. Zhang, A.F. Khalizov, J. Pagels, D. Zhang, H. Xue, P.H. McMurry, Variability in morphology, hygroscopicity, and optical properties of soot aerosols during atmospheric processing., Proc. Natl. Acad. Sci. U. S. A. 105 (2008) 10291–10296.
doi:10.1073/pnas.0804860105.
[21] E.S. Cross, T.B. Onasch, A. Ahern, W. Wrobel, J.G. Slowik, J. Olfert, D. a. Lack, P. Massoli, C.D. Cappa, J.P. Schwarz, J.R. Spackman, D.W. Fahey, A. Sedlacek, A.
Trimborn, J.T. Jayne, A. Freedman, L.R. Williams, N.L. Ng, C. Mazzoleni, M. Dubey, B. Brem, G. Kok, R. Subramanian, S. Freitag, A. Clarke, D. Thornhill, L.C. Marr, C.E. Kolb, D.R. Worsnop, P. Davidovits, Soot Particle Studies—Instrument Inter-Comparison— Project Overview, Aerosol Sci. Technol. 44 (2010) 592–611.
doi:10.1080/02786826.2010.482113.
[22] J.G. Radney, R. You, X. Ma, J.M. Conny, M.R. Zachariah, J.T. Hodges, C.D. Zangmeister, Dependence of soot optical properties on particle morphology:
measurements and model comparisons., Environ. Sci. Technol. 48 (2014) 3169–76. doi:10.1021/es4041804.
[23] G.W. Mulholland, C.F. Bohren, K.A. Fuller, Light Scattering by Agglomerates: Coupled Electric and Magnetic Dipole Method, Langmuir. 10 (1994) 2533–2546.
doi:10.1021/la00020a009.
[24] G.W. Mulholland, L. Zhou, M.R. Zachariah, W.R. Heinson, A. Chakrabarti, C. Sorensen, Light Scattering Shape Diagnostics for Nano-Agglomerates, Aerosol Sci. Technol. 47 (2013) 520–529. doi:10.1080/02786826.2013.767435.
[25] H. Moosmüller, W.P. Arnott, C.F. Rogers, J.L. Bowen, J.A. Gillies, W.R. Pierson, J.F. Collins, T.D. Durbin, J.M. Norbeck, Time-resolved characterization of diesel particulate emissions. 2. Instruments for elemental and organic carbon measurements, Environ. Sci. Technol. 35 (2001) 1935–1942. doi:10.1021/es0015242.
[26] M. Schnaiter, M. Gimmler, I. Llamas, C. Linke, C. Jäger, H. Mutschke, Strong spectral dependence of light absorption by organic carbon particles formed by propane
combustion, Atmos. Chem. Phys. Discuss. 6 (2006) 1841–1866. doi:10.5194/acpd-6-1841-2006.
[27] H. Horvath, Size segregated light absorption coefficient of the atmospheric aerosol, Atmos. Environ. 29 (1995) 875–883. doi:10.1016/1352-2310(95)00025-T.
[28] H.C. Scherrer, D.B. Kittelson, D.F. Dolan, Light Absorption Measurements of Diesel Particulate Matter, in: 1981. doi:10.4271/810181.
[29] L. Liu, M.I. Mishchenko, Effects of aggregation on scattering and radiative properties of soot aerosols, Geophys. Res. 110 (2005) D11211. doi:10.1029/2004JD005649.
[30] J. Suo-Anttila, W. Gill, L. Gritzo, D. Blake, An evaluation of actual and simulated smoke properties, Fire Mater. 29 (2005) 91–107. doi:10.1002/fam.875.
[31] Y. Wu, T. Cheng, L. Zheng, H. Chen, Sensitivity of mixing states on optical properties of fresh secondary organic carbon aerosols, J. Quant. Spectrosc. Radiat. Transf. (2017) 1–9. doi:10.1016/j.jqsrt.2017.01.013.
[32] R. Dastanpour, S.N. Rogak, Observations of a correlation between primary particle and aggregate size for soot particles, Aerosol Sci. Technol. 48 (2014) 1043–1049.
doi:10.1080/02786826.2014.955565.
[33] T.L. Barone, J.M.E. Storey, A.D. Youngquist, J.P. Szybist, An analysis of direct-injection spark-ignition (DISI) soot morphology, Atmos. Environ. 49 (2012) 268–274.
doi:10.1016/j.atmosenv.2011.11.047.
[34] K.O. Lee, H. Seong, S. Sakai, M. Hageman, D. Rothamer, Detailed Morphological
Properties of Nanoparticles from Gasoline Direct Injection Engine Combustion of Ethanol Blends, (2013). doi:10.4271/2013-24-0185.
[35] T.J. Johnson, J.S. Olfert, J.P.R. Symonds, M. Johnson, T. Rindlisbacher, J.J. Swanson, A.M. Boies, K. Thomson, G. Smallwood, D. Walters, Y. Sevcenco, A. Crayford, R. Dastanpour, S.N. Rogak, L. Durdina, Y.K. Bahk, B. Brem, J. Wang, Effective Density and Mass-Mobility Exponent of Aircraft Turbine Particulate Matter, J. Propuls. Power. 31 (2015) 573–582. doi:10.2514/1.B35367.
[36] C.B. Stipe, B.S. Higgins, D. Lucas, C.P. Koshland, R.F. Sawyer, Inverted co-flow diffusion flame for producing soot, Rev. Sci. Instrum. 76 (2005) 23908.
doi:10.1063/1.1851492.
diffusion flame and applications in evaluating black carbon measurement methods, Atmos. Environ. 41 (2007) 1874–1888. doi:10.1016/j.atmosenv.2006.10.067.
[38] A.R. Coderre, K.A. Thomson, D.R. Snelling, M.R. Johnson, Spectrally resolved light absorption properties of cooled soot from a methane flame, Appl. Phys. B. 104 (2011) 175–188. doi:10.1007/s00340-011-4448-9.
[39] R.K. Chakrabarty, H. Moosmüller, M.A. Garro, C.B. Stipe, Observation of
Superaggregates from a Reversed Gravity Low-Sooting Flame, Aerosol Sci. Technol. 46 (2012) i–iii. doi:10.1080/02786826.2011.608389.
[40] A. D6877-13e1, Standard Test Method for Monitoring Diesel Particulate Exhaust in the Workplace, ASTM Int. (2013). doi:10.1520/D6877.
[41] A. Miller, G. Frey, G. King, C. Sunderman, A Handheld Electrostatic Precipitator for Sampling Airborne Particles and Nanoparticles, Aerosol Sci. Technol. 44 (2010) 417–427. doi:10.1080/02786821003692063.
[42] R. Dastanpour, J.M. Boone, S.N. Rogak, Automated primary particle sizing of
nanoparticle aggregates by TEM image analysis, Powder Technol. 295 (2016) 218–224. doi:10.1016/j.powtec.2016.03.027.
[43] A. Cuesta, P. Dhamelincourt, J. Laureyns, A. Martínez-Alonso, J.M.D. Tascón, Raman microprobe studies on carbon materials, Carbon N. Y. 32 (1994) 1523–1532.
doi:10.1016/0008-6223(94)90148-1.
[44] A. Sadezky, H. Muckenhuber, H. Grothe, R. Niessner, U. Pöschl, Raman
microspectroscopy of soot and related carbonaceous materials: Spectral analysis and structural information, Carbon N. Y. 43 (2005) 1731–1742.
doi:10.1016/j.carbon.2005.02.018.
[45] M. Saffaripour, L.-L. Tay, K.A. Thomson, G.J. Smallwood, B.T. Brem, L. Durdina, M. Johnson, Raman spectroscopy and TEM characterization of solid particulate matter emitted from soot generators and aircraft turbine engines, Aerosol Sci. Technol. (2016) 1– 14. doi:10.1080/02786826.2016.1274368.
[46] G. Biskos, K. Reavell, N. Collings, Unipolar diffusion charging of aerosol particles in the transition regime, J. Aerosol Sci. 36 (2005) 247–265. doi:10.1016/j.jaerosci.2004.09.002. [47] J.S. Olfert, N. Collings, New method for particle mass classification—the Couette
centrifugal particle mass analyzer, J. Aerosol Sci. 36 (2005) 1338–1352. doi:10.1016/j.jaerosci.2005.03.006.
[48] J.P.R. Symonds, K.S.J. Reavell, J.S. Olfert, The CPMA-Electrometer System—A Suspended Particle Mass Concentration Standard, Aerosol Sci. Technol. 47 (2013) i–iv. doi:10.1080/02786826.2013.801547.
[49] M. Dickau, T. J. Johnson, K. Thomson, G. Smallwood, J. S. Olfert, Demonstration of the CPMA-Electrometer System for Calibrating Black Carbon Particulate Mass Instruments, Aerosol Sci. Technol. 49 (2015) 152–158. doi:10.1080/02786826.2015.1010033.
[50] J.G. Radney, C.D. Zangmeister, Practical limitations of aerosol separation by a tandem differential mobility analyzer?aerosol particle mass analyzer, Aerosol Sci. Technol. 50 (2016) 160–172. doi:10.1080/02786826.2015.1136733.
[51] P. Kulkarni, P.A. Baron, W. Klaus, Aerosol measurement: principles, techniques, and applications, John Wiley & Sons, 2011.
[52] B. Graves, R. Dastanpour, S. Rogak, P. Mireault, M. Ramos, J.S. Olfert, Morphology of Particles Emitted from a GDI Engine Fuelled on Gasoline and Ethanol Blends, in: 32nd Annu. Am. Assoc. Aerosol Res. Conf., Portland, Oregon, 2013.
[53] R.C. Flagan, Differential Mobility Analysis of Aerosols μ A Tutorial, KONA Powder Part. 26 (2008) 254–268.
[54] S.C. Wang, R.C. Flagan, Scanning Electrical Mobility Spectrometer, Aerosol Sci. Technol. 13 (1990) 230–240. doi:10.1080/02786829008959441.
[55] C.M. Sorensen, Light scattering by fractal aggregates: a review, Aerosol Sci. Technol. 35 (2001) 648–687. doi:10.1080/02786820117868.
Smoke Particles Produced from both Flaming and Non-Flaming Combustion of Common Mine Combustibles, Fire Saf. Sci. 10 (2011) 213–226. doi:10.3801/IAFSS.FSS.10-213. [57] I. Colbeck, B. Atkinson, Y. Johar, The morphology and optical properties of soot
produced by different fuels, J. Aerosol Sci. 28 (1997) 715–723. doi:10.1016/S0021-8502(96)00466-1.
[58] J. Kim, H. Bauer, T. Dobovičnik, R. Hitzenberger, D. Lottin, D. Ferry, A. Petzold, Assessing Optical Properties and Refractive Index of Combustion Aerosol Particles Through Combined Experimental and Modeling Studies, Aerosol Sci. Technol. 49 (2015) 340–350. doi:10.1080/02786826.2015.1020996.
[59] I. Colbeck, E.J. Hardman, R.M. Harrison, Optical and dynamical properties of fractal clusters of carbonaceous smoke, J. Aerosol Sci. 20 (1989) 765–774. doi:10.1016/0021-8502(89)90088-8.
[60] M.S. Dresselhaus, G. Dresselhaus, Light scattering in graphite intercalation compounds, in: Springer Berlin Heidelberg, 1982: pp. 3–57. doi:10.1007/3540115137_2.
[61] T. López-Ríos, É. Sandré, S. Leclercq, É. Sauvain, Polyacetylene in Diamond Films Evidenced by Surface Enhanced Raman Scattering, Phys. Rev. Lett. 76 (1996) 4935– 4938. doi:10.1103/PhysRevLett.76.4935.