HAL Id: hal-01064949
https://hal.archives-ouvertes.fr/hal-01064949
Submitted on 18 Sep 2014
HAL is a multi-disciplinary open access archive for the deposit and dissemination of sci-entific research documents, whether they are pub-lished or not. The documents may come from teaching and research institutions in France or abroad, or from public or private research centers.
L’archive ouverte pluridisciplinaire HAL, est destinée au dépôt et à la diffusion de documents scientifiques de niveau recherche, publiés ou non, émanant des établissements d’enseignement et de recherche français ou étrangers, des laboratoires publics ou privés.
A tool to evaluate the impacts of an innovation on a
product’s recyclability rate by adopting a modular
approach: automotive sector application
Julien Garcia, Dominique Millet, Pierre Tonnelier
To cite this version:
Julien Garcia, Dominique Millet, Pierre Tonnelier. A tool to evaluate the impacts of an innovation on a product’s recyclability rate by adopting a modular approach: automotive sector application. International Journal of Vehicle Design, Inderscience, 2015, 2015 (1), pp.1-18. �hal-01064949�
A tool to evaluate the impacts of an innovation on
a product’s
recyclability rate by adopting a modular point of view: application to
the automotive sector
Julien Garcia
PSA Peugeot Citroën, Centre technique de Vélizy, VV009, route de Gizy,78140 Vélizy Villacoublay, France E-mail: [email protected]
Dominique Millet
SEATECH/SUPMECA-Université de Toulon, avenue de l’Université,
BP 20132, 83957 La Garde Cedex, France E-mail: [email protected]
Pierre Tonnelier
PSA Peugeot Citroën, Centre technique de Vélizy, VV009, route de Gizy,78140 Vélizy Villacoublay, France E-mail: [email protected]
Keywords
Recyclability; Recoverability; Evaluation tool; Impact of an Innovation; Modular point of view; Preventive tool; Tendency of the impact; Simplifying assumption; Management of the end-of-life options; Hybrid motorization
Abstract.
While the European regulation on the end-of-life vehicle is more and more strict, the introduction of innovations makes the material composition of vehicles evolve and can lead to a risk for approval on the recoverability of the vehicle. We set up a preventive tool named OSIRIS to evaluate the impact of an innovation on the recyclability rate of a vehicle. The innovation teams and the vehicle project leaders may obtain a tendency of this impact. It is supported 1) by a modular point of view of the vehicle, 2) by a simplifying assumption for fixing a module, and 3) on a management of the end-of-life options. By testing this approach on a hybrid motorization, we show that the uncertainty resulting from the simplifying hypothesis is less than 0.20% when the initial and innovative solutions have a mass difference less than 40-60 kg.
1 Context
Since the end of the 90’s, the car has become one of the most regulated products, for example on pollutants (European Parliament, Council, 2007) and carbon dioxide emissions (European Parliament, Council, 2009) during the use. The analysis of (Schipper, 2011) shows that, since the 80’s, in spite of the reduction of fuel consumption relative to the vehicle mass, the vehicle mass and power have never
Schipper, reversing the curve of vehicle mass is impossible to circumvent in order to reduce fuel consumption.
Thus, to answer the regulations on emissions during use, the innovations by car manufacturers are mainly related to the effectiveness of the drivetrains and vehicle lightening. New technologies and new materials are introduced, and the material composition of the vehicles evolves.
In parallel, the EU law forces manufacturers to prove that the vehicles put on the market reach at least 95% in mass of recoverability or re-use including at least 85% of material recoverability, i.e. of recyclability, or re-use. Until now, the bill of material of the vehicles has evolved little. However, the introduction of innovations such as hybrid motorization or composites makes the material composition of the vehicles evolve, and can lead to a risk for approval on the recoverability of the vehicle. The challenge to reach the lawful target rates is all the more difficult as the recycling system is not ready to receive all the innovations (Sutherland et al., 2004). There thus exists a regulatory risk on the recyclability of the vehicles. It appears necessary to evaluate this risk. The action upstream of the design process must be privileged: although there is little information about the product, the potential for improvement and the degrees of freedom are more important. Moreover, the structures in charge of innovations for car manufacturers are completely detached from the development projects of vehicles (Buet, Gidel and Millet, 2010); the constraints are less strong than in vehicle projects.
The objective is to present the tool OSIRIS (Simulation Tool of the Impact on Recyclability of Innovations) making it possible to evaluate, during the innovation process, the impact of an innovation on the recyclability of a vehicle. In the first part, we develop the European lawful context on the recyclability and the existing evaluation methods; we thus present the calculation method which we employ to calculate these rates. In the second part, we expose the context of the innovation in a car manufacturer and the constraints of the tool. The formalism of the tool OSIRIS and the experimental protocol are described in the third part. In the fourth part, we present the results of the three experiments. Lastly, a conclusion and prospects conclude this article.
2 European regulation on the recyclability of the vehicles
In Europe, vehicle recyclability is managed by the European directives 2000/53/EC (European Parliament, Council, 2000) and 2005/64/EC (European Parliament, Council, 2005). The first one defines the objectives to be reached in 2015 which are of at least 95% in mass of recoverability or re-use, including at least 85% of material recoverability (recyclability) or of re-use. Re-use is defined by the directive as following: “any operation by which components of end-of-life vehicles are used for the
same purpose for which they were conceived”. Therefore, that opens the research field linked with the Design for Remanufacturing which notably allows to reduce the environmental impacts of the
manufacturing (Pigosso et al., 2010), (Nasr and Thurston, 2006), (Warsen, Laumer and Momberg, 2011).
The second forces manufacturers to approve their vehicles on recyclability and recoverability. To do so, the calculation method retained by the EU is defined by the international standard 22628 (ISO, 2002). It is based on the treatment steps of an end-of-life (EoL) vehicle (Table 1).
Table 1. Definition of the recycled and energy recovered masses for each treatment step of an EoL vehicle.
Treatment steps of an EoL vehicle (mass mV)
Masses EoL scenario Targets
Pre-treatment, depollution mP Recycling or re-use (100%) 85%
recyclability or re-use
95% recovery or re-use
Dismantling mD Recycling or re-use (100%)
Metal separation mM Recycling or re-use (100%)
Treatment of non-metallic residual mTr Recycling or re-use (100%)
The recyclability ( ) (Eq. 1) and recoverability ( ) (Eq. 2) rates are calculated in the following way: (1) (2)
This calculation method needs a description as high as possible of the material distribution of the vehicle to certify. The standard ISO 22628 forces a list of elements for treatment operations for depollution and a first description of the material distribution of a vehicle (Table 2).
Table 2. Pre-treatment elements and material distribution Pre-treatment elements Material distribution All fluids
Batteries Oil filters
Liquefied Petroleum Gas (LPG) tanks Compressed Natural Gas (CNG) Tanks Tires
Catalytic converters
Metals
Polymers (excluding elastomers) Elastomers
Glass Fluids
Modified Organic Natural Materials (MONM) Others
The metals are separated for the recycling of the metallic fraction ( ). The organic fraction may be either recycled ( ) or used to produce energy ( ). The masses of the dismantling ( ) and non-metallic residual treatment steps ( ) are the degrees of freedom of the system, they are free parameters that depend on the EoL strategy defined by the car manufacturer. Therefore, each manufacturer has its own portfolio of EoL scenarios. For example, in their study on the influence of the EoL scenarios on the life cycle assessment of a vehicle, (Ciacci et al., 2010) propose five scenarios. Nevertheless, this scenario portfolio must be justified from the standard ISO 22628 point of view. Therefore, a scenario by default may be built when the free parameters are all nulls:
.
Thereafter, the manufacturer must go deeper in this material distribution to make EoL scenarios in order to reach the lawful recyclability and recoverability rates by varying the free parameters. In practice an expertise in recycling systems is required in order to determine common practices of the sector and to release the good practices. Currently the data collect to get the material distribution of a vehicle may take several months, while the data consolidation and the calculation of recyclability and recoverability rates may take about one week.
This calculation method is not representative of the practice. (Reuter et al., 2006) have made an optimization model of the recycling system that takes into account several parameters that affects the efficiency of physical separation. Table 3 gives the recycling rates of several metals according to the model of Reuter et al. In addition, material recycling is the object of many studies in order to improve their recoverability e.g. those on polymers (Weager et al., 2007), on composites (Perry et al., 2012), (Yang et al., 2012) or on aluminum (Gaustad, Olivetti and Kirchain, 2012). These materials are used more and more in the automotive sector. Other studies focus on the treatments of the shredder residues and their improvements (Fiore, Ruffino and Zanetti, 2012), (Passarini et al., 2012), (Zorpas and Inglezakis, 2012).
Table 3. Recyclability rates of several metals according to the optimization model of the recycling system from (Reuter et al., 2006).
Metals Recyclability rate Aluminum 78%
Magnesium 16%
Steel 99%
Zinc 79%
Therefore all the masses of Eqs. (1) and (2) should be weighted with a coefficient of efficiency αelement or material as represented in the following Eq. (3) for the recyclability rate:
(3)
The primary goal of this work is to guarantee the homologation on the recyclability of the vehicles. Although the standard ISO 22628 is not representative of the reality, it is only the reflection of a potential of recycling (the recyclability). Thus, in this paper, we consider the end-of-life options of the vehicle matters and elements with all the coefficients of efficiency α equal to 1. Moreover, we use the PSA strategy that gives priority to the recycling of polypropylene (PP) and polyethylene (PE), as described in Table 4.
Table 4. EoL options used in this paper.
Recycling or re-use rates Energy recovery
Pretreatment 100% 0%
Metals 100% 0%
Polymers (excluding PP/PE) 0% 100%
PP/PE 100% 0%
MONM 0% 100%
Mineral matter 0% 0%
Others 0% 0%
3 Key questions
3.1 The structure for designing vehicles
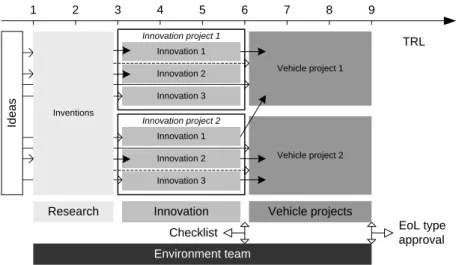
The design process at PSA is defined according to the TRL scale (Technology Readiness Level) (Mankins, 2009) and has three phases: research, innovation, and vehicle projects (Figure 1). The research phase identifies the inventions that may be suitable to the automotive sector. During the innovation phase, they are selected, brought to maturity, and prepared to be connected to a vehicle project. An innovation project leader proposes a collection of innovations to a vehicle project leader who decides to take all or part of the collection. We can notice that some ideas may end up in a vehicle project without going through all the previous phases. Moreover, the management of the innovation department and the vehicle projects are independent (Buet, Gidel and Millet, 2010).
Figure 1. Simplified view of the innovation process. Innovation project 1 Innovation 1 Innovation 2 Innovation 3 Research Innovation 1 2 3 4 5 6 Vehicle projects 7 8 9 EoL type approval Innovation 1 Innovation 2 Innovation 3 Vehicle project 1 Vehicle project 2 Id e a s Inventions Environment team TRL Checklist Innovation project 2
The EoL type approval is made at the end of the vehicle project when the bill of material of the vehicle is available. At this moment, it is too late for proposing recommendations in order to increase the vehicle recyclability, from which it is therefore interesting to act during the upstream phases. There are a lot of constraints during the vehicle projects: there is little time and few degrees of freedom. There is little data during the research phase because the invention is not well defined at this moment; moreover, it is not certain the invention will be integrated into a vehicle project. Thus, to ensure a sufficient quantity of data and to apprehend the regulatory risks (EoL directive, REACH, chemical risk…), a checklist has been created for TRL 5 and 6, i.e. during the steps of validation of the connection of an innovation to a vehicle project. Among the topics of control the recyclability is approached for which we developed the tool OSIRIS that we present here.
3.2 The « Design for Recycling »
Our research issue is to propose a tool for evaluating the impact of an innovation on the recyclability and recoverability rates of a vehicle. Such a tool must help the engineers in the innovation structure to get a tendency of the impact and to control the regulatory risk. It is based on the measurement of the evolutions of the recyclability and recoverability rates of a vehicle when an initial solution is replaced by an innovative solution. Moreover the tool must be used as a base of communication between the Environment and the Innovation departments: the development and the tests are made by the Environment team; the tool is used together with the Environment and Innovation teams before being used entirely by the innovation leaders.
To apprehend the problems of recycling in design, many methods and tools to design for recycling were developed. (Coppens et al., 2002) developed a quantitative tool and a rule base but that can only be used when the design of the product is mainly advanced, which is not the case in the innovation phase. (Tonnelier et al., 2005) proposed a method adapted for the upstream steps of the design process, but is a qualitative one based on a questionnaire as a tree diagram, which is not allowing us to control the regulatory risk. (van Schaik and Reuter, 2007), (Mathieux, Froelich and Moszkowicz, 2008), (Santini et al., 2010), (Kuo, 2010), (Froelich et al., 2012) developed tools making it possible to calculate the recyclability rates of the matters or the components with precision. However the manufacturers already have tools allowing the computing of recyclability rates of vehicles for their type approvals; these tools would make it possible to improve the precision of the calculations but are not adapted to the innovation process and the regulatory risk control.
We propose to use the study of (Millet, Yvars and Tonnelier, 2012) by adapting it to the innovation context. The associated constraints are the following ones:
The EoL type approval of a vehicle is carried out once the design is finished, i.e. at the time when the bill of material of the vehicle is fixed. However, at the beginning of the innovation project, the vehicle into which the innovation will be integrated is mainly not developed; the recyclability and recoverability rates cannot be calculated. This causes an uncertainty.
The recycling system of the innovation is not well identified, and may not even exist, because of the novelty of the innovation e.g. the use of a new material. The end-of-life option of the innovation is thus not easily definable. The tool must make it possible for the innovation leader to simulate several alternatives of the innovation and several end-of-life options, in order firstly to determine which alternative of the innovation is most favorable to recovery, and secondly, to compare several calculation methods of the recyclability and recoverability rates.
4 Research method
4.1 Formalization of the calculation tool OSIRIS
The goal of the tool OSIRIS (Simulation Tool of the Impact on Recyclability of Innovations) presented here is to help the engineers of the Innovation department to evaluate the impact of their innovations on the recyclability and recoverability rates of a vehicle. In the first part we describe the adopted modular point of view and define the ensuing indicator. In the second part we explain how the scenarios are managed so as to be able to carry out comparisons, and we introduce a simplifying assumption. Lastly, we explore in the third part the extension to a system in which a set of innovating modules is embarked on the vehicle.
4.1.1 Modular point of view
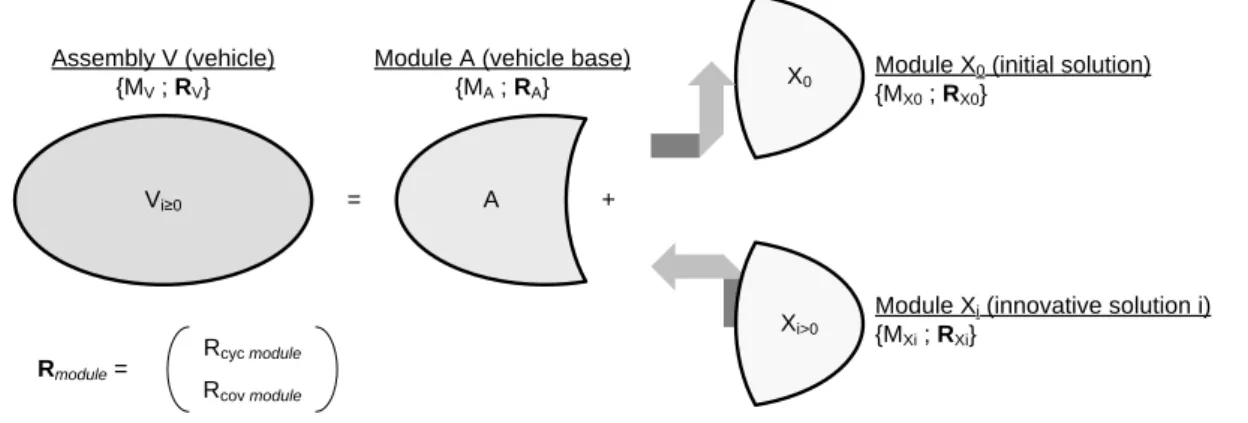
For this tool OSIRIS we use a modular point of view: the vehicle is seen as an assembly (V) of a fixed base (A) and of a module (Xi≥0); the initial replaced solution is noticed X0 while the alternative i of the
innovative replacing solution is noticed Xi>0. An alternative i of an innovative solution is different
from an alternative i’ because of its mass and/or its material distribution; both alternatives have the same functions but they rise from different choices of design. The fixed base is not impacted by the solution. A couple of parameters {Mmodule ; Rmodule} is linked to each module. Mmodule is a real positive
number representing the mass of the module, and Rmodule is a vector of two real components between 0
and 1 that represent the recyclability and recoverability rates of the module: ( ). The view of the Figure 2 shows the previous described notations.
Figure 2. Diagram view of the modular point of view. Each module is linked to a mass:
, and a rate vector: ( ). is the module of the initial
solution and are the modules of the alternatives i of the innovative solution.
The vehicle Vi≥0 is represented by the following equation system:
{
(4)
We remind that our goal is to measure the evolutions of the recyclability and recoverability rates when an initial solution X0 is replaced by an innovative solution Xi>0, which is represented by the following
equation:
(5)
Thus, by using the equation system (3) we have:
Vi≥0 =
Assembly V (vehicle) {MV ; RV}
Module A (vehicle base) {MA ; RA}
Module Xi (innovative solution i) {MXi ; RXi}
Module X0 (initial solution) {MX0 ; RX0}
+ A
Xi>0 X0
Rmodule = Rcyc module
( )
( )
(6)
Consequently, we can define a first indicator that is the Impact of the Module Xi≥0 on the recyclability
and recoverability rates of the vehicle V ( ): ( )
(7)
Lastly, we can define the relative indicator IMR:
(8)
To carry out the calculations it is necessary to know the values of the concerned parameters. Whereas the masses are independent absolute values, the recyclability and recoverability rates depend on the end-of-life option assigned with the module. For that, we propose to model the problem by a scenario management.
4.1.2 Calculation of the recyclability and recoverability rates
4.1.2.1 Definition of the scenarios
The calculation of the recyclability and recoverability rates comes directly from the definition of an end-of-life option. Each relative IMR thus depends on an alternative Xi>0 of the innovative solution,
and on an end-of-life option j, and is thus defined by a scenario. To compare scenarios between them consists in comparing several alternatives and/or several end-of-life options. The IMR and the relative IMR are thus written in the following way:
( )
(9)
(10)
We put forward a simplifying hypothesis here to decrease the number of calculations because the vehicle design is not mainly advanced:
Fitted with its initial solution, the complete vehicle is supposed to answer at least the objectives of the European directive on the EoL vehicles, i.e. it reaches at least a recyclability rate of 85% and a recoverability rate of 95%.
This hypothesis concerns the vector RA of the IMR. Thanks to the equation system (3) we can write RV0 as a function of RA and RX0 (Eq. (10)):
(11)
Let α the vector whose coordinates are the recyclability and recoverability rates defined by the European directive: (
) (
Either the fixed base is considered as answering exactly the objectives of the European
directive: , (h1)
Or the entire vehicle is considered as answering exactly the objectives of the European
directive: (h2)
Or both hypotheses are possible and a constraint must be found to make the choice between
them: or (h1)+(h2)
4.1.2.2 Determining the best hypothesis
To know the best assumption, we carry out an error analysis. We use the following notations:
is the vector of coordinates the real recyclability and recoverability rates of the initial vehicle,
is the vector of coordinates the recyclability and recoverability rates estimated with the hypothesis (h1) of the initial vehicle,
is the vector of coordinates the recyclability and recoverability rates estimated with the hypothesis (h2) of the initial vehicle.
The error made with the hypothesis (h1) and the error made the hypothesis (h2), compared with the real calculation of the relative IMR, are calculated in the following Eqs. (11) and (12).
To simplify the notations we note | | the vector whose coordinates are the absolute values of the coordinates of the vector : ( ) | | (| | ||)
| | |( ) | (12) | | |( ) | (13)
The best hypothesis is given by analyzing the sign of the difference of the components of the error vectors and (Eq. (13)).
|
| [| | | |] (14) Thanks to Eq. (10), the analysis of the sign of the difference of the components of the error vectors of Eq. (13) gives the following outcomes:
For the recyclability :
If then (C1)
If then
o If then (C2) o If then (C3) The tends towards 0 if the recyclability rate of the initial solution approaches and/or if the mass of the initial solution is very small in comparison with the mass of the vehicle provided with the initial solution. Thus, for innovations with low masses compared to the vehicle, the
probability that case (C2) appears is very weak, and the sign of the difference of the X-coordinates of the errors (Eq. (13)) depends only on the value of the recyclability rate of the initial solution.
Therefore, we assume that the components of the vectors and are fixed by using the hypothese (h1)+(h2) in the following way:
For the recyclability
o If then o If then
For the recoverability:
o If then o If then
4.1.3 Multiple innovations
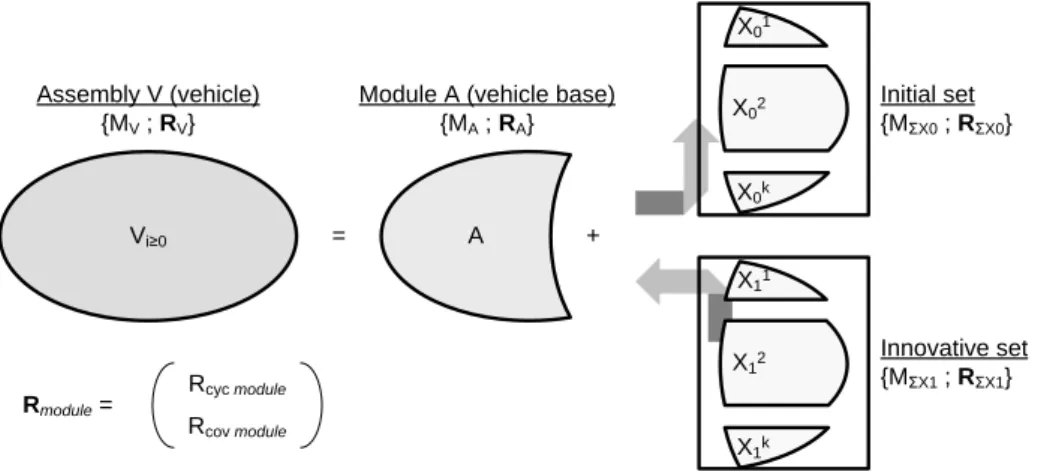
The tool OSIRIS presented above is applicable to a set of innovations likely to be embarked on a vehicle. The point of view adopted here is to regard the set of solutions as a module made up of a sum of sub-modules (solutions). Consequently, the reasoning to compute the rates of the common basis is the same one.
Figure 3. Schematic representation from the modularized point of view for a module 1-4 of solutions. The module 1-1-4 of solutions is represented by a sum of modules of solutions which are symbolized by the exponent k.
In Eq. (16), the various sub-modules are represented by the exponent , the set of initial sub-modules is symbolized by ∑ , and the set of innovative sub-modules by ∑ . The impact of a set of innovative sub-modules is calculated thanks to Eq. (15):
∑ ∑ ∑ (∑ ∑ ) ∑ ∑ (∑ ∑ ) ∑ ∑ (15) Vi≥0 = Assembly V (vehicle) {MV ; RV}
Module A (vehicle base) {MA ; RA} + A X1k X12 X11 X0k X02 X01 Innovative set {MΣX1 ; RΣX1} Initial set {MΣX0 ; RΣX0}
Rmodule = Rcyc module
4.2 Experimental protocol
In the first experimentation, we test the simplifying hypothesis to justify the interest to fix the recyclability rate of the fixed base according to the value of the recyclability rate of the initial module (h1)+(h2) with MA = 1000 kg. We carry out two series of three simulations; for each simulation of the
series, the real recyclability rate of the initial vehicle differs:
Simulation 1 :
Simulation 2 :
Simulation 3 :
In the first series we test the hypothesis (h1) by generating initial modules of which the recyclability rates lie between 0% and 85%. We compare the errors made with the hypothesis (h1) and the hypothesis (h1)+(h2). In the second series we test the hypothesis (h2) by generating initial modules of which the recyclability rates lie between 85% and 100%. We compare the errors made with the hypothesis (h2) and the hypothesis (h1)+(h2). The standard deviations are subjected to Fisher test (F-Test) that gives the probability that there is no relevant difference between the variances of both data sets. In the same way for the averages we use a Student test (T-Test).
In the second experimentation we analyze the effect of the real recyclability rate of the initial vehicle on the error made with the hypothesis (h1)+(h2). We take again the fixed base and the three recyclability rates of the initial vehicle from the first experimentation. We define a domain of validity by computing the length of the interval of dispersion at 99% defined by six times the standard deviation that we compare with the length of the interval of uncertainty fixed at 0.20%. We also represent the rate of increase in the standard deviations according to the real recyclability rate of the initial vehicle to highlight the “speed” to which the domain of validity is exceeded.
In the third experimentation we analyze the impact of a hybrid motorization by breaking up it into four modules. The first goal is to compute the impact of the modules taken separately, then of all the four modules. The second goal is to compare two end-of-life options of the battery: in the first case, it is considered as 100% recyclable, in the second case, an end-of-life option is allotted to each matter which composes it. We compare the outcomes estimated with the real values of the impacts computed without the simplifying hypothesis.
As we described in the previous part, a solution is represented by its mass and the recyclability and recoverability rates. In this paper, we test only the recyclability rate because the results are similar within the recoverability rate. To test our tool OSIRIS, we use simulations allowing generating random couples {initial solution; innovative solution}. The procedure of a simulation is the following one:
1) Definition of an initial vehicle: mass and real recyclability rate . According to the made homologation calculations, real recyclability rates of vehicles are between 85% and 88%. The interval of uncertainty is limited by the values of the relative impacts computed with these extreme rates of the initial vehicle.
2) Generation of 8000 random couples {initial solution (X0); innovative solution (X1)} in order to
have a range of couples with several mass differences:
a) and are real numbers randomly generated in the interval [ ]
b) is an integer randomly generated in the interval ⟦ ⟧; we consider that the majority of initial and innovative solutions weighs less than 350 kg
d) Calculation of the absolute difference between the masses | | and classification of the differences in the intervals [ [ ⟦ ⟧.
3) Calculations of the estimated recyclability rates of the fixed base and of the initial vehicle thanks to the simplifying hypothesis.
4) Selection of the couples answering the following criteria: a) [ ]
b) [ ]
5) Calculations of the relative IMR estimated with the simplifying hypothesis and of the real relative IMR with
6) Calculation of the absolute errors between the estimated relative IMR and the real relative IMR: | |.
7) Calculation of the error distribution means and standard deviations per mass interval.
5 Experimental outcomes
5.1 Validation of the simplifying hypothesis
In this experimentation, we suppose MA = 1000 kg. The first simulation consists in testing the
hypotheses (h1) and (h1)+(h2) on three real recyclability rates of the vehicle: 85.0%, 86.5%, and 88.0%, with the recyclability rate of the initial solution lower than 85%. Outcomes are given in Table 5.
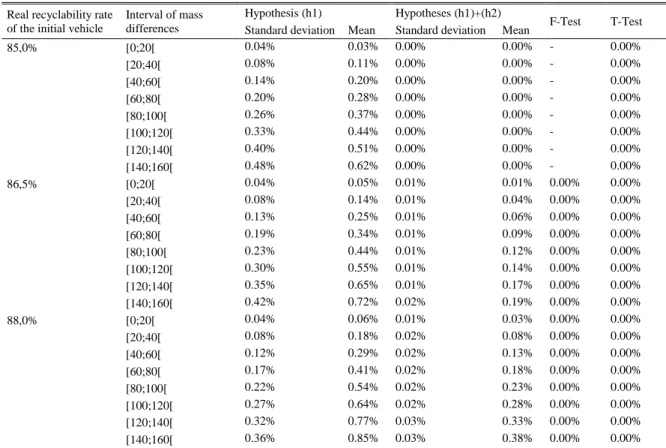
Table 5. Summary of the results of simulations carried out to test the hypothesis (h1) and to compare it with the hypothesis (h1)+(h2). The recyclability rate of the initial solution is randomly generated in the interval [0%; 85%].
Real recyclability rate of the initial vehicle
Interval of mass differences
Hypothesis (h1) Hypotheses (h1)+(h2)
F-Test T-Test Standard deviation Mean Standard deviation Mean
85,0% [0;20[ 0.04% 0.03% 0.00% 0.00% - 0.00% [20;40[ 0.08% 0.11% 0.00% 0.00% - 0.00% [40;60[ 0.14% 0.20% 0.00% 0.00% - 0.00% [60;80[ 0.20% 0.28% 0.00% 0.00% - 0.00% [80;100[ 0.26% 0.37% 0.00% 0.00% - 0.00% [100;120[ 0.33% 0.44% 0.00% 0.00% - 0.00% [120;140[ 0.40% 0.51% 0.00% 0.00% - 0.00% [140;160[ 0.48% 0.62% 0.00% 0.00% - 0.00% 86,5% [0;20[ 0.04% 0.05% 0.01% 0.01% 0.00% 0.00% [20;40[ 0.08% 0.14% 0.01% 0.04% 0.00% 0.00% [40;60[ 0.13% 0.25% 0.01% 0.06% 0.00% 0.00% [60;80[ 0.19% 0.34% 0.01% 0.09% 0.00% 0.00% [80;100[ 0.23% 0.44% 0.01% 0.12% 0.00% 0.00% [100;120[ 0.30% 0.55% 0.01% 0.14% 0.00% 0.00% [120;140[ 0.35% 0.65% 0.01% 0.17% 0.00% 0.00% [140;160[ 0.42% 0.72% 0.02% 0.19% 0.00% 0.00% 88,0% [0;20[ 0.04% 0.06% 0.01% 0.03% 0.00% 0.00% [20;40[ 0.08% 0.18% 0.02% 0.08% 0.00% 0.00% [40;60[ 0.12% 0.29% 0.02% 0.13% 0.00% 0.00% [60;80[ 0.17% 0.41% 0.02% 0.18% 0.00% 0.00% [80;100[ 0.22% 0.54% 0.02% 0.23% 0.00% 0.00% [100;120[ 0.27% 0.64% 0.02% 0.28% 0.00% 0.00% [120;140[ 0.32% 0.77% 0.03% 0.33% 0.00% 0.00% [140;160[ 0.36% 0.85% 0.03% 0.38% 0.00% 0.00%
The outcomes of F-Test and T-Test show that variances and averages of errors made with hypothesis (h1) and hypothesis (h1)+(h2) are different for each interval of mass differences. The averages and
standard deviations of hypothesis (h1)+(h2) are lower than those of hypothesis (h1). We thus confirm that for recyclability rates of initial solution lower than 85%, the hypothesis (h1)+(h2) is the best. The second simulation consists in testing hypotheses (h2) and (h1)+(h2) on three real recyclability rates of the vehicle: 85.0%, 86.5%, and 88.0%, with recyclability rate of initial solution upper than 85%. The outcomes are given in Table 6.
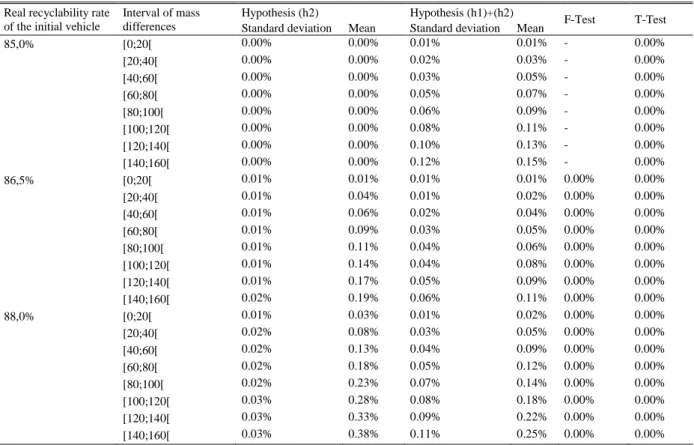
Table 6. Summary of the results of simulations carried out to test the hypothesis (h2) and to compare it with the hypothesis (h1)+(h2). The recyclability rate of the initial solution is randomly generated in the interval [85%; 100%].
Real recyclability rate of the initial vehicle
Interval of mass differences
Hypothesis (h2) Hypothesis (h1)+(h2)
F-Test T-Test Standard deviation Mean Standard deviation Mean
85,0% [0;20[ 0.00% 0.00% 0.01% 0.01% - 0.00% [20;40[ 0.00% 0.00% 0.02% 0.03% - 0.00% [40;60[ 0.00% 0.00% 0.03% 0.05% - 0.00% [60;80[ 0.00% 0.00% 0.05% 0.07% - 0.00% [80;100[ 0.00% 0.00% 0.06% 0.09% - 0.00% [100;120[ 0.00% 0.00% 0.08% 0.11% - 0.00% [120;140[ 0.00% 0.00% 0.10% 0.13% - 0.00% [140;160[ 0.00% 0.00% 0.12% 0.15% - 0.00% 86,5% [0;20[ 0.01% 0.01% 0.01% 0.01% 0.00% 0.00% [20;40[ 0.01% 0.04% 0.01% 0.02% 0.00% 0.00% [40;60[ 0.01% 0.06% 0.02% 0.04% 0.00% 0.00% [60;80[ 0.01% 0.09% 0.03% 0.05% 0.00% 0.00% [80;100[ 0.01% 0.11% 0.04% 0.06% 0.00% 0.00% [100;120[ 0.01% 0.14% 0.04% 0.08% 0.00% 0.00% [120;140[ 0.01% 0.17% 0.05% 0.09% 0.00% 0.00% [140;160[ 0.02% 0.19% 0.06% 0.11% 0.00% 0.00% 88,0% [0;20[ 0.01% 0.03% 0.01% 0.02% 0.00% 0.00% [20;40[ 0.02% 0.08% 0.03% 0.05% 0.00% 0.00% [40;60[ 0.02% 0.13% 0.04% 0.09% 0.00% 0.00% [60;80[ 0.02% 0.18% 0.05% 0.12% 0.00% 0.00% [80;100[ 0.02% 0.23% 0.07% 0.14% 0.00% 0.00% [100;120[ 0.03% 0.28% 0.08% 0.18% 0.00% 0.00% [120;140[ 0.03% 0.33% 0.09% 0.22% 0.00% 0.00% [140;160[ 0.03% 0.38% 0.11% 0.25% 0.00% 0.00%
The outcomes of F-Test and T-Test show that differences between error variances and averages with hypothesis (h2) and hypothesis (h1)+(h2) are relevant for each interval of mass differences. The standard deviations of hypothesis (h1)+(h2) are upper than those of hypothesis (h1). On the other hand, the averages of hypothesis (h1)+(h2) are lower than those of hypothesis (h1) except for the case where the real recyclability rate of initial vehicle is equal to 85%.We are in case (C2) where there is an uncertainty on the value of the best hypothesis to choose, and we locate the limit of this case around a real recyclability rate of initial vehicle equal to 85.7% (see Table 7): indeed, the T-Test outcomes show that differences of averages are not relevant.
To conclude this first experimentation, we showed that averages of errors made with (h1)+(h2) are lower than errors made with one or the other hypothesis taken independently, except when the real recyclability rate of initial vehicle is in case (C2). On the other hand, the standard deviations of hypothesis (h2) are upper to those of hypothesis (h1)+(h2). Consequently, it is preferable to use hypothesis (h1)+(h2) while checking that the limit of the domain of validity, that we represent in the second experimentation, is not exceeded.
Table 7. Summary of the results of the simulation carried out to detect the limit of case (C2). Looking at the outcomes of T-Test, the differences between error means of hypotheses (h2) and (h1)+(h2) are not relevant.
Real recyclability rate of the initial vehicle
Interval of mass differences
Hypothesis (h2) Hypotheses (h1)+(h2)
T-Test Standard deviation Mean Standard deviation Mean
85.7% [0;20[ 0.00% 0.01% 0.01% 0.01% 77.87% [20;40[ 0.00% 0.02% 0.02% 0.02% 74.51% [40;60[ 0.00% 0.03% 0.02% 0.03% 55.77% [60;80[ 0.00% 0.04% 0.04% 0.04% 4.21% [80;100[ 0.01% 0.05% 0.05% 0.05% 57.52% [100;120[ 0.01% 0.07% 0.06% 0.07% 88.44% [120;140[ 0.01% 0.08% 0.07% 0.08% 52.73% [140;160[ 0.01% 0.09% 0.08% 0.10% 2.24%
5.2 Definition of domain of validity
The hypothesis (h1)+(h2) is used in the simulations made in this part. Figure 4 shows the error means as function of the three same real recyclability rates of initial vehicle and of the intervals of mass differences of solutions. Figure 5 shows the lengths of interval of dispersion at 99%, defined as being equal to six times the standard deviation, as function of the three same real recyclability rates of initial vehicle and of the intervals of mass difference.
Figure 4. Effect of the mass differences between initial and innovative solutions on the average of the errors made with the hypothesis (h1)+(h2) for real recyclability rates of initial vehicle.
We notice that the average of errors is proportional to the mass differences between initial and innovative modules. In addition, the rate of increase in error averages is proportional to the real
Figure 5. Effect of the mass differences between the initial and innovative solutions on the length of the interval of dispersion at 99% of the errors made with the hypothesis (h1)+(h2) for real recyclability rates of the initial vehicle.
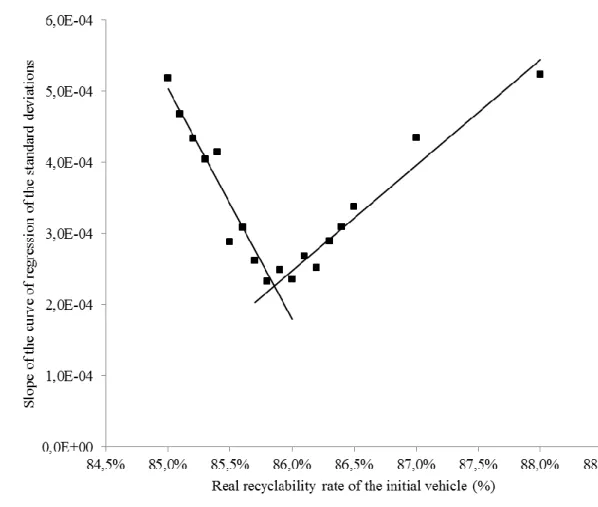
Like the averages, we notice that more the difference between the masses of initial and innovative solutions is large, more the length of intervals of dispersion at 99% increases. It is nevertheless impossible to conclude on the influence of the real recyclability rate of the initial vehicle on the rate of increase in the standard deviations. With this intention, we represent on Figure 6 the fluctuation of the value of the directing coefficient of linear regressions of Figure 5 as a function of the real recyclability rate of the initial vehicle.
Figure 6. Real recyclability rate of the initial vehicle effect on the value of the directing coefficient of the curves of linear regression of the standard deviations.
We notice that the more the real recyclability rate of the initial vehicle increases, the more the directing coefficient decreases, up to a certain point located between 85.8% and 85.9%. It increases thereafter. This fluctuation is due on the transition from case (C2) to case (C3), i.e. from the case where hypothesis (h2) is the best to the case where hypothesis (h1) is the best. The extreme real recyclability rates (85% and 88%) have the largest directing coefficient; they thus are those for which the lengths of the intervals of dispersion at 99% will the most quickly reach the limit of validity of the tool OSIRIS.
Table 8 and Table 9 compare the effects of the mass of the fixed base on respectively the average and the length of the interval at 99% of the errors. We highlight here that these two parameters are inversely proportional to the mass of the fixed base i.e. proportional to the mass fraction of the initial or innovative module of the vehicle.
Table 8. Comparison of the averages of errors for fixed base masses of 700, 1000 and 1300 kg.
Real recyclability rate of the
initial vehicle (%) 85.0% 86.5% 88.0%
Mass of the fixed base (kg) 700 1000 1300 700 1000 1300 700 1000 1300
[0;20[ 0.00% 0.00% 0.00% 0.02% 0.01% 0.01% 0.03% 0.02% 0.02% [20;40[ 0.01% 0.00% 0.00% 0.05% 0.04% 0.03% 0.10% 0.07% 0.06% [40;60[ 0.02% 0.01% 0.00% 0.08% 0.06% 0.05% 0.16% 0.12% 0.10% [60;80[ 0.02% 0.01% 0.01% 0.11% 0.08% 0.07% 0.22% 0.17% 0.14% [80;100[ 0.02% 0.01% 0.01% 0.15% 0.11% 0.08% 0.28% 0.21% 0.18% [100;120[ 0.04% 0.02% 0.01% 0.18% 0.13% 0.10% 0.35% 0.27% 0.21% [120;140[ 0.04% 0.02% 0.01% 0.20% 0.15% 0.12% 0.40% 0.31% 0.25% [140;160[ 0.05% 0.02% 0.02% 0.23% 0.18% 0.14% 0.45% 0.36% 0.29%
Table 9. Comparison of lengths of intervals of dispersion at 99% of errors for fixed base masses of 700, 1000 and 1300 kg.
Real recyclability rate of the
initial vehicle (%) 85.0% 86.5% 88.0%
Mass of the fixed base (kg) 700 1000 1300 700 1000 1300 700 1000 1300
[0;20[ 0.06% 0.03% 0.02% 0.06% 0.05% 0.04% 0.12% 0.09% 0.07% [20;40[ 0.16% 0.08% 0.06% 0.10% 0.07% 0.05% 0.19% 0.13% 0.09% [40;60[ 0.27% 0.14% 0.08% 0.14% 0.10% 0.08% 0.31% 0.18% 0.12% [60;80[ 0.38% 0.18% 0.10% 0.18% 0.13% 0.10% 0.39% 0.23% 0.14% [80;100[ 0.39% 0.23% 0.13% 0.24% 0.17% 0.13% 0.49% 0.32% 0.18% [100;120[ 0.59% 0.27% 0.20% 0.31% 0.21% 0.15% 0.56% 0.34% 0.21% [120;140[ 0.66% 0.37% 0.23% 0.35% 0.24% 0.18% 0.73% 0.43% 0.30% [140;160[ 0.86% 0.38% 0.27% 0.40% 0.27% 0.20% 0.84% 0.43% 0.31%
We thus conclude on this experimentation by affirming that more the mass difference between the initial and innovative solutions is small, less the error and the dispersion of the errors is large.
5.3 Application on a hybrid motorization
In this experimentation, we propose to compare the impact of a hybrid motorization on the recyclability and recoverability rates of a vehicle in order to test the tool OSIRIS with on a heavy module. We evaluate the impact of the technology Hybrid4 where an electrical motor supplied with a NiMH battery is installed on the rear axle (Figure 7).
Figure 7. Schematic representation of a hybrid motorization: the thermal engine (dark blue) tractor draws the nose gear wheels and the electrical motor (green) propels the aft wheels. The rear axle (gray) is modified in particular to accommodate the electrical motor which is supplied by a NiMH accumulator (yellow clearly).
We have for that the bill of material of the initial vehicle and the vehicle provided with the hybrid motorization. We identify the products common to both vehicles and those that are specific. We classify them in four modules:
Module 1: battery NiMH – only on the vehicle provided with the hybrid motorization; Battery NiMH (module 1) Electrical motor (module 2) Rear axle (module 4)
Module 2: electrical motor of traction – only on the vehicle provided with the hybrid motorization;
Module 3: rear axle – traditional on the vehicle provided with the initial solution and adapted on the vehicle provided with the innovative solution;
Module 4: the rest of the variable perimeter.
We also define two end-of-life options. In the first one, the NiMH battery is considered as 100% recyclable, while in the second one, its bill of material is detailed and an end-of-life option for each material is applied to it. The masses, real recyclability and recoverability rates are synthesized in Table 10.
Table 10. Summary of real values of masses and recyclability and recoverability rates of modules, of the set of modules, and of vehicles. Only the innovative module 1, module 1-4, and entire vehicle have differences between end-of-life options.
Vehicle provided with the initial
solution Vehicle provided with the innovative solution Mass (kg) Rcyc (%) Rcov (%) Mass (kg)
Rcyc (%) Rcov (%)
Option 1 Option 2 Option 1 Option 2
Module 1 - - - 50.64 100.00% 69.40% 100.00% 84.57% Module 2 - - - 28.94 97.13% 97.13% 99.96% 99.96% Module 3 76.76 98.05% 100.00% 111.33 98.41% 98.41% 100.00% 100.00% Module 4 333.56 90.70% 98.21% 370.70 89.72% 89.72% 98.80% 98.80% Module 1-4 410.32 92.08% 98.54% 561.61 92.75% 89.99% 99.21% 97.81% Fixed base 1224.53 83.12% 96.39% 1224.53 83.12% 83.12% 96.39% 96.39% Entire vehicle 1634.85 85.37% 96.93% 1786.14 86.15% 85.28% 97.28% 96.24% Table 11 synthesizes the outcomes estimated with the tool OSIRIS and the real outcomes computed by taking the real recyclability and recoverability rates of the initial vehicle equal respectively to 85.37% and 96.93%. Are also represented the errors made between the estimated and real impacts, and the length of the interval of uncertainty. These two last data are represented respectively on Figure 8 and on Figure 9. We note that the errors of modules 1 to 4 are close of the averages of the simulation, and the lengths of their intervals of uncertainty are in the domain of validity. On the other hand, the set of modules represented by the module 1-4 is out of the domain of validity for the length of the interval of uncertainty.
Table 11. Summary of the estimated and real impacts. We note that the length of the interval of uncertainty of the module 1-4 exceeds the fixed threshold. Moreover, the made error is close to 0.10%.
Real value Estimated value Error Length of the interval of
uncertainty | | | |
EoL option 1 Module 1 0.44% 0.09% 0.45% 0.15% 0.01% 0.06% 0.09% 0.09%
Module 2 0.20% 0.05% 0.21% 0.09% 0.01% 0.03% 0.05% 0.05%
Module 3 0.29% 0.06% 0.28% 0.10% 0.01% 0.04% 0.06% 0.06%
Module 4 -0.10% 0.16% -0.12% 0.19% 0.02% 0.03% 0.07% 0.07%
Module 1-4 0.78% 0.35% 0.66% 0.43% 0.12% 0.09% 0.25% 0.25%
EoL option 2 Module 1 -0.48% -0.37% -0.47% -0.31% 0.01% 0.06% 0.09% 0.09%
Figure 8. Effect of the differences between the initial and innovative solutions on the errors made with the hypothesis (h1)+(h2) for a simulation where the real recyclability rate of the initial vehicle is equal to 85.37%, and representation of the errors made by each module of the hybrid motorization.
Figure 9. Effect of the differences between the initial and innovative solutions on the interval of dispersion at 99% of the errors with the hypothesis (h1)+(h2) for a simulation where the real recyclability rate of the initial vehicle is equal to 85.37% (white squares □), and representation of the lengths of the intervals of uncertainty of each module of the hybrid motorization (black crosses ).
Taking into consideration these outcomes, whereas the impact of each module has a value close to the real value, the user of the proposed tool OSIRIS will have to look further into his analysis of the impact of the set of the hybrid motorization represented by module 1-4 because this one is out of the domain of validity of the tool OSIRIS.
6 Conclusion and perspectives
In this paper, we proposed a tool named OSIRIS to evaluate the impact of the innovations on the recyclability and recoverability rates of a vehicle in order to anticipate the regulatory risk on approval. This tool OSIRIS is based on a modular point of view where the vehicle is considered as the assembly of a fixed base and of an initial or innovative solution. As the development of the new vehicle is not mainly finished, a simplifying hypothesis is carried out to fix the recyclability and recoverability rates of the fixed base. Lastly, the user defines the end-of-life options of each module. The final result is a relative indicator called the relative Impact of an innovative Module on the recyclability and recoverability Rates (IMR).
We tested this tool OSIRIS in three ways. In the first experimentation, we compared the hypotheses (h1) where the recyclability and recoverability rates of the base are fixed respectively at 85% and 95%, (h2) where the recyclability and recoverability rates of the initial vehicle are fixed respectively at 85% and 95%, and (h1)+(h2) where the selection of one or other hypothesis is carried out according to the value of the recyclability or recoverability rates of the initial solution. We conclude that the hypothesis (h1)+(h2) on average generates less errors, but that in certain cases the dispersion could be larger, from which the importance to define a domain of validity.
In the second experimentation, we defined a domain of validity. We computed the relative IMR estimated with the simplifying hypothesis of a large number of couples {initial solution; innovative solution} randomly generated. In parallel, the real relative IMR are computed without the simplifying hypothesis, i.e. with a real value of the recyclability and recoverability rates. The estimated relative IMR are compared with the real relative IMR in order to measure the statistical distribution of the errors. The length of the interval of dispersion at 99% is compared with the length of the interval of uncertainty that we fixed at 0.20%. Thanks to this experimentation, we show that the tool OSIRIS is not adapted for differences in mass between initial solution and innovative solution that are larger than 40-60 kg.
The third experimentation was carried out on a hybrid motorization. We simulated two end-of-life options on four innovative modules and the set of these modules. It proved that the uncertainty and the error of the set are too important to conclude because out of the domain of validity, and that a user confronted with this kind of case should look further into these analyses.
Our tool OSIRIS is conclusive on the majority of the innovations. The application makes it possible to obtain a good tendency of the impact and to apprehend the regulatory risk for approval. To improve the tool OSIRIS, we recommend adding a techno-economic analysis to take into account the viability of the recycling system and the impact of an innovation on these questions.
7 References
Buet, G., Gidel, T. and Millet, D. (2010) 'Integrating innovations into vehicle projects - towards a robust “touch down” process', Global Product Development: 20th CIRP Design Conference, Nantes, France, 117-126.
Ciacci, L., Morselli, L., Passarini, F., Santini, A. and Vassura, I. (2010) 'A comparison among different automotive shredder residue treatment processes', International Journal of Life Cycle
Assessment, vol. 15, no. 9, pp. 896-906.
Coppens, C., Le Coq, M., Millet, D. and Michaud, P. (2002) 'Evaluating and improving the recovery aptitude of an automobile function: The PSA approach', International Journal of Vehicle Design, vol. 29, no. 4, pp. 307-316.
European Parliament, Council (2000) Directive 2000/53/EC of the European Parliament and of the
Council of 18 September 2000 on end-of life vehicles, Official Journal of the European Union.
European Parliament, Council (2005) Directive 2005/64/EC of the European Parliament and of the
Council of 26 October 2005 on the type-approval of motor vehicles with regard to their reusability, recyclability and recoverability and amending Council Directive 70/156/EEC, Official Journal of the
European Union.
European Parliament, Council (2007) Regulation (EC) No 715/2007 of the European Parliament and
of the Council of 20 June 2007 on type approval of motor vehicles with respect to emissions from light passenger and commercial vehicles (Euro 5 and Euro 6), Official Journal of the European Union.
European Parliament, Council (2009) Regulation (EC) No 443/2009 of the European Parliament and
of the Council of 23 April 2009 setting emission performance standards for new passenger cars as part of the Community's integrated approach to reduce CO 2 emissions from light-duty vehicles,
Official Journal of the European Union.
Fiore, S., Ruffino, B. and Zanetti, M.C. (2012) 'Automobile Shredder Residues in Italy: Characterization and valorization opportunities', Waste Management, vol. 32, no. 8, pp. 1548-1559. Froelich, D., Maris, E., Haoues, N., L., C., Renard, H., Abraham, F. and Lassartesses, R. (2012) 'State of the art of plastic sorting and recycling: Feedback to vehicle design', Minerals Engineering, vol. 20, no. 9, pp. 902-912.
Gaustad, G., Olivetti, E. and Kirchain, R. (2012) 'Improving aluminum recycling: A survey of sorting and impurity removal technologies', Resources, Conservation and Recycling, vol. 58, pp. 79-87. ISO (2002) ISO 22628:2002 - Road vehicles - Recyclability and recoverability - Calculation method, International Organization for Standardization.
Kuo, T.C. (2010) 'Combination of case-based reasoning and analytical hierarchy process for providing intelligent decision support for product recycling strategies', Expert Systems with Applications, vol. 37, no. 8, pp. 5558-5563.
Mankins, J.C. (2009) 'Technology readiness assessments: A retrospective', Acta Astronautica, vol. 65, no. 9-10, pp. 1216-1223.
Mathieux, F., Froelich, D. and Moszkowicz, P. (2008) 'ReSICLED: a new recovery-conscious design method for complex products based on a multicriteria assessment of the recoverability', Journal of
Cleaner Production, vol. 16, no. 3, pp. 277-298.
Millet, D., Yvars, P.-A. and Tonnelier, P. (2012) 'A method for identifying the worst recycling case: Application on a range of vehicles in the automotive sector', Resources, Conservation and Recycling, vol. 68, pp. 1-13.
Nasr, N. and Thurston, M. (2006) 'Remanufacturing: A Key Enabler to Sustainable Product Systems', 13th CIRP International Conference on Life Cycle Engineering, 15-18.
Passarini, F., Ciacci, L., Santini, A., Vassura, I. and Morselli, L. (2012) 'Auto shredder residue LCA: implications of ASR composition evolution', Journal of Cleaner Production, vol. 23, no. 1, pp. 28-36. Perry, N., Bernard, A., Laroche, F. and Pompidou, S. (2012) 'Improving design for recycling – Application to composites', CIRP Annals - Manufacturing Technology, vol. 61, no. 1, pp. 151-154. Pigosso, D.C.A., Zanette, E.T., Filho, A.G., Ometto, A.R. and Rozenfeld, H. (2010) 'Ecodesign methods focused on remanufacturing', Journal of Cleaner Production, vol. 18, no. 1, pp. 21-31. Reuter, M.A., van Schaik, A., Ignatenko, O. and de Haan, G.J. (2006) 'Fundamental limits for the recycling of end-of-life vehicles', Minerals Engineering, vol. 19, no. 5, pp. 433-449.
Santini, A., Herrmann, C., Passarini, F., Vassura, I., Luger, T. and Morselli, L. (2010) 'Assessment of Ecodesign potential in reaching new recycling targets', Resources, Conservation and Recycling, vol. 54, no. 12, pp. 1128-1134.
Schipper, L. (2011) 'Automobile use, fuel economy and CO2 emissions in industrialized countries: Encouraging trends through 2008?', Transport Policy, vol. 18, no. 2, pp. 358-372.
Sutherland, J., Gunter, K., Allen, D., Bauer, D., Bras, B., Gutowski, T., Murphy, C., Piwonka, T., Sheng, P., Thurston, D. and Wolff, E. (2004) 'A global perspective on the environmental challenges facing the automotive industry: state-of-the-art and directions for the future', International Journal of
Vehicle Design, vol. 35, no. 1/2, pp. 86-110.
Tonnelier, P., Millet, D., Richir, S. and Lecoq, M. (2005) 'Is it possible to evaluate the recovery potential earlier in the design process? Proposal of a qualitative evaluation tool', Journal of
Engineering Design, vol. 16, no. 3, pp. 297-309.
van Schaik, A. and Reuter, M.A. (2007) 'The use of fuzzy rule models to link automotive design to recycling rate calculation', Minerals Engineering, vol. 20, no. 9, pp. 875-890.
Warsen, J., Laumer, M. and Momberg, W. (2011) 'Comparative Life Cycle Assessment of Remanufacturing and New Manufacturing of a Manual Transmission', 18th CIRP International Conference on Life Cycle Engineering, 67-72.
Weager, B.M., Bishop, G.R., Black, A.C., Reynolds, N., Pharaoh, M.W., Smith, G.F., Rowe, J., Riley, D.E., Birrell, M. and Donaldson, P. (2007) 'Development of recyclable self-reinforced polypropylene parts for automotive applications', International Journal of Vehicle Design, vol. 44, no. 3/4, pp. 293-310.
Yang, Y., Boom, R., Irion, B., van Heerden, D.-J., Kuiper, P. and de Wit, H. (2012) 'Recycling of composite materials', Chemical Engineering and Processing: Process Intensification, vol. 51, pp. 53-68.
Zorpas, A.A. and Inglezakis, V.J. (2012) 'Automotive industry challenges in meeting EU 2015 environmental standard', Technology in Society, vol. 34, no. 1, pp. 55-83.