RESEARCH OUTPUTS / RÉSULTATS DE RECHERCHE
Author(s) - Auteur(s) :
Publication date - Date de publication :
Permanent link - Permalien :
Rights / License - Licence de droit d’auteur :
Bibliothèque Universitaire Moretus Plantin
Institutional Repository - Research Portal
Dépôt Institutionnel - Portail de la Recherche
researchportal.unamur.be
University of Namur
Structurally tuned iridescent surfaces inspired by nature
Deparis, O.; Rassart, M.; Vandenbem, C.; Welch, V.; Vigneron, J.P.; Lucas, S. Published in:
New Journal of Physics
DOI:
10.1088/1367-2630/10/1/013032
Publication date:
2008
Link to publication
Citation for pulished version (HARVARD):
Deparis, O, Rassart, M, Vandenbem, C, Welch, V, Vigneron, JP & Lucas, S 2008, 'Structurally tuned iridescent surfaces inspired by nature', New Journal of Physics, vol. 10. https://doi.org/10.1088/1367-2630/10/1/013032
General rights
Copyright and moral rights for the publications made accessible in the public portal are retained by the authors and/or other copyright owners and it is a condition of accessing publications that users recognise and abide by the legal requirements associated with these rights. • Users may download and print one copy of any publication from the public portal for the purpose of private study or research. • You may not further distribute the material or use it for any profit-making activity or commercial gain
• You may freely distribute the URL identifying the publication in the public portal ? Take down policy
If you believe that this document breaches copyright please contact us providing details, and we will remove access to the work immediately and investigate your claim.
Structurally tuned iridescent surfaces inspired by nature
This article has been downloaded from IOPscience. Please scroll down to see the full text article. 2008 New J. Phys. 10 013032
(http://iopscience.iop.org/1367-2630/10/1/013032)
Download details:
IP Address: 138.48.4.247
The article was downloaded on 04/11/2012 at 12:15
Please note that terms and conditions apply.
T h e o p e n – a c c e s s j o u r n a l f o r p h y s i c s
New Journal of Physics
Structurally tuned iridescent surfaces inspired
by nature
Olivier Deparis1,3, Marie Rassart1, Cédric Vandenbem1, Victoria Welch1, Jean Pol Vigneron1 and Stéphane Lucas2
1Laboratoire de Physique du Solide, University of Namur, 61 rue de Bruxelles, 5000 Namur, Belgium
2Laboratoire d’Analyses par Réactions Nucléaires, University of Namur,
61 rue de Bruxelles, 5000 Namur, Belgium
E-mail:[email protected]
New Journal of Physics 10 (2008) 013032 (11pp)
Received 21 November 2007 Published 25 January 2008
Online athttp://www.njp.org/
doi:10.1088/1367-2630/10/1/013032
Abstract. Iridescent surfaces exhibit vivid colours which change with the angle of incidence or viewing due to optical wave interference in the multilayer structure present at the wavelength scale underneath the surface. In nature, one can find examples of iridescent Coleoptera for which the hue changes either greatly or slightly with the angle. Because these species typically make these structures from a single biological material (usually chitin) and air or water as the low refractive index component, they have evolved by adjusting the layer thicknesses in order to display quite different iridescent aspects. Taking inspiration from this proven strategy, we have designed and fabricated
periodic TiO2/SiO2 multilayer films in order to demonstrate the concept of
structurally tuned iridescent surfaces. Titanium or silicon oxide layers were deposited on a glass substrate using dc reactive or RF magnetron sputtering techniques, respectively. Two structures were designed for which the period and the TiO2/SiO2 layer thickness ratio were varied in such a way that the films displayed radically different iridescent aspects: a reddish-to-greenish changing hue and a stable bluish hue. The fabricated samples were characterized through
specular reflectance/transmittance measurements. Modelling of transmittance
spectra using standard multilayer film theory confirmed the high quality of the twelve-period Bragg reflectors. The chromaticity coordinates, which were calculated from measured reflectance spectra taken at different angles, were in accordance with theoretical predictions.
3 Author to whom any correspondence should be addressed.
New Journal of Physics 10 (2008) 013032
Contents
1. Introduction 2
2. Design considerations 4
3. Fabrication aspects 6
4. Sample characterization and modelling 7
5. Results 8
6. Conclusion 10
Acknowledgments 11
References 11
1. Introduction
Iridescence is the property of layered surfaces to reflect specularly light of a different colour as the angle of incidence changes. Physically, it originates from interference of the light wave due to multiple reflections at the interfaces between layers of different refractive indexes. When the alternation of high and low index layers is periodic and the number of periods is sufficiently high, these interferences lead to a well-defined (Bragg) peak in the reflectance spectrum, hence a saturated colour. The reflectance peak shifts to shorter wavelengths as the angle increases from normal to grazing incidence, leading to iridescence. In nature, many animals (often insects) exhibit iridescence and make use of this property for specific purposes (sexual recognition, signalling, etc) [1]. Due to selection pressures, these animals have evolved to produce a large variety of photonic nanometre-scale structures which are increasingly considered as unique
templates for developing novel photonic devices [2]. Because one of the most efficient ways
for an animal to build such structures appears to be to use a single biological material in combination with air or water as the low refractive index component, one may think, at first glance, that all these structures display roughly the same iridescence. The reality is surprisingly different: in spite of restrictions on the number of available biological materials and therefore on refractive indexes, a great diversity of iridescent aspects is found. In fact, even species which have similar multilayered body parts on closer examination may have evolved structures with different layer thicknesses. This optimization strategy is a major lesson from case studies of biological photonic structures behaving like one-dimensional (1D) photonic crystals [3, 4]. In species where 2D photonic crystals [5] or 3D photonic crystals [6] have been identified, on the other hand, the strategy is likely to be more involved (though such a complex optimization problem deserves investigation, it will not be discussed here as we confine our study to the 1D case).
As examples of the thickness-tuning strategy, we have selected the cases of two species
belonging to different families of Coleoptera (figure 1): Chrysochra vittata (Buprestidae)
and Hopila coerula (Scarabediae). Scanning electron microscope (SEM) imaging of cleaved sections of the exocuticle on the abdomen of C. vittata (known as a ‘metallic woodboring beetle’) have revealed a stack of about twenty planar slabs of chitin—a biopolymer having refractive index n = 1.56—of approximately the same thickness [3] (figure2). Irregularities of the slab surfaces form air spacers which act as very thin junction layers of low refractive index (virtually equal to n = 1.0). In agreement with reflectance measurements, numerical simulations have shown that this periodic structure was responsible for the red colour observed at normal
3
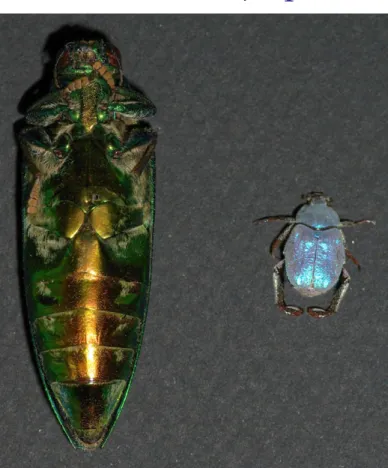
Figure 1. Specimens of Hoplia coerula (right) and Chrysochroa vittata (left). Natural 1D photonic crystal structures which were found in their outer body parts inspired us in the design of structurally tuned iridescent surfaces.
incidence, which turned to green at large angles. The important thing revealed by modelling was that the iridescence is governed by the distance between the junction layers and not by their actual composition: these layers just act as a periodic index perturbation of the bulk chitin material. Similar investigations on the scales covering the cuticle of H. coerula have revealed a stack of 22 sheets, each of them being composed of a very thin plate of bulk chitin which bears a network of parallel rods on one side [4] (figure 3). Because the rod dimensions are small as compared with the wavelength, an effective index approximation was found to be suitable for modelling the composite layers. Numerical simulations confirmed that the effective 1D structure is mainly responsible for the blue colour observed at normal incidence which turns to violet at large angles. In comparison with the Chrysochroa’s design, the Hoplia’s design involves a lower index contrast and a more balanced distribution between the thicknesses of high- and low-index layers.
Taking inspiration from this proven strategy, we have designed and fabricated periodic TiO2/SiO2multilayer films with very different iridescent aspects by tuning both the period and the layer thickness ratio. Films displaying either a reddish-to-greenish changing hue or a stable bluish hue were obtained depending on layer thickness values. The remarkable point here is that both films differ only in their structural parameters. The design of the films was carried out following an original theoretical approach for predicting the dominant reflected wavelength of periodically layered materials [7]. The fabrication of the samples was achieved with magnetron New Journal of Physics 10 (2008) 013032 (http://www.njp.org/)
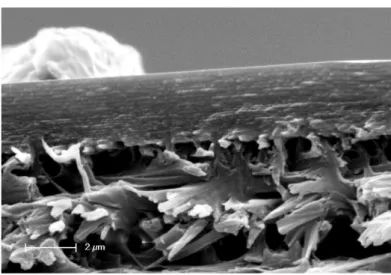
Figure 2.SEM image of a cleaved section of the exocuticle on the abdomen of
C. vittata. The photonic crystal structure consists of a stack of about twenty
planar slabs of chitin of approximately the same thickness. Irregularities of the slab surfaces form air spacers which act as very thin junction layers of low refractive index.
sputtering techniques. The characterization of the samples was performed by means of optical
measurements in specular reflection/transmission configurations and numerical modelling
using standard multilayer film theory. Finally, the iridescence was evaluated quantitatively by calculating the chromaticity coordinates at various incidence angles.
2. Design considerations
The analysis of the reflectance of multilayered materials of biological origin is greatly facilitated when the actual structure can be replaced by a semi-infinite periodic multilayer structure, i.e. a surface-terminated 1D photonic crystal. This approximation is valid as long as the refractive index contrast in the period is not too high, which is always the case for biological iridescent structures. In this case, we have derived a simple but general analytical formula for the dominant reflected wavelength which enables the amount of spectral shift this quantity experiences as the incidence angle is changed to be predicted. The derivation of this formula relies on averaging the refractive index over a period (in a long wavelength approximation) and treating the periodic index variation as a weak perturbation (details of the method can
be found in [3]). Based on this method, we have introduced the concept of spectral richness
which is defined as the spectral shift of the dominant reflected wavelength as the angle is increased from normal to grazing incidence:δλθ = λθ=0− λθ [8]. The iridescence of a
surface-terminated 1D photonic crystal can therefore be expressed in terms of the dominant reflected wavelength (λθ=0) and the spectral richness (δλθ). Both quantities are given by simple algebraic expressions involving structural and materials parameters [8]. For the analysis and the design of multilayer films, assuming that the material refractive indexes are known (n1, n2, n2> n1), it is convenient to plot maps (figure4) ofλθ=0andδλθ in a coordinate system where the abscissa is the layer thickness ratio (r = d2/d1) and the ordinate is the period (a = d1+ d2). The high-and low-refractive index materials we selected for the fabrication of multilayer films were
5
Figure 3. SEM image of the cleaved section of a scale covering the cuticle of
H. coerula. The photonic crystal structure consists of a stack of 22 sheets, each
of them being composed of a very thin plate of bulk chitin which bears a network of parallel rods on one side.
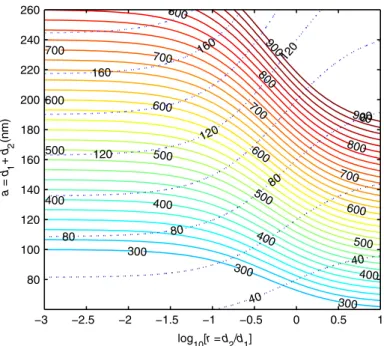
300 300 300 400 400 400 400 500 500 500 500 600 600 600 600 700 700 700 700 800 800 800 900 900 40 40 80 80 80 80 120 120 120 160 160 log 10[r = d2/d1] a = d 1 + d 2 (nm) −3 −2.5 −2 −1.5 −1 −0.5 0 0.5 1 80 100 120 140 160 180 200 220 240 260
Figure 4. Maps ofλθ=0 (solid lines) and δλθ (dotted lines) in (r ,a) coordinate
system. The spectral richness δλθ was calculated at a grazing incidence angle
θ = 80◦. The values ofλ
θ=0andδλθ are displayed in nanometres along the lines.
The calculation was carried out for transverse-electric (TE) polarization of the incident light. The refractive index were equal to n1= 1.5 and n2= 2.5.
titanium oxide and silicon oxide, respectively. At the design stage, it is reasonable to consider that, in the visible wavelength range, the refractive index of both materials are real and constant (n1= 1.5 and n2= 2.5).
The maps ofλθ=0andδλθ give us a direct estimation of the period and the layer thickness ratio we need to select for the iridescent surface to display a specific hue (dominant reflected wavelength) at normal incidence and a specific angular dependence of the hue (spectral richness). On one hand, a period lying between 200 and 230 nm with a layer thickness ratio of the order of 10−2should produce a red hue atθ = 0◦which turns to green atθ = 80◦. On the other hand, a period lying between 80 and 100 nm with a layer thickness ratio of the order of ten should produce a blue hue at θ = 0◦ which turns to violet atθ = 80◦. As discussed in [8], the layer thickness ratio is a predominant factor in determining the spectral richness: the former design (r 1) leads to a large shift of the dominant reflected wavelength (similar to the case of C. vittata) whereas the latter design (r 1) leads to a small shift (similar to the case of
H. coerula). These two designs (hereafter called C-type and H-type, respectively) will be
used for the fabrication of periodic TiO2/SiO2 multilayer films displaying radically different iridescent aspects.
3. Fabrication aspects
Layers of TiO2 and SiO2 were alternately deposited on a glass substrate by dc reactive and
radio-frequency (RF) magnetron sputtering of a titanium target (2 in., 99.99% purity) and a silicon oxide target (2 in., 99.9% purity), respectively. Magnetron sputtering is a physical vapour deposition (PVD) process in which an electrical discharge (in a vacuum chamber) between the target (cathode) and the chamber walls (grounded anode) produces a plasma. Cations from the plasma (usually Ar+) collide with the target and eject target atoms that eventually reach the substrate to form a film. In magnetron systems, a magnetic field is used to trap secondary electrons near the target surface, thereby increasing the plasma ionization rate and resulting in a higher deposition rate. Two methods are commonly used to form an oxide: dc sputtering
of a metallic target in a reactive O2 atmosphere and RF sputtering of an oxide target. The
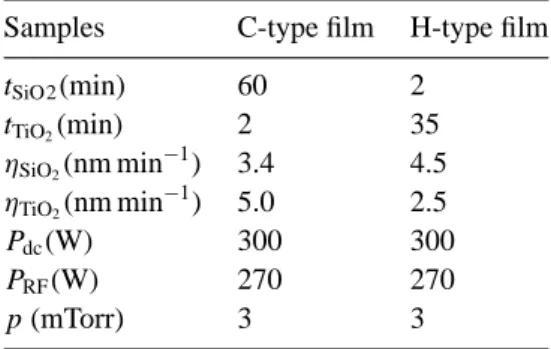
former and the latter were used for the deposition of TiO2and SiO2layers, respectively. For the reactive sputtering, the oxygen flow rate was selected in order to operate beyond the transition region of the PVD hysteresis curve (cathode voltage versus oxygen flow) where the PVD fully works in oxide deposition mode. Both depositions were carried out under argon gas flow at room temperature while the substrate (microscope glass slide) was rotated to increase the deposition uniformity. The deposition was carried out using a fully automated process control. Twelve-period multilayer films were fabricated according to two different designs (C-type and H-type). After calibration of the deposition rates of both materials, the deposition times were chosen in such a way that the thickness of a bilayer (i.e. period) corresponded to a dominant reflected wavelength in the red (C-type) or blue (H-type) region of the visible spectrum and the TiO2/SiO2 layer thickness ratio corresponded to a large (C-type) or small (H-type) shift of the dominant reflected wavelength with the angle. Actual values of the period and the layer thickness ratio were estimated from optical measurements and modelling (see below). In order to calibrate the deposition rates, successive depositions of TiO2 and SiO2 monolayers were carried out on the same substrate and the layer thicknesses were measured using surface profilemetry at the edge between deposited and protected areas. The deposition rates were then estimated by dividing the measured thickness by the deposition time. The experimental conditions are summarized in table1.
7
Table 1. Experimental conditions for the deposition of TiO2 and SiO2 layers by dc reactive and RF sputtering techniques, respectively. t: deposition time;
η: deposition rate; Pdc: dc electrical power; PRF: RF electrical power and
p: pressure.
Samples C-type film H-type film
tSiO2(min) 60 2 tTiO2(min) 2 35 ηSiO2(nm min −1) 3.4 4.5 ηTiO2(nm min −1) 5.0 2.5 Pdc(W) 300 300 PRF(W) 270 270 p (mTorr) 3 3
4. Sample characterization and modelling
In the present experimental conditions, titanium oxide and silicon oxide were deposited in the amorphous phase. Since we were essentially interested in optical properties, the physical characterization of the samples was restricted to measurements of the film thickness. Only the total thickness of the multilayer stack could be measured. Therefore, the period was estimated by dividing the measured thickness by the number of periods (a = dtot/N). Optical characterization
was carried out by means of specular reflectance/transmittance spectral measurements using a
UV-visible-NIR spectrophotometer. Specularly reflected light was measured at angles of 20◦,
40◦and 60◦using s- and p-polarized incident light. For these measurements, the light beam from
the monochromator exit slit passed through a polarizer and was directed through a symmetric arrangement of mirrors on to the sample which was mounted on a rotation stage. The reflectance (for the case of unpolarized light) was then calculated by taking the arithmetic mean of both
measurements. A MgF2-coated Al mirror (90% reflectivity from 400 to 700 nm) was used as
reference against which raw data were normalized. Transmitted light was measured at normal incidence.
Modelling of the sample reflectance/transmittance was carried out using a
thin-film-on-thick-slab approach [9]. In this approach, interference is neglected in the thick substrate but its finite thickness and complex refractive index are taken into account. In this way, transmission loss within the substrate (due to e.g. UV absorption band tail) can be modelled. Interference in the thin multilayer film, which causes the iridescence, are fully taken into account by solving Maxwell equations in planar stratified medium (for this purpose, we employed a continued-fraction method [10] that gives exactly the same results as the more popular transfer-matrix
method). Finally, the reflectance/transmittance of the film/substrate system was calculated
by combining the complex reflection and transmission coefficients of the film and of the substrate [9].
The refractive index (real part) of deposited materials were modelled using Sellmeier’s equation, i.e. n(λ) = [1 + 6(Aiλ2)/(λ2− λ2i)]
1/2. For TiO
2 layers, the Sellmeier coefficients ( Ai,λi) were determined by fitting n(λ) to measurements on amorphous titanium oxide films.
For SiO2 layers, the Sellmeier coefficients of silica (i.e. amorphous silicon oxide) were taken from the literature [11]. For both TiO2 and SiO2 layers, the imaginary part of the refractive New Journal of Physics 10 (2008) 013032 (http://www.njp.org/)
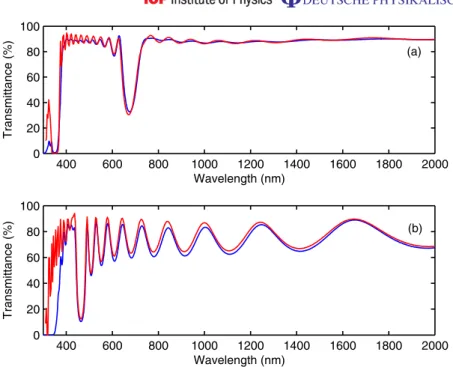
400 600 800 1000 1200 1400 1600 1800 2000 0 20 40 60 80 100 Transmittance (%) Wavelength (nm) 400 600 800 1000 1200 1400 1600 1800 2000 0 20 40 60 80 100 Transmittance (%) Wavelength (nm) (a) (b)
Figure 5.Transmittance spectra (at normal incidence) of C-type (a) and H-type (b) samples. Blue lines: measurements and red lines: best fits to data.
index was taken equal to zero, which is a reasonable assumption in the wavelength range of interest (300–2000 nm). For the glass substrate, complex refractive index data of typical soda-lime silicate glass were used [12].
With the design strategy, we chose consistently to take the thicknesses of TiO2 and SiO2 layers (d1, d2) as free parameters of the model. We chose to fit the model to transmittance measurements rather than reflectance measurements because the former gave truly the sample transmittance whereas the latter gave reflectance of the sample with respect to a reference (mirror). The best fit gave the values of d1 and d2, from which the reflectance spectrum could be predicted at any incidence angle.
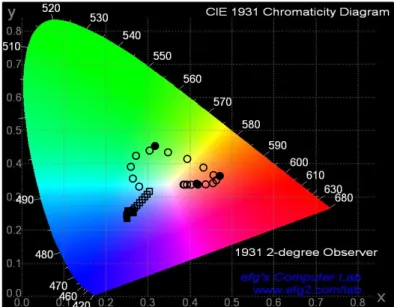
In order to evaluate the iridescence, chromaticity coordinates (x,y) were calculated from
the reflectance spectrum following a procedure described in [8]. The shift in the x and y
coordinates as the angle is varied provided the most complete description of the iridescence of the samples. We used D65 illuminant and CIE 1931 colour matching functions to calculate chromaticity coordinates and we plotted them in the CIE 1931 2-degree observer chromaticity diagram.
5. Results
Measured transmittance spectra of C-type and H-type samples are shown in figure 5. In both
samples, a clear Bragg peak is observed, which demonstrates the regularity of the period across the multilayer stack. Best fitted transmittance curves are also shown. Excellent agreement is found between data and theory in both cases and this confirms the adequacy of the model to describe the transmittance of the present film/substrate systems, even without any adjustment of the refractive indexes. The layer thickness values resulting from the fitting procedure are listed in table 2, together with the corresponding values of the period and the layer thickness
9
Table 2.Thicknesses of SiO2 layer (d1) and TiO2 layer (d2) obtained by fitting transmittance spectra. a: period; r : layer thickness ratio; dtot: measured total thickness of the film; N : number of periods.
Samples C-type film H-type film
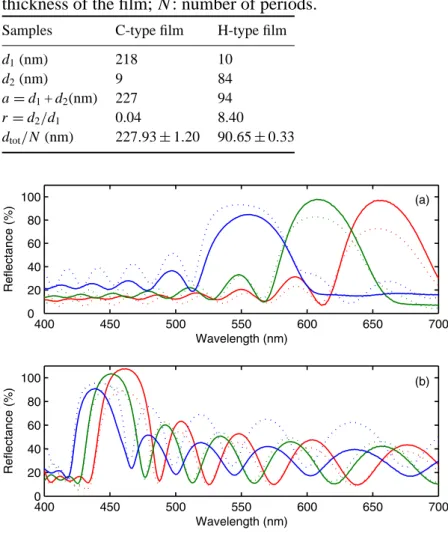
d1(nm) 218 10 d2(nm) 9 84 a = d1+ d2(nm) 227 94 r = d2/d1 0.04 8.40 dtot/N (nm) 227.93 ± 1.20 90.65 ± 0.33 400 450 500 550 600 650 700 0 20 40 60 80 100 Wavelength (nm) Reflectance (%) 400 450 500 550 600 650 700 0 20 40 60 80 100 Wavelength (nm) Reflectance (%) (a) (b)
Figure 6. Reflectance spectra of C-type (a) and H-type (b) samples. Solids lines: measurements and dotted lines: theoretical predictions. Blue, green and red curves correspond to incidence anglesθ = 20◦, 40◦and 60◦, respectively.
ratio. The period can be compared with the measured total thickness of the film divided by the number of periods. Good agreement is found between these values for both samples.
Measured reflectance spectra are shown in figure 6 in the wavelength range of interest
for the analysis of the iridescence (i.e. visible range). In the C-type sample, the Bragg peak
wavelength shifts by ∼110 nm as the angle increased from 20◦ to 60◦. In the H-type sample,
however, it only shifts by ∼20 nm. It was not possible to measure the reflectance at normal incidence. However, the angular dependence of the Bragg peak wavelength allows us to infer that, at normal incidence, C-type and H-type samples have their Bragg peak located in the red and the blue region of the visible spectrum, respectively. These behaviours are in accordance with the sample designs. Using thickness values obtained from the fitting procedure (table2), reflectance spectra were calculated at the same angles as those of the measurements. The
predicted spectra turned out to be in good agreement with the measured ones.
Figure 7. Chromaticity coordinates of C-type (circles) and H-type (squares) samples at various incidence angles. Full and open symbols correspond to measurements (θ = 20◦, 40◦ and 60◦) and predictions (from θ = 0◦ to 80◦ by
steps of 5◦), respectively.
Chromaticity coordinates were calculated from the measured spectra at θ = 20◦, 40◦ and
60◦ and from the predicted spectra at angles ranging from θ = 0◦ to 80◦ by steps of 5◦. The
results were displayed in the chromaticity diagram (figure 7). For both samples, the shifts in chromaticity coordinates with the angle, as determined from measurements and predictions, are in good agreement and exhibit the expected iridescence behaviours. According to the design, the C-type sample exhibits a reddish hue at normal incidence which turns to a greenish hue at large angles. By contrast, the H-type sample exhibits a bluish hue at normal incidence which stays bluish at large angles (the presence of side lobes on the long wavelength side of the Bragg peak is responsible for desaturation of the colour at large angles). These iridescence behaviours are reminiscent of those of C. vittata and H. coerula, respectively.
Finally, we would like to point out that more vivid colours could obviously have been obtained by depositing the layers on an opaque substrate. With such a substrate, however, we would not have had access to transmittance measurements. The extraction of structural parameters from the modelling of the transmittance spectrum was the reason we used a glass substrate.
6. Conclusion
Periodic multilayer films were fabricated by magnetron sputtering of titanium oxide and silicon oxide on glass substrates. The design of the films was inspired by multilayer structures of biological origin in which iridescence takes different aspects by tuning the layer thicknesses. The scalability of magnetron sputtering techniques and the use of the same combination of materials for displaying various iridescent aspects are significant advantages of these structurally tuned iridescent surfaces.
11
Acknowledgments
This work was supported by the EU through the FP6 BioPhot (NEST/Pathfinder) 012915
project. CV was supported as a research fellow by the Belgian National Fund for Scientific Research (FNRS). VW was supported as a scientific collaborator by the FNRS. MR was supported as a PhD student by the Belgian Fund for Industrial and Agricultural Research (FRIA). Aurélien Nonet (LARN, FUNDP) is acknowledged for his technical advice in using the PVD machine.
References
[1] Kinoshita S and Yoshioka S 2005 Structural Colors in Biological Systems—Principles and Applications (Osaka: Osaka University Press)
[2] Huang J, Wang X and Wang Z L 2006 Controlled replication of butterfly wings for achieving tunable photonic properties Nano Lett.6 2325–31
[3] Vigneron J P, Rassart M, Vandenbem C, Lousse V, Deparis O, Biró L P, Dedouaire D, Cornet A and Defrance P 2006 Spectral filtering of visible light by the cuticle of metallic woodboring beetles and microfabrication of a matching bioinspired material Phys. Rev. E73 041905
[4] Vigneron J P, Colomer J-F, Vigneron N and Lousse V 2005 Natural layer-by-layer photonic structure in the squamae of Hoplia coerulea (Coleoptera) Phys. Rev. E72 061904
[5] Vigneron J P, Colomer J F, Rassart M, Ingram A L and Lousse V 2006 Structural origin of the colored reflections from the black-billed magpie feathers Phys. Rev. E73 021914
[6] Welch V, Lousse V, Deparis O, Parker A and Vigneron J P 2007 Orange reflection from a three-dimensional photonic crystal in the scales of the weevil Pachyrrhynchus congestus pavonius (Curculionidae) Phys. Rev. E75 041919
[7] Deparis O, Vandenbem C and Vigneron J P 2007 Wide angular range operation of a dielectric multilayer film with a photonic-crystal-type defect Opt. Lett.32 686–8
[8] Deparis O, Vandenbem C, Rassart M, Welch V and Vigneron J P 2006 Color-selecting reflectors inspired from biological periodic multilayer structures Opt. Express14 3547–55
[9] Stenzel O 2005 The Physics of Thin Film Optical Spectra (Berlin: Springer)
[10] Dereux A, Vigneron J P, Lambin P and Lucas A A 1988 Polaritons in semiconductor multilayered materials
Phys. Rev. B38 5438–52
[11] Wayant R W and Ediger M N 1994 Electro-Optics Handbook (New York: McGraw-Hill) [12] Rubin M 1985 Optical properties of soda lime silica glasses Sol. Energy Mater.12 275–88