RESEARCH OUTPUTS / RÉSULTATS DE RECHERCHE
Author(s) - Auteur(s) :
Publication date - Date de publication :
Permanent link - Permalien :
Rights / License - Licence de droit d’auteur :
Bibliothèque Universitaire Moretus Plantin
Institutional Repository - Research Portal
Dépôt Institutionnel - Portail de la Recherche
researchportal.unamur.be
University of Namur
CEMS and TEM investigations of iron implanted with nitrogen
Terwagne, Guy; D'Haen, J.
Published in:
Nuclear instruments and methods in physics research B
Publication date:
1997
Document Version
Publisher's PDF, also known as Version of record
Link to publication
Citation for pulished version (HARVARD):
Terwagne, G & D'Haen, J 1997, 'CEMS and TEM investigations of iron implanted with nitrogen', Nuclear
instruments and methods in physics research B, vol. 127/128, pp. 149-152.
General rights
Copyright and moral rights for the publications made accessible in the public portal are retained by the authors and/or other copyright owners and it is a condition of accessing publications that users recognise and abide by the legal requirements associated with these rights. • Users may download and print one copy of any publication from the public portal for the purpose of private study or research. • You may not further distribute the material or use it for any profit-making activity or commercial gain
• You may freely distribute the URL identifying the publication in the public portal ?
Take down policy
If you believe that this document breaches copyright please contact us providing details, and we will remove access to the work immediately and investigate your claim.
Nuclear Instruments and Methods in Physics Research B 127/l 28 ( 19971 149- 152
ELSEVIER
CEMS and TEM investigations of iron implanted with nitrogen
G. Terwagne a**, J. D’Haen b
a URN, 22 rue Muzer, B-SOW Namur. Belgium’ IMO-LUC. Uniuersitaire Campus, B-3590 Diepenbeek, Belgium
Abstract
It is well known that the depth distribution of nitrogen implanted into iron depends strongly on the implantation conditions. Pammeters such as implanted dose or the temperature of the sample during implantation play an important role. At room temperatune and low dose of implantation, the depth distribution of nitrogen is almost Gaussian and well predicted by the binary encounter theory. When the temperature during implantation is increasing (above 80°C) diffusion process takes place and the depth profile of nitrogen is split into two components: a bulk component which corresponds to nitrogen trapped in interstitial sites of the host crystal and a surface peak due to diffusion mechanism during the implantation. Resonant Nuclear Reaction Analysis (RNRA) has been used to depth profile nitrogen and Conversion Electron Mijssbauer Spectroscopy (CEMS) as well as Transmission Electron Microscopy (TEM) have been used to characterize this surface component. Both techniques reveals the nature of the precipitation sites where nitrogen is trapped during diffusion process.
1. Introduction
Nitrogen implantation is known to enhance the tribo- logical properties of steels (reduction in wear and an increase of hardness). Typical doses of implanted species are in the range of 5 X lOI to 5 X 10” ions cm-2 and the energy used is often range from 30 keV to 300 keV.
Nitrogen implantation into pure iron has been studied
physical nature of the precipitation sites, why are there more precipitation sites near the sample surface?
In this paper, we will try to explain the influence of temperature during implantation and the nature of the precipitation sites. RNRA, CEMS and TEM will be used to investigate the implanted layer.
by different authors [l-4] and the influence of some
parameters like dose, the temperature during implantation, 2. Experimental procedure the beam intensity have also been explored. Temperature
during implantation is an important parameter and it has
been shown that thermal diffusion takes place during 2.1. Nitrogen implantation irradiation leading to nitrogen depth distribution with two
components [3]. A numerical model has been developed at the end of the last decade in order to explain the depth
Polycrystalline pure iron disk of diameter 20 mm and distribution of nitrogen [S]. This model takes into account
thickness 0.25 mm were mechanically polished with dia- for preferential sputtering, ion beam mixing, thermal diffu-
mond paste (15 and 1 pm> and then with alumina powder sion, radiation-enhanced diffusion (RES), radiation-in- (0.5 pm). They were implanted with 100 keV “N: ions duced segregation (RIS), secondary phase precipitation and
using the SAMES implanter in Namur. The vacuum in the radiolytic decomposition of the precipitates. It has been
implantation chamber of a residual pressure of 3 X lo-’ shown that the surface peak is the consequence of an Torr before the implantation and 10e6 Torr during the enhanced precipitation near the surface of the sample. In
implantation was achieved using a turbopump. A cold trap that paper some questions were still open: what is the was placed in the vicinity of the specimen in order to reduce the carbon contamination. The beam current density was of the order of 10 pA cmW2. A special sample holder allowed a specimen temperature to be between room tem- perature and 600°C + 10°C. Two samples were implanted with the same dose (1.3 X IO” “N+ cm-‘). Specimen 1
l Corresponding author. Fax: + 32-81-73-79-38; email: was heated up to 120°C during the implantation while
[email protected]. specimen 2 was kept at room temperature. 0168-583X/97/$17.00 0 1997 Elsevier Science B.V. All rights reserved
150 G. Tenvagne, J. D’Haen/Nucl. Instr. and Meth. in Phys. Res. B 127/ I28 (1997) 149-152
2.2. Nitrogen depth projiles
The nitrogen depth distributions were measured using the “N(p, cyy)‘*C nuclear resonant reaction at Er, = 429 keV. The nitrogen depth profile was obtained with an automatic energy scan installed on the 2.5 MV Van de Graaff accelerator in Namur. The -y-rays were detected in a 4” X 4” NaI(T1) scintillator. The resulting excitation curve has been deconvoluted in order to account for the reso- nance width, the beam energy distribution and the strag- gling effect [6]. The deconvolution technique h?s been presented in a previous paper [7]. The profiles were quanti- fied by comparison with a TiN standard.
over a thickness of about 100 nm thickness. A planar view TFM specimen is made of both implanted specimens. Also a non-implanted pure iron sample is thinned to study the influence of the ion milling process.
3. Results and discussion 3.1. Nitrogen depth profiles
2.3. Conversion electron Miissbauer spectroscopy mea- surements
CEMS was used to determine the different phases formed after nitrogen implantation into the iron samples. The Miissbauer measurements were made at room temper- ature using a “Co source in a rhodium matrix with an initial activity of 50 mCi. The specimen of interest was placed in a gas flow-proportional counter where 7.3 keV conversion electrons resulting from recoilless resonant ab- sorption by 57Fe nuclei within the specimen were detected. The 5.6 keV Auger electrons emitted after the electronic rearrangement following the internal conversion process were also detected. The experimental Mijssbauer spectra were deconvoluted and analyzed by means of an interac- tive computer code which allowed adjustment of the vari- ous hyperfine parameters. The velocity of the Mossbauer spectrometer was calibrated by recording the spectrum of the o-Fe phase of an iron foil.
Fig. 1 shows the deconvoluted depth profiles for both specimens. The specimen 2 implanted at room temperature (dotted line) shows a Gaussian distribution with a small peak at the surface. The experimental depth distribution can be approximated by a Gaussian peak with R, = 59 nm and AR, = 29 nm, which is close to the theoretical depth distribution predicted by TRIM code [7] (R, = 58 nm and AR, = 25 nm). For specimen 1, the nitrogen depth distri- bution can be approximated by two Gaussian components: a bulk component, with almost the same parameters of specimen 2 and a surface peak. The shape of the depth distribution has already been explain by a numerical model developed by Piette et al. [5]. The surface peak is due to thermal diffusion during implantation and precipitation at
” 26 ,
1
2.4. Transmission electron microscopy
To reveal the surface structure, a transmission electron microscopy (TEM) study has been carried out using a Philips CM12 microscope, operating at 120 kV. The im- planted pure iron samples are thinned by Ar ion milling until electron transparency. During the ion milling step the Ar ions are only impinging at the un-implanted substrate side. This allows a TEM study of the implanted surface
t
‘--c4
0.00 1
0 50 100 150 I
Depth (nm)
Fig. 1. Nitrogen depth profiles for pure iron implanted with 100
keV 15N: to a dose of 1.3X lOI7 ions cm-‘. The full line corresponds to the specimen implanted at 120°C and the dotted line to the specimen implanted at room temperature.
Table 1
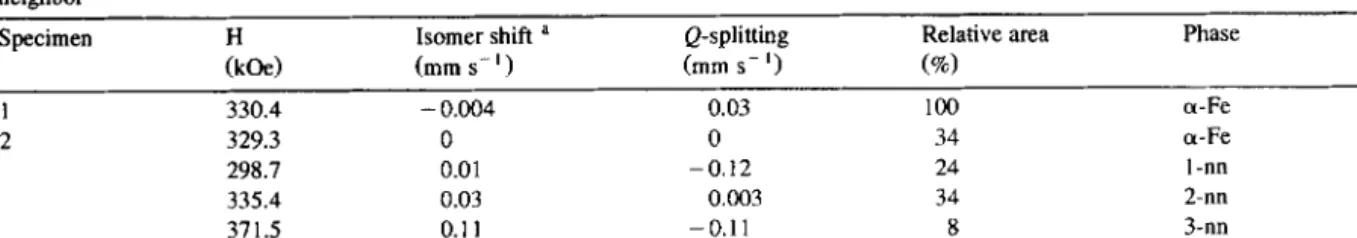
Mijssbauer parameters obtained after the deconvolution of specimens I and 2. The 1,2,3-nn indicates the first, second and third near neighbor
Soecimen H Isomer shift a Q-splitting Relative area Phase
(kOd 1 330.4 2 329.3 298.7 335.4 371.5
a With respect to u-Fe.
(mm s-‘1 (mm s- ‘1 (%o) - 0.004 0.03 loo 0 0 34 0.01 -0.12 24 0.03 0.003 34 0.1 1 -0.11 8 u-Fe a-Fe 1 -nn 2-nn 3-nn
G. Tetwagne, J. D’Haen/Nucl. Instr. and Meth. in Phys. Res. B 127/128 (1997) 149-152 151
-6 -6 -4 -2 0 2 4 6 6
Velocity (mmkec)
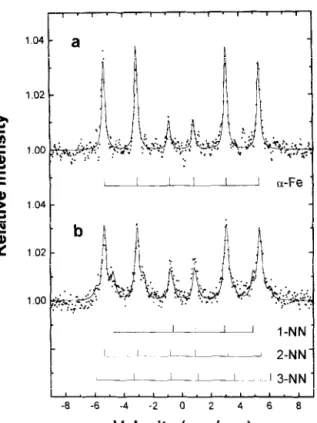
Fig. 2. CEMS spectra taken at room temperature on iron im- planted with 100 keV “N: to a dose of 1.3 X IO” ions cm-‘. The temperature during implantation was 120°C for (a) and 20°C for (b).
the surface region where defects are more important. Those precipitation sites can be due to structural defects, impurity atoms or other precipitates [5]. TEM and CEMS will be helpful in the interpretation of the precipitation sites.
3.2. Conversion electron MSssbauer spectroscopy
The spectra obtained by CEMS on both specimens are presented in Fig. 2 and the Miissbauer parameters are presented in Table 1. The spectrum in Fig. 2a, which corresponds to specimen 1, shows the a-phase of metallic iron (one sextuplet labeled a-Fe). For the sample im- planted at high temperature, it seems that nitrogen is not bounded to iron. The second spectrum presented in Fig. 2b was recorded for specimen 2. The six lines are broadened and the experimental spectrum can be simulated by four sextuplets. One sextuplet, labeled cu-Fe corresponds to the host matrix and tree sextuplets due respectively to the first, second and third nitrogen neighbor of iron. Similar results have also been observed by DeCristofaro et al. [9] for a metastabie Fe-N solid solution containing 2.83 wt% of nitrogen, which correspond to 10.5 at.% of nitrogen. This value is almost the same that the average amount of nitrogen in the implanted layer for specimen 2, which is about 10 at.%. For specimen implanted to a dose of
1.3 X lOI ions cm-’ at 2O”C, nitrogen atoms are located in the octahedra1 interstitial sites.
3.3. Transmission electron spectroscopy
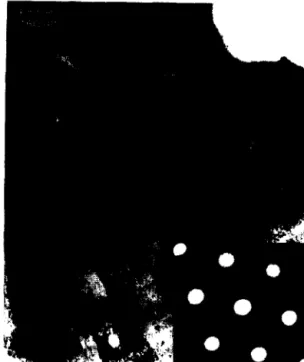
Fig. 3 shows a bright field image of specimen 1. At the left comer the edge of the Ar ion milled specimen is visible. The photograph reveals also three small holes, with a typical dimension of 50 nm, in the implanted specimen. The inset reveals the corresponding diffraction pattern with a sixfold symmetry of the diffraction spots. These spots corresponds with the (110) planes of the cy-Fe
phase. The grain under study has a B[ - 11 I] orientation. The small holes cannot be found in the Ar ion milled pure iron sample. Comparison of both thinned samples allows to formulate that the small holes are created by the implantation process and not by the Ar ion milling process afterwards. The small holes are probably caused by bub- bles in the implanted region.
Fig. 4 reveals a bright field image of specimen 2. Here the edge of the thinned specimen is visible at the right comer. In contrast with the previous figure no small holes can be found in the implanted region. The diffraction pattern, shown in the inset, shows again a sixfold symme- try of the strong spots, corresponding with the { 110) planes of the &-Fe phase. So the grain is again orientated along the B[-- 1111 axis. In contrast with the previous sample also weak spots can be found between the central spot and the six bright spots. These weak spots are situated at the
Fig. 3. Bright field TEM image of specimen 1. The diffraction pattern in the inset corresponds with a B[ - 11 I] orientation of the iron.
152 G. Tetwagne, J. D’Haen/Nucl. Instr. and Meth. in Phys. Res. B 127/?28 (19971149-152
Fig. 4. Bright field TBM image of specimen 2. The diffraction pattern in the inset corresponds with a B[ - 1111 orientation of the iron. The weak spots in the diffraction pattern are due to the long distance ordering of the nitrogen atoms in the interstitial positions of the pure iron lattice.
middle of the central spot and the strong spots and corre- spond thus with planes with a double interplanar distance. The weak spots can be explained by the ordering of interstitial nitrogen in the a-Fe lattice. Due to this long distance ordering of the nitrogen atoms, small spots appear in the diffraction pattern. The weakness of these spots is caused by the reduced electron scattering factor for nitro- gen in comparison to iron atoms.
With both results it has to be mentioned that the specimen under study has a thickness of about 100 nm. The RNRA results have revealed that the implanted region is about 100 nm thick. So the TEM pictures are originating from the whole implanted region. To have a better idea about the structure of the implanted iron as a function of the depth an XTEM (cross sectional TEM view) will be carried out in the near future.
4. Conclusions
The difference between the two iron specimens im- planted with the same dose but at different temperature
(20°C and 120°C) consists of the site of nitrogen atom in the host matrix. For the implantation at room temperature, TEM shows clearly that nitrogen occupies interstitial sites of the iron lattice and CEMS confirms this result. The sextuplet of the (Y-Fe is split into four sextuplets showing the interaction between nitrogen and the first, second and third near neighbor 57Fe atom. For the specimen implanted at higher temperature, TEM reveals that the implanted layer contains holes in which nitrogen is trapped during the implantation. No interaction between nitrogen and 57Fe can be found in the Mossbauer spectrum. The precipitation sites, which are more important in the near surface region, consist of small bubbles containing nitrogen.
Some additional investigations like depth selective con- version eiectron Mossbauer spectroscopy (DCEMS) or cross sectional TEM (XTEM) will be done in the future in order to confirm the nature of the precipitation sites in the near surface region.
Acknowlegments
The present research was supported by the Interuniver- sity Research Center (PAI) program of the Belgian Min- istry of Science Policy. Special thanks are due to Y. Morciaux and J. Nackers for their technical support.
References
[I] G. Longworth and N.E.W. Hartley, Thin Solid Films 48 (1978) 95.
[2] G. Terwagne, M. Piette P. Bertrand and F. Bodart, Mater. Sci. Eng. B 2 (1989) 195.
[3] G. Terwagne. M. Piette F. Bodart and W. Mbller, Mater. Sci. Eng. A 115 (1989) 25.
[4] D.L. Williamson, 0. Ozturk, S. Glick, R. Wei and P.J. Wilbur, Nucl. Instr. and Meth. B 59/60 (1991) 737. [S] M. Piette, G. Terwagne, W. Miiller and F. Bodart, Mater. Sci.
Eng. B 2 (1989) 189.
[6] G. Deconninck and B. Van Oystaeyen, Nucl. Instr. and Meth. 218 (1983) 165.
[7] G. Terwagne, M. Piette and F. Bodart, Nucl. Instr. and Meth. B 19/20 (1985) 145.
[8] J.P. Biersack and L. Haggmark, Nucl. Instr. and Meth. 174 ( 1980) 257.