ORIGINAL ARTICLE
The homeobox gene HLXB9 is upregulated in a morphological
subset of poorly differentiated hepatocellular carcinoma
Ludwig Wilkens&Rolf Jaggi&Caroline Hammer& Daniel Inderbitzin&Olivier Giger&Nils von Neuhoff
Received: 8 October 2010 / Revised: 9 February 2011 / Accepted: 21 March 2011 / Published online: 12 April 2011 # Springer-Verlag 2011
Abstract The prognostic outcome for hepatocellular carci-noma (HCC) remains poor. Disease progression is accompa-nied by dedifferentiation of the carcinoma, a process that is not well understood. The aim of this study was to get more insight into the molecular characteristics of dedifferentiated carcino-mas using high throughput techniques. Microarray-based global gene expression analysis was performed on five poorly differentiated HCC cell lines compared with non-neoplastic hepatic controls and a set of three cholangiolar carcinoma (CC) cell lines. The gene with the highest upregulation was HLXB9. HLXB9 is a gene of the homeobox genfamily important for the development of the pancreas. RT-PCR confirmed the upregulation of HLXB9 in surgical specimens of carcinoma tissue, suggesting its biological significance.
Interestingly, HLXB9 upregulation was primary observed in poorly differentiated HCC with a pseudoglandular pattern compared with a solid pattern HCC or in moderate or well-differentiated HCC. Additional the expression of translated HLXB9, the protein HB9 (NCBI: NP_001158727), was analyzed by western blotting. Expression of HB9 was only detected in the cytoplasm but not in the nuclei of the HCC cells. For validation CC were also investigated. Again, we found an upregulation of HLXB9 in CC cells accompanied by an expression of HB9 in the cytoplasms of these tumor cells, respectively. In conclusion, homeobox HLXB9 is upregulated in poorly differentiated HCC with a pseudoglandular pattern. The translated HB9 protein is found in the cytoplasm of these HCC and CC. We therefore assume HLXB9 as a possible link in the understanding of the development of HCC and CC, respectively.
Keywords Hepatocellular carcinoma . Cholangiocellular carcinoma . HLXB9 . Histological differentiation
Introduction
Hepatocellular carcinoma (HCC) is the fifth most common malignant tumor, with more than one million patients affected worldwide each year and a generally very poor prognosis [1,
2]. Large-scale gene expression profiling has provided important insights into the biology of HCC in recent years, and there have been advances in terms of HCC etiology, survival prediction, and the identification of signaling path-ways that could serve as therapeutic targets [3–7]. Mutations in several genes (e.g., P53, IGF2R, P16, PTEN) have been associated with the development of HCC [8].
Morphological diagnosis of HCC is guided by criteria defined in early studies still accepted as the standard for pathologists [9,10]. Over time, HCC tends to dedifferentiate
L. Wilkens
:
C. Hammer:
O. Giger Institute of Pathology, University of Bern, Murtenstr. 10,3010 Bern, Switzerland L. Wilkens (*)
Institute of Pathology, Hospitals of the Region Hannover, Haltenhoffstr. 41,
30167 Hannover, Germany e-mail: [email protected] R. Jaggi
Department of Clinical Research, University of Bern, Murtenstr. 35,
3010 Bern, Switzerland D. Inderbitzin
Department of Visceral and Transplantation Surgery, Inselspital Bern,
3010 Bern, Switzerland N. von Neuhoff
Institute of Cell and Molecular Pathology, Medical School Hannover,
morphologically. In more than half of all patients, dediffer-entiation occurs within 7–34 months of diagnosis [11, 12]. Dedifferentiation is accompanied by increasing chromosomal instability [13]. Dedifferentiation is also accompanied by the occurrence of chromosomal imbalances, such as loss of 13q, associated with loss of genes involved in cell cycle regulation and proliferation [14]. Even more dedifferentiated HCC are often difficult to separate from its cholangiocellular counter-part, i.e., cholangiocarcinoma (CC).
Because morphological dedifferentiation of HCC is associated with decreased survival time [15, 16], it is important to elucidate the processes that lead to dediffer-entiation. Towards this end, we analyzed poorly differen-tiated cell lines derived from HCC and CC, respectively, to search for candidate genes involved in dedifferentiation. Surgical specimens were included to determine whether these in vitro findings had biological relevance. Microarray-based global mRNA expression analysis was performed at first. Additional gene expression analysis, transfection- and RNA-silencing assays were done to verify the results.
Using this approach, we identified the homeobox gene HLXB9 as a gene that is likely to be involved in morphological dedifferentiation in a subset of HCC.
Methods Cell lines
The HCC cell lines HLE, HLF, Huh7, HepG2, and Hep3b were kindly provided by Stefan Kubicka (Department of Gastroenterology, Hannover Medical School, Germany). The control cell lines were HHep (Provitro, Berlin, Germany), and an immortalized hepatocytic cell line (HImo, kindly provided by Prof. Dr. Didier Trono, Ecole Polytechnique Federale de Lausanne, Switzerland). Since cryopreservation can influence gene expression status [17], experiments were performed both in freshly harvested cells and in cells that had been cryopreserved. Additionally, three CC cell lines were analyzed (EGI-1, MzCha1, TFK-1) kindly provided by Nisar Malek (Department of Gastroenterology, Hannover Medical School, Germany).
The hepatocellular origin of all HCC cell lines was confirmed by immunohistochemistry (IHC) using antibodies specific for CK8 and CK18, which are typically expressed in hepatocytic cells. CK7 and CK19 were used to exclude cholangiocellular differentiation. Ki67 was used for determi-nation of proliferative activity (all antibodies supplied by DAKO, Hamburg, Germany). IHC was performed on histological sections of cells after formalin fixation and paraffin embedding using the cell block technique (BBCBio-chemicals, Seattle, WA, USA). All HCC cell lines with the exception of Hep3b were positive for CK8 and CK18 and
negative for CK7 and CK19. Hep3b showed a positive staining for CK19. The proliferation marker Ki67 was positive in 54–88% of the nuclei of cells in all HCC cell lines. Overall, proliferative activity and pleomorphism of nuclei indicated a low differentiation (data not shown).
This was comparable for the CC cell lines. Here, antibodies for CK7 and CK 19 were giving a positive staining indicating cholangiocellular differentiation. Of the nuclei, 45–55% were positive for Ki67 also indicating a high proliferative activity.
Cell culture
Cell line HImo was maintained in DMEM plus 10% fetal calf serum supplemented with glutamine and penicillin/
streptomycin at 37°C in a 5% CO2 atmosphere using
25 cm2tissue culture flasks (TPP 90025, Oxoid, Prattelen, Switzerland). Cell line HHep was cultured in hepatocyte maintenance medium (Provitro, Berlin, Germany). Control cell lines were maintained as recommended by the supplier. Tumor cell lines were incubated in DMEM with 10% fetal calf serum supplemented with glutamine and penicillin/ streptomycin at 37°C in a 5% CO2atmosphere.
Mycoplasma infections were excluded using the Lookout Mycoplasma PCR Detection Kit (Sigma, Germany). Growth dynamics were determined by counting cells over a period of at least 7 days. Cells were harvested in the ascending part of the growth curve.
Surgical specimens
Twenty eight tumor tissues were obtained from 27 patients as surgical specimens taken for diagnostic purposes (permitted by the Ethics Committee of the University of Bern). Tissues were paraffin-embedded after 24-h fixation in 4% formaldehyde. Histological grading of tumors was performed according to the WHO criteria [18].
For comparison of results obtained in these specimens, we included also 10 samples of CC and five samples of hepatocellular adenoma (HCA). As a control five non-neoplastic tissues samples were chosen of livers ruptured due to trauma.
mRNA isolation
For mRNA expression analyses of the cell lines, total RNA was isolated using a commercially available system (Ambion, Cambridge, UK). Transcription to cDNA was performed using the High Capacity cDNA Reverse Transcription Kit (#4374966, Applied Biosystems, Rotkreuz, Switzerland).
Five 10-μm sections were used for total RNA isolation from formalin-fixed paraffin-embedded (FFPE) tissues. RNA was isolated exactly as described previously [19]. One section was
cut for H&E staining before sectioning material for mRNA isolation, and one was cut just after sectioning. This ensured the closest proximity and greatest homogeneity of tissues used for experiments. The quality and quantity of total RNA was determined photometrically (NanoDrop Technologies, Wil-mington, Germany).
Microarray analysis
A whole human genome oligonucleotide microarray kit was used for global mRNA expression analysis (array G4112F, Agilent, Waldbronn, Germany). This kit allows detection of more than 41,000 unique human transcripts. After one-color mRNA labeling and hybridization according to the supplier’s instructions, microarray images were acquired (Agilent Scanner System 2605, Waldbronn, Germany). Hybridization spots were normalized using the feature extraction software (version 9.5.3.1.) and processed as described below.
mRNA microarray data from all four cell lines and the control cell lines were further normalized and processed using GeneSpring GX software version 9.0 (Agilent, Waldbronn, Germany). GeneSpring software computes a
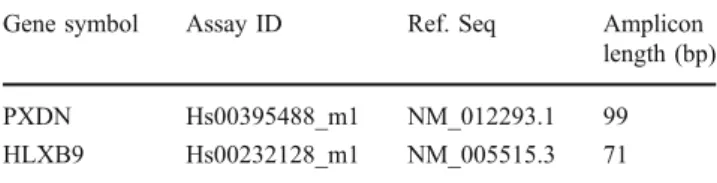
Table 1 Primers for qRT-PCR amplification using reagent concen-trations and amplification conditions as specified by Applied Biosystems
Gene symbol Assay ID Ref. Seq Amplicon length (bp) PXDN Hs00395488_m1 NM_012293.1 99 HLXB9 Hs00232128_m1 NM_005515.3 71
Gene symbol Accession no. Fold change Correctedp value Upregulated genes MNX1 NM_005515 364 0.00074790 LIN28B NM_001004317 43 0.00859069 TERT NM_198253 30 0.00976756 ELOVL7 NM_024930 18 0.00971980 PCDHB2 NM_018936 15 0.00051022 FAM184A NM_024581 11 0.00974849 PRKAA2 NM_006252 7 0.00051022 PCDHB11 NM_018931 6 0.00882593 ZCCHC2 BC006340 5 0.00406914 PCDHB13 NM_018933 5 0.00216112 SPRED2 NM_181784 4 0.00676678 DBNDD1 NM_001042610 4 0.00678942 MCM9 NM_153255 4 0.00582031 AGPAT9 NM_032717 4 0.00500372 DNMT3B NM_175850 4 0.004270845 Downregulated genes PXDN NM_012293 2,199 0.00051022 COL1A1 Z74615 587 0.00971980 RAC2 NM_002872 559 0.00032802 GREM1 NM_013372 540 0.00009805 LZTS1 NM_021020 486 0.00026493 TOX2 NM_032883 376 0.00067963 CHST2 NM_004267 308 0.00223079 BNC1 NM_001717 266 0.00047324 RNF135 NM_032322 237 0.00047324 KRT7 NM_005556 202 0.00052403 PDLIM4 NM_003687 133 0.00018231 TMTC1 NM_175861 120 0.00089063 IL7R NM_002185 113 0.00042864 CDCP1 NM_022842 110 0.00348664 AR NM_000044 93 0.00029425
Table 2 Genes found to be significantly (p<0.01) up-(n=54) or downregulated (n=125) in hepatocellular carcinoma compared to non-neoplastic cell lines using the unpairedt test (asymptotic) corrected for multiple testing (Benjamini–Hochberg correction)
The 15 genes with the highest fold changes for up- or downregulation, respectively, are listed here
unique value for each miRNA and mRNA by taking the average of replicates spotted on the microarrays. Specimens were normalized using median normalization. HCC cell lines were taken together as one group and non-neoplastic hepatocytic cell lines as a second group. The mRNAs with a positive or negative fold change >1.5 between these two groups were further analyzed for significantly different expression using an unpaired t test and the Benjamini– Hochberg calculation for multiple test controls to reduce false positive results. The level of significance was set at p<0.01.
qRT-PCR
Quantitative reverse transcription-polymerase chain reac-tion (qRT-PCR) using mRNA obtained from cell lines was performed using the TaqMan® Universal PCR Master Mix AmpErase® (#4324018, Applied Biosystems, Rotkreuz, Switzerland) and the primers listed in Table1. The cycling conditions were set as instructed by the supplier. A real-time PCR system (7500, Applied Biosystems, Rotkreuz, Switzerland) was used for quantification.
mRNA from FFPE samples was measured using a SuperScript™ III Platinum® One-Step qRT-PCR Kit follow-ing the instructions of the supplier (#11732020, Invitrogen, Basel, Switzerland). A 7500 Fast System (Applied Biosys-tems, Rotkreuz, Switzerland) was used for quantification. siRNA-based knock down of gene expression
HLXB9 was selectively suppressed by siRNA experiments using a commercially available system (On-TARGETplus SMARTpool system, Dharmacon, Chicago, IL, USA) with a specific siRNA (Human HLXB9, DHARMACON). As a negative control from the same supplier, we used the
“On-TARGETplus siCONTROL Non-targeting POOL”
reagents. mRNA of the manipulated cells was isolated as described above.
Transfection experiments
Immortalized hepatocytic cell line was transfected with the pCMV5-HLXB9 expression vector using the TurboFectin 8.0 reagent (Origene, Rockville, MD, USA). The media and transfection components were used exactly as specified by the supplier. The pCMV5 vector without the HLXB9 was transfected as a negative control.
Separation of subcellular compartment proteins
The Qproteome cell compartment kit (Qiagen, Hilden, Germany) was used to separate proteins in the following cellular compartments: cytosol, membranes, and nucleus. About 1×10⁷cells were harvested and lysed in accordance with the Qiagen protocol. All buffers were supplemented
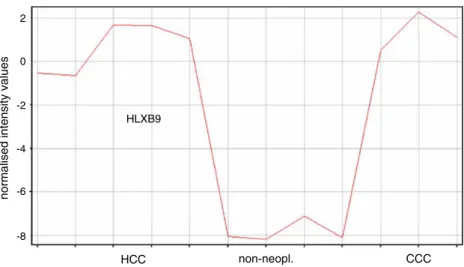
HCC non-neopl. CCC
normalised intensity values
2 0 -2 -4 -6 -8 HLXB9
Fig. 1 Graphical illustration of intensity values obtained for HLXB9 by microarray-based expression analysis in HCC and CC cell lines. Comparison was done to non-neoplastic cell lines. Dysregulation of HLXB9 is similar in both, HCC and CC cell lines RT-PCR 0 5 10 15 20 25 30 35 HepG2 PXDN Huh7 PXDN HLE PXDN HLF PXDN Hep3b PXDN H15A PXDN H15A cryo PXDN HI PXDN
HI cryo PXDN HepG2 HLXB9 Huh7 HLXB9 HLE HLXB9 HLF HLXB9 Hep3b HLXB9 H15A HLXB9
H15A cryo HLXB9 HI HLXB9 HI cryo HLXB9 > Controls HCCs
Fig. 2 qRT-PCR confirmed the results of microarray-based expression analysis. RT-PCR analysis was conducted on the two genes with the highest fold changes in hepatocellular carcinoma (HCC) cell lines: PXDN, which was downregulated, and HLXB9, which was upregulated
with protease inhibitors (as per the protocol) and 1 mM NaVO3 as a phosphatase inhibitor. The resulting proteins from each subcellular compartment were concentrated and desalted by acetone precipitation. The pellets were then resuspended in the appropriate buffer, which depended on the analysis. Protein concentration was measured photomet-rically (Biophotometer, Eppendorf, Hamburg, Germany). Protein concentration in each sample was measured directly by Bradford assay before SDS-PAGE (sodium dodecyl sulfate polyacrylamide gel electrophoresis).
Immunoblot analysis
Proteins were separated by SDS-PAGE on 10% gels. A prestained PageRuler protein ladder (#SM0671, Fermentas, Germany) was included on each gel to standardize the molecular weights of proteins in the samples. Following
protein transfer to nitrocellulose membranes (Amersham Bioscience GmbH, Freiburg, Germany), the blots were incubated with a monoclonal antibody against HB9 (ab79541, ABCAM, Germany). To verify that proteins in subcellular compartments had been separated efficiently, antibodies against marker proteins for the compartments were used: anti-GAPDH (Santa Cruz Biotechnology, Santa Cruz, CA, USA) for the cytosolic compartment and anti-actin (#69100, MP Biomedicals, Ohio) for the nuclear compart-ment. HLXB9 (48 kDa) and actin (42 kDa) are similar in size; therefore the actin antibody was incubated subsequent to the HB9 antibody. Following incubation with a peroxidase-conjugated secondary antibody (Amersham, Germany), the blots were developed using an electrochemiluminescence detection kit (Perkin Elmer, Boston, MA, USA). Blot results were scanned using a standard scanning device HP5470c (Boeblingen, Germany). The digitized intensities were
subse-Gene symbol Accession no. Fold change Correctedp value Upregulated genes KLK10 NM_002776 2,944 0.00087690 TACSTD2 NM_002353 2,527 0.00455577 SPINT2 NM_021102 2,219 0.00058975 MALL NM_005434 1,913 0.00648792 GPR110 NM_153840 820 0.00485874 RAB25 NM_020387 688 0.00030306 ALDH1A3 NM_000693 653 0.00166345 RAC2 NM_002872 630 0.00224070 C19orf33 NM_033520 468 0.00284474 CDCP1 NM_022842 415 0.00305156 RNF135 NM_032322 415 0.00052486 BACE2 NM_012105 382 0.00168082 KLK10 NM_002776 360 0.00287167 GJB3 NM_024009 347 0.00061644 FXYD3 NM_005971 343 0.00966693 Downregulated genes SDC2 NM_002998 1,620 0.00127171 GPC6 NM_005708 1,056 0.00281812 ACSS3 NM_024560 596 0.00348787 CDH2 NM_001792 399 0.00394804 LIN28B NM_001004317 387 0.00058975 EFHA2 NM_181723 376 0.00101820 MPDZ NM_003829 229 0.00052486 NID1 NM_002508 205 0.00168082 CBS NM_000071 180 0.00505487 ZIK1 NM_001010879 175 0.00140458 CBS NM_000071 131 0.00291453 DCDC2 NM_016356 127 0.00459634 LIN28B NM_001004317 118 0.00147870 ELOVL2 NM_017770 109 0.00532469 MYEF2 NM_016132 91 0.00201893
Table 3 Genes found to be significantly (p<0.01) up-(n=986) or downregulated (n=191) in hepatocellular carcinoma compared to cholangiocarcinoma cell lines using the parameter as described above
The 15 genes with the highest fold changes for up- or down-regulation, respectively, are again listed here
quently analyzed and quantified using the ImageJ 1.36b software (http://rsb.info.nih.gov/ij).
Results
Microarray-based mRNA analysis
Global mRNA expression analysis results were compared at first in HCC tumor cell lines and non-neoplastic hepato-cytic cell lines (all raw data can be obtained as additional files from the authors). After use of the unpaired t test corrected for multiple testing (Benjamini–Hochberg) for all
genes with a fold change >2, we identified 54 genes that were significantly up-and 125 genes that were significantly downregulated (p<0.01) in tumor cell lines (Table2). The highest fold changes were seen for MNX1 (also known as HLXB9) mRNA, which was upregulated 364-fold, and for PXDN mRNA, which was downregulated 2,199-fold
(Fig. 1). qRT-PCR was used to confirm these results
(Fig. 2).
We then looked for differential expression of HCC cell lines compared to CC cell lines. Using the same criteria as described above, 986 genes were up- and 191 genes were downregulated, respectively (Table3).
Comparing CC cell lines with non-neoplastic cell lines led to the detection of 623 upregulated genes and 388
downregulated genes (Table 4). Again MNX1 (HLXB9)
was found upregulated with a high fold change of 572. In contrast PXDN was not dysregulated significantly. HLXB9 expression in cell lines
Since HLXB9 is a known homeobox gene involved in the development of the pancreas and, most likely, cholangiocytes [20], and was found upregulated in both HCC cell lines and CC cell lines, further analysis was focused onto this gene. For confirmation of the microarray based results, we selectively knocked down expression of HLXB9 in HCC cell lines by RNA interference using a known specific RNA primer. This led to the most significant decrease of HLXB9 when using a concentration of 200 mM for 24 h of incubation. HLXB9 was downregulated then to 12–29% in HCC cell lines and to 18–43% in CC cell lines, respectively (Fig. 3). We next transfected the immortalized hepatocytic cell line with a pCMV5-HLXB9 vector. Microarray-based mRNA analysis detected a 2,383-fold increase in HLXB9
Down regulation of HLXB9 0 20 40 60 80 100 120
control siRNA no target siRNA HLXB9
% down regulation HLE HLF HepG2 Hep3b EGI-1 MzCha1 TFK-1
Fig. 3 siRNA-based knock down of HLXB9 in hepatocellular carcinoma (HCC) cell lines. Using specific siRNAs, HLXB9 was knocked down by 12–29% compared to controls defined as 100%. The greatest inhibition of HLXB9 was observed after 12 h with 200 mM siRNA. In CC cell lines, downregulation was in the range of 19–42%
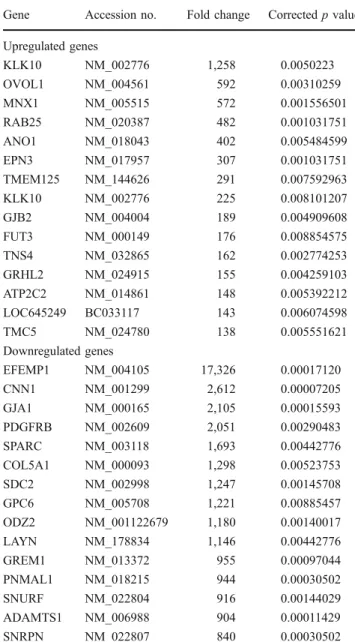
Table 4 Comparing CC cell lines with non-neoplastic cell lines revealed 623 genes upregulated and 388 genes downregulated Gene Accession no. Fold change Correctedp value Upregulated genes KLK10 NM_002776 1,258 0.0050223 OVOL1 NM_004561 592 0.00310259 MNX1 NM_005515 572 0.001556501 RAB25 NM_020387 482 0.001031751 ANO1 NM_018043 402 0.005484599 EPN3 NM_017957 307 0.001031751 TMEM125 NM_144626 291 0.007592963 KLK10 NM_002776 225 0.008101207 GJB2 NM_004004 189 0.004909608 FUT3 NM_000149 176 0.008854575 TNS4 NM_032865 162 0.002774253 GRHL2 NM_024915 155 0.004259103 ATP2C2 NM_014861 148 0.005392212 LOC645249 BC033117 143 0.006074598 TMC5 NM_024780 138 0.005551621 Downregulated genes EFEMP1 NM_004105 17,326 0.00017120 CNN1 NM_001299 2,612 0.00007205 GJA1 NM_000165 2,105 0.00015593 PDGFRB NM_002609 2,051 0.00290483 SPARC NM_003118 1,693 0.00442776 COL5A1 NM_000093 1,298 0.00523753 SDC2 NM_002998 1,247 0.00145708 GPC6 NM_005708 1,221 0.00885457 ODZ2 NM_001122679 1,180 0.00140017 LAYN NM_178834 1,146 0.00442776 GREM1 NM_013372 955 0.00097044 PNMAL1 NM_018215 944 0.00030502 SNURF NM_022804 916 0.00144029 ADAMTS1 NM_006988 904 0.00011429 SNRPN NM_022807 840 0.00030502
Within the group of 15 genes with the highest fold changes HLXB9 is again found
mRNA in the transfected cells. Immunoblot analysis for HB9 revealed a clear band at 48 kDa; this band was not seen in non-transfected cells (Fig. 4). Applying the pCMV5 vector only was giving negative results. We assumed HLXB9 as identified correctly by these experiments.
Consistent with the results on mRNA expression level, HCC and CC cell lines were also positive on the protein level for HB9; HB9 was detected in the cytoplasmic and cell membrane fractions, but not in the nuclear fraction
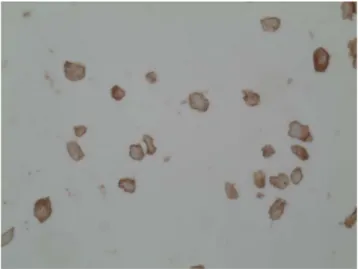
(Fig. 5). This was confirmed by immunohistochemical
analysis of HB9. HB9 staining was observed in the cytoplasm but not in the nuclei (Fig.6).
HLXB9 and HB9 in surgical HCC specimens
Based on our findings, we surmised that HLXB9 was stably upregulated in HCC and CC cell lines. We next examined
HLXB9/HB9 expression in surgical HCC specimens that had not been cultured by analyzing 29 surgical HCC specimens from 28 patients as well as non-neoplastic liver tissue from the same patients.
None of the 17 moderately or well-differentiated HCC tissues expressed HLXB9 mRNA, nor did the corresponding non-neoplastic tissues (Table 5). In contrast, 5/12 samples with low histological differentiation (Edmondson grade III or
IV) [10] demonstrated HLXB9 mRNA upregulation. The
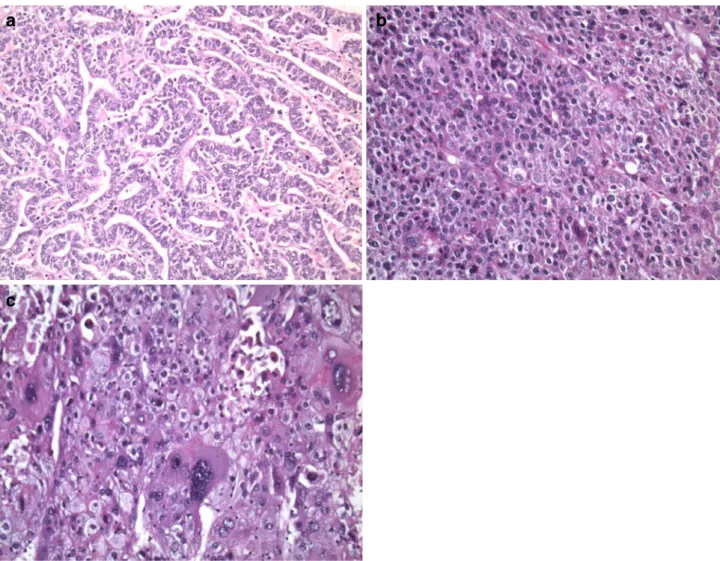
ΔΔct values were generally ∼22. An exception was case B07-2284. Two samples were analyzed: one showed no upregulation of HLXB9 mRNA; the other specimen showed an upregulation compared to the non-neoplastic tissue. Interestingly, the B07-2284 tumor without upregulation had a solid growth pattern, whereas the tumor with upregulation had a pseudoglandular pattern (Fig.7).
We reevaluated all other poorly differentiated HCC and found that poorly differentiated HCC that lacked HLXB9 upregulation grew in a solid pattern. Two of these HCC
48 kDa
37 kDa
-HepG2
F0 F1 F2 F3 F0 F1 F2 F3 F0 F1 F2 F3 F0 F1 F2 F3 F0 - total protein cell lysate
F1 - cytoplasm proteins F2 - membrane proteins F3 - nuclei protein HB9 GAPDH 72 kDa 55 kDa 40 kDa 35 kDa -HB9 (48 kDa) actin (43 kDa) Huh7 HLF HLE Fig. 5 HB9 immunoblot analysis of four hepatocellular carcinoma (HCC) cell lines after separation of proteins in the sub-cellular compartments (Tot total cell lysate,Cyt cytoplasm, M membranes,N nuclei). HB9 was only detected in cytoplasmic and membrane fractions but not in the nuclei of carcinoma cells. As an internal control GAPDH was used. Since this gene is not expressed in nuclei actin was used as an additional control for this compartment
%: immortalized hepatocytic cell line not transfected
* :
immortalized hepatocytic cell line transfected with a pCMV5-HLXB9 vector control* control% 104 97 50 37 kDaFig. 4 Transfection of cell line HImo with the pCMV5-HLXB9 expression vector resulted in HB9 expression. The immunoblot shows non-transfected and pCMV5-HLXB9-transfected cells
Fig. 6 Immunohistochemical detection of HB9 in Hep3b cells. HB9 was detected in the cytoplasm but not in the nuclei
(B04-10840 and B05-24972) demonstrated remarkable pleomorphic nuclei. In turn, poorly differentiated HCC with upregulated HLXB9 mRNA demonstrated a pseudo glandular pattern of growth. Indeed, two of these HCC were difficult to differentiate from CC (B07-23968 and B08-4419). Therefore, IHC for CK7 and CK19, respec-tively, was done for these cases to exclude CC and probably find progenitor cell derived subtype as described by Lee et al. [21]. These stainings were giving variable results with B08-4419 negative for CK7 and positive for CK19 and B07-23968 positive for both markers as given in Table6
and demonstrated in Fig.8. Variable findings occurred also for the other three HCC analyzed as listed in that Table.
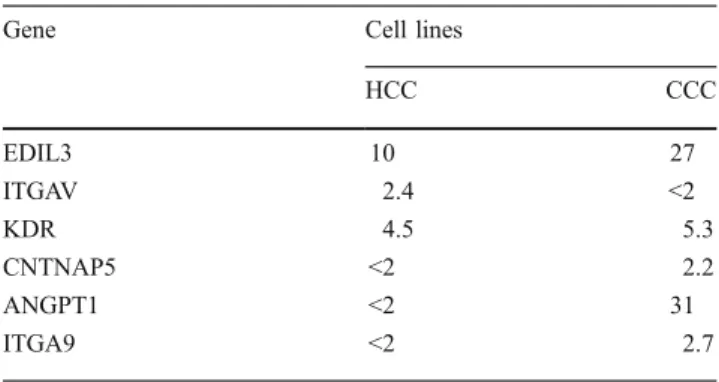
In a very recently published paper of Wildenhain et al. analyzing HLXB9-TEL positive acute myeloid leukemia in children EDIL, ITGAV, KDR, SIGLEC6, CNTNAP%, ANGPT1, DSG, and ITGA9, respectively, were detected as upregulated. Since these genes are active in cell–cell
contact, we reevaluated our data for these genes. Indeed we found EDIL, ITGAV, KDR, CNTNAP5, ANGPT1, ITGA as upregulated in HCC and/or CCC, too. Detailed data are given in Table7.
HLXB9 in surgical CC, HCA, and non-neoplastic specimens
Upregulation of mRNA encoding HLXB9 was found in 1/10 CC sample as listed in Table 8. In this sample, a clearly glandular pattern of growth with moderately to low differen-tiated tumor cells were seen. Two other CC with glandular pattern were well or moderately differentiated. Six CC revealed a solid growth pattern. No upregulation of HLXB9 was found in HCA and non-neoplastic liver samples.
Discussion
The morphological characteristics of HCC have been well-established since Edmondson and Steiner published their basic grading system in 1954 [9]. Most HCC demonstrate moderate differentiation at the time of surgical intervention. Well-differentiated HCC are rare, making up fewer than 10% of all HCC cases. In contrast, dedifferentiated HCC are seen more frequently as the disease progresses [11,12]. Since dedifferentiation is accompanied by decreased sur-vival time [15, 16], we wished to gain insights into the mechanisms underlying dedifferentiation.
Molecular analysis of HCC biopsies is hampered by the accompanying non-neoplastic cells and by the variable morphological differentiation of the carcinomas. To avoid these issues, we began our investigation with HCC cell lines. All of these HCC cell lines were highly proliferative, which we assumed as an indicator of dedifferentiation beside the pleomorphism of these cells.
Microarray-based mRNA expression analysis of these cell lines identified a set of 54 upregulated and 125 downregulated genes in HCC. The HLXB9 gene was the most upregulated and had the highest fold increase of any gene. HLXB9 is an evolutionarily highly conserved homeobox gene that belongs to the MNX gene class [22]. It is involved in differentiation of beta cells [20] and motor neurons [23, 24]. During mouse embryonic development, HLXB9 is expressed at somite day 8 in the notochord, the dorsal gut endoderm, and the ventral endoderm at the prospective pancreatic anlage [25]. Despite PDX1 muta-tions that prevent pancreas development, the initial stadium of the pancreas anlage is still developing when HLXB9 is functionally expressed. HLXB9 is detected in a dorsal– ventral gradient during embrogenesis of mice [26]. This is in concordance with the observation that mice lacking HLXB9 are missing dorsal pancreas rudiments. HLXB9
Table 5 Expression of HLXB9 in HCC surgical specimens Case HLXB9ΔΔ-ct values Histological grade
B08-4628 n.u. 2 B07-24021 n.u. 2 B04-17547 n.u. 1 B06-28291 n.u. 2 B08-3896 n.u. 2 B06-24377 n.u. 2 B05-9393 n.u. 2 B04-24966 n.u. 2 B04-1095 n.u. 2 B04-1420 n.u. 2 B03-15870 n.u. 2 B03-15602 n.u. 2 B05-25757 n.u. 2 B03-12301 n.u. 2 B03-15870 n.u. 2 B03-10403 n.u. 2/3 B03-20246 n.u. 2 B06-26164 n.u. 3 B05-24806 n.u. 3 B04-10840 n.u. 3 B05-24972 n.u. 3 B03-22359 n.u. 3 B07-2284 I n.u. 3 B07-23968 23.0 3 B07-2284 II 22.3 3 B08-4419 23.7 3 B06-11514 24.9 3 B08-2087 23.9 3
n.u. Not upregulated. ΔΔct values >35 in both, tumor and non-neoplastic tissues
Table 6 Immunohistochemical stainings for CK7 and CK19 in HCC samples found upregulated for HLXB9
Case Detectable staining for
CK7 CK19 B07-23968 Yes Yes B07-2284 II No Patchy B08-4419 No Yes B06-11514 Patchy No B08-2087 No No
Staining pattern was variable. Beside cases with positive staining in all cells and cases without any positive cells there were tumor samples with variable expression of cytokeratins as named“patchy” here and demonstrated in Fig.8
Fig. 8 Immunohistochemical staining of case 2294–07 for CK7. Ductular reactions serve as an internal positive control. Tumor cells are giving a variable“patchy” pattern
a
b
c
Fig. 7 Morphology of poorly differentiated HCC (a–c). In a, a pseudoglandular pattern is found; in b, a solid pattern is shown; in c, solid pattern with highly irregular nuclei of HCC is demonstrated. In cases of pseudoglandular pattern upregulation of HLXB9 was detectable
mutations are rare and cause Currarino syndrome, an autosomal dominant congenital malformation that causes anorectal malformations and sacral agenesis [27].
In malignant transformed cells such as Hodgkin lym-phoma cell lines, HLXB9 activates IL6 and is regulated by PI3K signaling that involves E2F3 [28]. van Bergh et al. reported a high incidence of t(7;12)(q36;p13) in infant AML with a poor outcome and ectopic expression of HLXB9. HLXB9 upregulation is mirrored by an intracel-lular shift away from the periphery (cytoplasm) to a more central position in the nucleus [29]. It is of high interest, that activation of IL6 together with NF-κB and
dysregula-tion of miRNAs Lin28, and Let-7 can lead to an epigenetic shift involved in the development of a neoplastic growth of tumor cells [30]. Although we did not find direct evidence of upregulation of IL6 in the cell lines analyzed here, we assume this as an important point to consider for further research purposes.
We confirmed upregulation of HLXB9 in surgical HCC specimens in a subgroup of poorly differentiated HCC with a pseudoglandular pattern of growth. Indeed, in two samples, it was not easy to differentiate HCC from CC. We therefore looked also for expression of CK7 and CK19, since these intermediar filaments are expressed in CC and also in a subset of HCC with impaired clinical outcome [21]. Interestingly, those samples revealing upregulation of HLXB9 in our study expressed at least one of these cytokeratins in a uniform or patchy pattern. As demonstrated in the study mentioned above, this subset of HCC reveals gene expression patterns of hepatoblasts. Differentiation of hepatocytes and cholan-giocytes is not finished at this time which is in concordance with the assumption that tumors cells of this particular group of HCC derive from a progenitor cell. Unfortunately in the article mentioned above, photographs of immunostainings are not given for direct comparison. Nevertheless, we assume this as an important aspect worth spending further efforts on. In contrast, to HCC with pseudo glandular pattern, HCC revealing solid growth were not associated with increased expression of HLXB9, nor were moderate- or well-differentiated HCC. By these findings, we speculate that poorly differentiated HCC with a pseudoglandular
Case Histological diagnosis Histological pattern Grade HLXB9ΔΔ-ct values
B04-17723 CC Solid G3 n.u. B05-11029 CC Glandular G1 n.u. B05-32694 CC Solid/trabecular G2 n.u. B06-1266 CC Solid/trabecular G2 n.u. B06-6539 CC Solid/trabecular G2 n.u. B06-11307 CC Glandular G2 n.u. B06-14496 CC Solid/trabecular G2 n.u. B07-4482 CC Solid/trabecular G2 n.u. B07-5154 CC Glandular G2-3 11,7 B07-13723 CC Solid/trabecular G2 n.u. B09-14730 HCA n.u. B07-13618 HCA n.u. B06-15259 HCA n.u. B01-19096 HCA n.u. B04-30498 HCA n.u. B03-29375 Non-neoplastica n.u. B05-12945 Non-neoplastic n.u. B05-29110 Non-neoplastic n.u. B09-19946 Non-neoplastic n.u. B09-31593 Non-neoplastic n.u. Table 8 Expression of HLXB9 in samples of CC, HCA, and non-neoplastic liver specimens
n.u. Not upregulated. ΔΔct val-ues >35 in both, tumor and non-neoplastic tissues
a
Obtained from livers ruptured due to trauma
Table 7 Wildenhain et al. reported eight genes upregulated in HLXB9/TEL translocated childhood AML
Gene Cell lines
HCC CCC EDIL3 10 27 ITGAV 2.4 <2 KDR 4.5 5.3 CNTNAP5 <2 2.2 ANGPT1 <2 31 ITGA9 <2 2.7
These genes are acting in cell–cell contact. Six of these genes were also found upregulated in HCC and/or CCC cell lines in our study with the fold changes given below. EDIL3 war remarkable highly expressed in CCC as discussed in the text
pattern could reflect an mRNA expression pattern that is related to a cholangiolar expression pattern. This would be in concordance with the finding of upregulation of HLXB9 in the CC cell lines examined here since growth of both carcinoma types in one tumor has been reported repeatedly, HLXB9 could be a link [10]. Further, hepatocytes and cholangiocytes are assumed to be derived from hepatoblast/ oval cells, since the same progenitor cells localize to the ductal plate area [31].
Interestingly, all HCC cell lines, but only half of the surgical specimens of poorly differentiated HCC demon-strated HLXB9 upregulation. This raises the question of whether there is a bias in terms of the morphological subtype of the HCC cell line. This may be related to the observation that HCC tumor cells are difficult to establish in vitro. It seems likely that a particular subtype of HCC cell is needed for successful growth in vitro. Since the cell lines analyzed here were grown as suspensions, we cannot address this question at this time.
Very recently Wildenhain et al. [32] reported the
expression of cell–cell interacting genes upregulated in childhood acute myeloid leukemia bearing a HLXB9-TEL translocation and HB9 overexpression. They found an upregulation of eight genes, six of them upregulated at least twofold in HCC and/or CCC cell lines in our study, too. EGF-like repeats and discoidin I-like domains 3 (EDIL3) was found upregulated highest in both tumor types. This gene encodes the protein of an integrin ligand. It is important in mediating angiogenesis and probably plays a role in vessel wall remodeling and development (as describe in RefSeq). Interestingly, EDIL3 is correlated to a shorter survival of HCC patients as reported by Sun et al. [33]. As HCC and CCC of low differentiation are correlated to a shorter survival of patients and also express HLXB9 in a number of such tumors as shown here, it may be speculated that there could be a link. Unfortunately, Sun et al. did not provide their data in regard to the grading of the tumors analyzed.
In conclusion, HLXB9 is significantly upregulated in HCC and CCC cell lines and in poorly differentiated HCC with a pseudoglandular pattern. The protein encoded by HLXB9, HB9, is found only in the membrane and cytoplasm of these tumor cells. This observation may provide insights into the mechanism(s) underlying devel-opment of malignancy and dedifferentiation in hepatocel-lular and cholangiolar cells.
Conflict of interest The authors declare that they have no conflict of interests.
Funding This work was supported by the Schweizerischer Natio-nalfonds (SNF, grant 31003A-118065).
References
1. Schirmacher P, Dienes HP (1999) Hepatocellular carcinoma. In: Kurzrock R, Talpaz M (eds) Molecular biology in cancer medicine. Dunitz, London, pp 355–366
2. El-Serag HB (2002) Hepatocellular carcinoma: an epidemiologic view. J Clin Gastroenterol 35(5 Suppl 2):72–78
3. Wu CG, Salvay DM, Forgues M, Valerie K, Farnsworth J, Markin RS, Wang XW (2001) Distinctive gene expression profiles associ-ated with hepatitis B virus × protein. Oncogene 20:3674–3682 4. Smith MW, Yue ZN, Geiss GK, Sadovnikova NY, Carter VS, Boix L,
Lazaro CA, Rosenberg GB, Bumgarner RE, Fausto N, Bruix J, Katze MG (2003) Identification of novel tumor markers in hepatitis C virus-associated hepatocellular carcinoma. Cancer Res 63:859–864 5. Okabe H, Satoh S, Kato T, Kitahara O, Yanagawa R, Yamaoka Y,
Tsunoda T, Furukawa Y, Nakamura Y (2001) Genome-wide analysis of gene expression in human hepatocellular carcinomas using cDNA microarray: identification of genes involved in viral carcinogenesis and tumor progression. Cancer Res 61:2129–2137 6. Iizuka N, Oka M, Yamada-Okabe H, Hamada K, Nakayama H, Mori N, Tamesa T, Okada T, Takemoto N, Matoba K, Takashima M, Sakamoto K, Tangoku A, Miyamoto T, Uchimura S, Hamamoto Y (2004) Molecular signature in three types of hepatocellular carcinoma with different viral origin by oligonu-cleotide microarray. Int J Oncol 24:565–574
7. Neo SY, Leow CK, Vega VB, Long PM, Islam AF, Lai PB, Liu ET, Ren EC (2004) Identification of discriminators of hepatoma by gene expression profiling using a minimal dataset approach. Hepatology 39:944–953
8. Thorgeirsson SS, Grisham JW (2002) Molecular pathogenesis of human hepatocellular carcinoma. Nat Genet 31:339–346 9. Edmondson HA, Steiner PE (1954) Primary carcinoma of the liver: a
study of 100 cases among 48,900 necropsies. Cancer 7:462–503 10. Ishak KG, Goodman ZD, Stocker JT (2001) Tumors of the liver
and intrahepatic bile ducts, vol. 31, 3rd edn. Armed Forces Institute of Pathology, Washington
11. Kenmochi K, Sugihara S, Kojiro M (1987) Relationship of histologic grade of hepatocellular carcinoma (HCC) to tumor size, and demonstration of tumor cells of multiple different grades in single small HCC. Liver 7:18–26
12. Sugihara S, Nakashima O, Kojiro M, Majima Y, Tanaka M, Tanikawa K (1992) The morphologic transition in hepatocellular carcinoma. A comparison of the individual histologic features disclosed by ultrasound-guided fine-needle biopsy with those of autopsy. Cancer 70:1488–1492
13. Wilkens L, Flemming P, Gebel M, Bleck J, Terkamp C, Kreipe H, Schlegelberger B (2004) Induction of aneuploidy by increasing chromosomal instability during dedifferentiation of hepatocellular carcinoma. Proc Natl Acad Sci USA 101:1309–1314
14. Skawran B, Steinemann D, Weigmann A, Becker T, Flik J, Kreipe H, Schlegelberger B, Wilkens L (2008) Gene expression profiling in hepatocelluar carcinoma: coordinated up-regulation of genes local-ised in amplified chromosome regions. Mod Pathol 21:505–516 15. Nzeako UC, Goodman ZD, Ishak KG (1995) Comparison of
tumor pathology with duration of survival of North American patients with hepatocellular carcinoma. Cancer 76:579–588 16. Lauwers GY, Terris B, Balis UJ, Batts KP, Regimbeau JM, Chang
Y, Graeme-Cook F, Yamabe H, Ikai I, Cleary KR, Fujita S, Flejou JF, Zukerberg LR, Nagorney DM, Belghiti J, Yamaoka Y, Vauthey JN (2002) Prognostic histologic indicators of curatively resected hepatocellular carcinomas: a multi-institutional analysis of 425 patients with definition of a histologic prognostic index. Am J Surg Pathol 26:25–34
17. Alexandre E, Viollon-Abadie C, David P, Gandillet A, Coassolo P, Heyd B, Mantion G, Wolf P, Bachellier P, Jaeck D, Richert L
(2002) Cryopreservation of adult human hepatocytes obtained from resected liver biopsies. Cryobiology 44:103–113
18. Ishak KG, Anthony PP, Sobin LH (1994) WHO: histological typing of tumours of the liver, 2 edn
19. Oberli A, Popovici V, Delorenzi M, Baltzer A, Antonov J, Matthey S, Aebi S, Altermatt HJ, Jaggi R (2008) Expression profiling with RNA from formalin-fixed, paraffin-embedded material. BMC Med Genomics 1:9
20. Harrison KA, Thaler J, Pfaff SL, Gu H, Kehrl JH (1999) Pancreas dorsal lobe agenesis and abnormal islets of Langerhans in Hlxb9-deficient mice. Nat Genet 23:71–75
21. Lee JS, Heo J, Libbrecht L, Chu IS, Kaposi-Novak P, Calvisi DF, Mikaelyan A, Roberts LR, Demetris AJ, Sun Z, Nevens F, Roskams T, Thorgeirsson SS (2006) A novel prognostic subtype of human hepatocellular carcinoma derived from hepatic progen-itor cells. Nat Med 12:410–416
22. Ross AJ, Ruiz-Perez V, Wang Y, Hagan DM, Scherer S, Lynch SA, Lindsay S, Custard E, Belloni E, Wilson DI, Wadey R, Goodmann F, Orstavik KH, Monclair T, Robson S, Reardon W, Burn J, Scambler P, Strachan T (1998) A homoebox gene, HLXB9, is the major locus ofr dominantly inherited sacral agenesis. Nat Genet 20:358–361 23. Saha MS, Miles RR, Grainger RM (1997) Dorsal-ventral
patterning during neural induction in Xenopus: assessment of spinal cord regionalization with xHB9, a marker for the motor neuron region. Dev Biol 187:209–223
24. Hagan DM, Ross AJ, Strachan T, Lynch SA, Ruiz-Perez V, Wang YM, Scambler P, Custard E, Reardon W, Hassan S, Nixon P, Papapetrou C, Winter RM, Edwards Y, Morrison K, Barrow M, Cordier-Alex MP, Correia P, Galvin-Parton PA, Gaskill S, Gaskin KJ, Garcia-Minaur S, Gereige R, Hayward R, Homfray T (2000) Mutation analysis and embryonic expression of the HLXB9 Currarino syndrome gene. Am J Hum Genet 66:1504–1515
25. Li H, Arber S, Jessell TM, Edlund H (1999) Selective agenesis of the dorsal pancreas in mice lacking homeobox gene Hlxb9. Nat Genet 23:67–70
26. Sherwood RI, Chen TY, Melton DA (2009) Transcriptional dynamics of endodermal organ formation. Dev Dyn 238:29– 42
27. Currarino G, Coln D, Votteler T (1981) Triad of anorectal, sacral, and pre sacral anomalies. Am J Roentgenol 137:395–398 28. Nagel S, Scherr M, Quentmeier H, Kaufmann M, Zaborski M,
Drexler HG, MacLeod RA (2005) HLXB9 activates IL6 in Hodgkin lymphoma cell lines and is regulated by PI3K signalling involving E2F3. Leukemia 19:841–846
29. Ballabio E, Cantarella CD, Federico C, Di MP, Hall G, Harbott J, Hughes J, Saccone S, Tosi S (2009) Ectopic expression of the HLXB9 gene is associated with an altered nuclear position in t (7;12) leukaemias. Leukemia 23:1179–1182
30. Iliopoulos D, Hirsch HA, Struhl K (2009) An epigenetic switch involving NF-kappaB, Lin28, Let-7 MicroRNA, and IL6 links inflammation to cell transformation. Cell 139:693–706
31. Roskams T, Desmet V, Verslype C (2007) Development, structure and function of the liver. In: Burt A, Portmann B, Ferrell L (eds) MacSween’s pathology of the liver. Churchill Livingstone Elsevier, Philadelphia, pp 1–74
32. Wildenhain S, Ruckert C, Rottgers S, Harbott J, Ludwig WD, Schuster FR, Beldjord K, Binder V, Slany R, Hauer J, Borkhardt A (2010) Expression of cell–cell interacting genes distinguishes HLXB9/TEL from MLL-positive childhood acute myeloid leuke-mia. Leukemia 24:1657–1660
33. Sun JC, Liang XT, Pan K, Wang H, Zhao JJ, Li JJ, Ma HQ, Chen YB, Xia JC (2010) High expression level of EDIL3 in HCC predicts poor prognosis of HCC patients. World J Gastroenterol 16:4611–4615