HAL Id: hal-00808622
https://hal.archives-ouvertes.fr/hal-00808622
Submitted on 9 Apr 2013
HAL is a multi-disciplinary open access
archive for the deposit and dissemination of
sci-entific research documents, whether they are
pub-lished or not. The documents may come from
teaching and research institutions in France or
abroad, or from public or private research centers.
L’archive ouverte pluridisciplinaire HAL, est
destinée au dépôt et à la diffusion de documents
scientifiques de niveau recherche, publiés ou non,
émanant des établissements d’enseignement et de
recherche français ou étrangers, des laboratoires
publics ou privés.
Combining learning methods and time-scale analysis for
defect diagnosis of a tramway guiding system
Zahra Hamou Mamar, Pierre Chainais, Alex Aussem
To cite this version:
Zahra Hamou Mamar, Pierre Chainais, Alex Aussem. Combining learning methods and time-scale
analysis for defect diagnosis of a tramway guiding system. 16th Mediterranean Conference on Control
and Automation, Jul 2008, France. pp.1780 -1785. �hal-00808622�
Combining learning methods and time-scale analysis for defect
diagnosis of a tramway guiding system
Zahra Hamou Mamar, Pierre Chainais and Alex Aussem
Abstract— This paper presents a diagnosis system for de-tecting tramway rollers defects. First, the continuous wavelet transform is applied on vibration signals measured by specific accelerometers. Then, the Singular Values Decomposition (SVD) is applied on the time-scale representations to extract a set of singular values as classification features. The resulting multi-class multi-classification problem is decomposed into several 2-multi-class sub-problems. The predicted probabilities are coupled using a pairwise coupling method. Empirical results demonstrate the efficiency and robustness of the overall diagnosis system on measurement data.
I. INTRODUCTION
In this paper, we discuss a novel computed assisted deci-sion support system for the automatic monitoring of the guid-ing system of a tramway on tires combinguid-ing methods from statistical learning and wavelet analysis. The TRANSLOHR Figure 1(a), chosen by the city of Clermont-Ferrand and other cities (Padoue, Aquila,...), is a new tramway on tires. The bearing system is equipped with a guiding system consisting of a single central rail. The tramway used for our experimental tests has 4 axles equipped on both sides with two pairs of rollers at the front and at the back, Figure 1(b)&(c). There are therefore 8 pairs of rollers. To limit noise and parasitic vibrations, the rollers are covered with a composite overlay that ensures better comfort and silence without squeaks. This overlay can be damaged and worn (see Figure 2) because of the accidental presence of metallic pieces, stones on the rail, etc. The wear of the overlay induces a change in the behavior of the guiding system which becomes quite uncomfortable and generates undesirable vibrations. This can lead to other irreversible damages. A permanent monitoring to prevent these defects can guarantee the availability of the tramway, the comfort and the safety of the users.
Most often, the monitoring of a transportation system is based on visual controls performed by experts or technicians. Such tasks are expensive and time consuming ; moreover the diagnosis is sometimes unreliable. The use of an automatic monitoring system reduces the maintenance costs and makes them more efficient. Several works deal with the diagnosis, detection and classification of defects in the transportation domain [5]–[7]. The corrective maintenance by vibration This work was supported by the city of Clermont-Ferrand (SMTC),LOHR
industry (www.lohr.fr/transport-public-tech.htm) and the Signal Develop-ment company (www.signal-developpeDevelop-ment.fr).
Z. Hamou and P. Chainais are with University of Clermont-Ferrand 2, ISIMA, F-63177 Aubiè[email protected]
A. Aussem is with the Université de Lyon 1, LIESP, F-69622 Villeur-banne, France
analysis is the best tool for this purpose. In the literature, several studies showed the effectiveness of the vibration analysis in many monitoring of machinery elements such as roller bearings and gears. Most of the detection approaches are generally based on the acceleration signatures analysis to detect the presence and growth of peaks in spectra at certain frequencies [8], [9]. This paper focuses on the vibration monitoring of the guiding system of a tramway on tires. In this work, we develop a system for the automatic monitoring of the state of the overlay of the rollers. This system uses the measurement of the vibrations due to damaged rollers in the rail.
In this paper, we discuss a method that combines learning methods and time-scale analysis in order to locate the defective pair of rollers and to identify the nature of the defect at the same time. The state of each pair of rollers must be determined as precisely as possible: new (no defect), (slightly or very) worn, with holes. Once the continuous wavelet transform is applied, the vibration signal is repre-sented by a gray level image, known as the scalogram. The position of the pairs of rollers is obtained from the temporal segmentation. Each one is then represented by a matrix of wavelet coefficients, a known segment on the scalogram. The singular value decomposition SVD is then applied to the matrices corresponding to each pair of rollers to reduce the complexity of the mutli-class classification problem.
The first part of this article presents the conditions of data acquisition and the material configuration for the mea-surement of the vibratory signals. Then we present, the various treatments carried out on the vibratory signals: the continuous wavelet transform, temporal and frequency segmentation. The feature extraction from the scalogram segment using several classifiers is then described. A multi-class multi-classification to identify the state of the pairs of rollers is illustrated in the third part. Several statistical classifiers are assessed using cross-validation techniques.
II. SIGNALS PROCESSING A. Acquisition system
The complexity of the guiding system, under study, and the deadlines imposed by the client do not allow for modeling the physical system. We choose than the diagnosis approach by pattern recognition method [3]. Several trial runs carried out in Duppigheim (Strasbourg, France) allow us to construct the data basis for each class with a known configurations (combinations of "new", "worn" and "with holes" rollers on different axles). Three classes are retained and studied in this
work, classC1 : new rollers, classC2 : with holes and class C3 : worn.
We have recorded several sets of signals for different. The measurement system1 consists of three accelerometers,
fixed on the rail, recording the horizontal and vertical vi-brations of the rail caused by the defective rollers. Two photoelectric cells around the sensors provide references in time and position. For each passage at a normal speed (eg. 35 Km/h),the measurement system provides us with six signals (3 horizontal and 3 vertical components). Each acquisition lasts 8 seconds at sampling frequencyF e = 44100Hz. Thus, the available bandwidth for analysis is roughly within [2Hz-20kHz]. In fact, only the sum of the two components (lateral and vertical) is used.
The SYSCOGA detector will be related to a maintenance station so as to send, for each tramway passage, the recorded vibratory signals, the date and the hour, the direction of circulation as well as the tramway number which is ensured by an identification system. The data collected pass through a set of treatments: a continuous wavelet transform, temporal and frequency segmentations, feature extraction and a multi-class multi-classification. The final application will have to provide a report of each pair of rollers state. The decision to stop the tramway or to change the defective rollers, will be taken by an expert or a technician. The access to the diagnosis details will be ensured by a human-machine interface.
B. Data pre-processing
1) Temporal segmentation: For each passage of the tramway, the signal is a priori related to information com-ing from the 8 pairs of rollers that generate vibrations altogether, at the same time. However, it is a reasonable physical assumption to consider that only the closest pair of rollers to the sensor generates the measured vibrations. Temporal segmentation based on the references provided by the photoelectric cells allows us to locate the passage of each of the 8 pairs of rollers over the sensor within each signal. Therefore, 8 segments of signal can be identified and labeled CGk, fork = 1, ..., 8.
2) Time-scale representation: Thanks to the approach defined above, each pair of rollers is related to known segment on the signal, Figure 3. To identify its state, a local frequency information is required. Such a remark naturally leads to use a time-frequency or a time-scale analysis. These methods are largely used in the railway transports field to detect the rails defects [14], [15] and also in the industrial sectors to perform a diagnosis in the revolving machines and the internal combustion engine [16].
In the present study, one hopes to detect the defect which range from the millimeter to ten centimeters. Two principal types of defects can be distinguished. The first type corre-sponds to the structural defects of the rollers which produce vibrations at low frequencies (or on large scales). The second produces vibrations at high frequencies (small scales) and
1The measurement system is the property of Signal Development
com-pany.
is characterized by the surface defects Figure 3. To get a good frequency resolution both at low and high frequencies, a time-scale analysis is preferable: the relative precision is constant over the whole range of analyzed frequencies (∆ν/ν is constant).
The wavelet transform of a finite energy signalx(t) with the analyzing waveletψ(t) is the scalar product of x(t) with a scaled and conjugated wavelet [1]:
Tx(a, b) = 1 √ a Z +∞ −∞ x(t)ψ∗µ t − b a ¶ dt,
where ψ∗(t) stands for the complex conjugation of the
mother waveletψ(t), a the scaling parameter (a ≈ 1/ν) and b is the time localization parameter.
We use the second derivative of the Gaussian function, known as the "Mexican-hat wavelet" [1].
C. Scalogram analysis
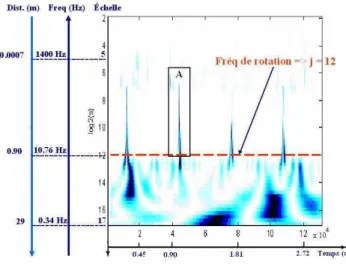
The scalogram such as presented on Figure 3 consists of a gray level picture of the energy density function of the wavelet transform, |Tx(a, b)|2. The black regions at high
and low frequency correspond to a high energy can possibly correspond to defects. The access to this concentrated energy permit to understand what happens in this frequency band. The diagnosis process consists then, to extract and to classify these areas of interest to identify the nature of the defect.
Figure 3 shows a typical example of the scalogram of a signal. Some information are directly visible by eye. Let Frot the rotation frequency of the rollers. The scalogram
is clearly divided into three parts. At the bottom is a low frequency band, f < Frot, corresponding to the first type
of defects (warped roller, structural deformation...) ; the rotational frequency Frot is represented by an horizontal
dashed line at scale a = 212
corresponding to 10.76Hz (depending on the tramway speed). At the top is a high frequency band f & Fnoise withFnoise ≃ 350 Hz
(corre-sponding to the scalea ≃ 27
), essentially consisting of noise (the vibrations attenuate quickly in high frequencies). The medium frequency band corresponds toFrot .f . Fnoise,
f ∈ [10Hz − 350Hz]. This intermediate band is the most informative. One clearly notices the existence of black peaks, fig. ??(zone A), look at zone A. Such peaks can be associated to defects of a size of the order of several millimeters to ten centimeters on the overlay of a pair of rollers. These zones which represent defects are visually recognize, but it is very difficult to scientifically define the features, a quantized values, that represents a defect and differentiate the defect types. To preserve all information for a better separation between the various classes we have used the matrix of all wavelet coefficients for each pair of rollersCGk. In this first
study, we will only focus on local defects associated to the medium frequency band defined above.
III. PATTERN RECOGNITION
The previous pre-treatment step: time-scale analysis, tem-poral and frequency segmentation described in section II-B provided us with a suitable representation of the collected
data. To each pair of rollersCGk (k = 1, ..., 8) is associated
a rectangular sector on the scalogram (see Fig. 3), which corresponds to a matrix of wavelet coefficients CW Tk.
Unfortunately, the increase in the number of variables does not improve systematically the quality of the training. It decreases the number of parameters to be estimated (Hughes phenomena [4]). In fact, the so-called "Curse of Dimension-ality" makes the classification task more difficult. To solve this problem, a reduction of the dimensionality is necessary. A. Feature selection/extraction
Feature selection/extraction is the key part in the field of pattern recognition. In practical applications, many feature extraction technologies are used nowadays. However, there is no single feature extraction method is consistently superior to other methods. The result of the method highly depends on the problem. In recent years, the Singular Values Decomposi-tion (SVD) [2] has become an important tool in statistical data analysis and signal processing used to efficiently decrease the amount of data processed for many applications.
The classification approach we adopt is to extract, from the time-scale representation belonging to a class, a signature which is robust, reliable, with few parameters and discrim-inating. To perform this step of feature extraction we used the (SVD) method.
LetCW Tkam x n matrix of squared wavelet coefficients
associated to CGk with m ≥ n. Every CW Tk matrix can
be decomposed as:
CW Tk = U ΣVt,
where U is an m x m orthogonal matrix, V is an n x n orthogonal matrix and called the left and right singular vectors respectively.Σ is an m x n diagonal matrix such as, Σ = (σ1, σ2, ..., σp). The components σij = 0 if i 6= j
andσii≥ 0 with σ1≥ σ2≥ ... ≥ σp. Theσi′s are called the
singular values ofCW Tk.
Marinovic and Eichmann [10], [11] looked at a feature extraction technique based on the singular value decompo-sition of the Wigner distribution. Their technique used only the singular values to determine the classification features. In the same spirit, we use the vector of the singular values as the vector forms, the representative of the pair of rollers to be classified. For the step of classification, a vector of the data base for a known class is called "vector form". The use of the singular values (sv) as a input vector form of the classifier is employed for the face recognition in several works. Its effectiveness is shown in [13] for a small size data base.
B. Multi-Class Classification
According to the frequency and the temporal segmentation of the scalogram made before, each pair of rollers (new or defective) is represented by an (21, 32768) matrix of wavelet coefficients. After an extraction of characteristics using the SVD method, the vector forms consist of the first 5 singular values. So our default detection problem translates into a standard supervised multi-class classification problem with
a set of N observations of M different types, Ω = {ωi,i
= 1,..., M}. Each observation consists of a pair of vectors (xi,yi) where yi are the class labels associated with xi, for
i = 1, ..., N . (xi,yi) are assumed to be independent and
identically distributed.
Our multi-class classifier is constructed by combining several simpler two-class sub-classifiers. Many strategies can be used to combine two-class classifiers as a multi-class multi-classifier. The most common approaches are so-called All" and One". "One-Against-All" trains k classifiers (k is the number of classes), in which the ith, (i = 1, .., k), classifier tries to separate class i from
the rest. In contrast, "One-Against-One" needs to construct one classifier for two arbitrary classes, i.e. m(m − 1)/2 classifiers all together [17]. The article [18] details and compares these two classification strategies using SVM. In view of their analysis, this "One-Against-One" approach is chosen for this study.
The3-class ("New", "Worn", "Holes") classification prob-lem is decomposed into a set of3 simpler 2-class problems. Each sub-classifier is learning using the data of two classes only. To obtain the class decision ("New" vs "Worn", "New" vs "Holes", "Worn" vs "Holes") the "One-Against-One" approach is used. Each classifier is trained using only the data of these two classes to obtain posterior probabilities for the class decisions. The resulting pairwise classifier probabilities P rij are combined in order to obtain posterior probabilities
P r(Ci|(X = x)) for the finale class decisions [12] :
P r(Ci|(X = x)) = PK 1
j=1,j6=i 1
P rij − (K − 2)
. (1)
whereP rijare the two-class network classifiers probabilities
for all class pairs (i, j) withi 6= j. C. Results
In this section, we report on several experimental in-vestigations that were designed to assess the performance of our fault diagnosis approach for guiding rollers. The selected features are used as input into several well-known classification algorithms. Experiments are used with WEKA’s open source machine learning software in Java [19]. WEKA implements a vast collection of classification procedures. In this paper, we consider multi-layer perceptrons (MLP), radial basis function (RBF) and support vector machines (SVM). Weka implements the sequential minimal optimiza-tion (SMO) algorithm for training a support vector classifier. Normalized Gaussians are used in the RBF network. The k-means clustering algorithm is used to provide the basis functions and learns a logistic regression on top of that. Symmetric multivariate Gaussians are fit to the data from each cluster. The MLP uses back-propagation to classify instances. The neuron activation functions are all sigmoid. Linear kernel functions are used for the SVM.
Each sensor is trained individually on the data base built for each one. Thus, for each sensor, two data basis are built with dimension(150 × 5). Each one of them is composed of
50 signatures specific to the rollers without defect and 100 signatures corresponding to the defective rollers. Once the training carried out, the hit-rate (defined as the percentage of correctly classified instances) was estimated using the leave-one-out (LOO) technique for the three classifiers. The overall hit rate is98% for the MLP. In comparison, RBF and SVM achieve respectively 95.33% and 94.66%. So, for sake of conciseness, we only display in more details the performance of the best classifier on our data, namely the MLP, for each accelerometer. Classically, the possible outcomes of a two-class prediction can be True Positive (TP), True Negative (TN), False Positive (FP) and False Negative (FN). True positives are the defects that are correctly detected. A variety of accuracy measures can be calculated from a contingency table :
• Sensitivity = TP / (TP + FN); • Specificity = TN / (FP + TN).
• Precision = TP/(TP + FP), defined as the fraction of the retrieved information, which is relevant. • Recall = TP /(TP + FN), defined as the fraction of
the retrieved information relevant versus all relevant information.
• Kappa statistic, κ = (T P + T N)/(T P + T N + F P + F N ), is the proportion of specific agreement. The results obtained with MLP classifier for the three sensors are illustrated in Table I. We use precision, recall and kappa statistic as our evaluation criteria. As may be seen, despite the limited number of observations, the predictions did not degrade much from the training sets to the test sets, indicating good generalization ability. Overall, all the classifiers that were used show a great robustness and a good capacity of generalization.
Classifier : MLP
Class TP Rate FP Rate Precision Recall F-Measure ROC Area First accelerometer: Hit rate = 98%, κ = 0.95 1 0.98 0.02 0.96 0.98 0.97 0.996 2 0.98 0.02 0.99 0.98 0.98 0.996
Second accelerometer: Hit rate = 95%, κ = 0.89 1 0.92 0.03 0.94 0.92 0.93 0.994 2 0.97 0.08 0.96 0.97 0.96 0.994
Third accelerometer: Hit rate = 98%, κ = 0.95 1 0.98 0.02 0.96 0.98 0.97 0.997 2 0.98 0.02 0.99 0.98 0.98 0.997
TABLE I
PERFORMANCE OBTAINED WITH THEMLP.
IV. Conclusion
We have presented, in this work, the complete structure of the process of diagnosis, combining continuous wavelet transform, SVD decomposition and machine learning meth-ods. Future experiments will be conducted on more classes M > 3 with different levels of worn. This will enable us to check the stability of our approach. The Syscoga detector, the acquisition system and the treatments, will be integrated and operational at the end of2008.
REFERENCES
[1] S. Mallat, A Wavelet Tour of Signal Processing, Academic Press, 1998. [2] G.H. Golub, C.F. Van Loan. Matrix Computations, the John Hopkins
University Press, Baltimore, London, 1989.
[3] B. Dubuisson, Diagnostic, intelligence artificielle et reconnaissance des formes, Hermes, 2001.
[4] R. Bellman. Adaptive Control Processes, Princeton University Press, Princeton, New-Jersey, 1961.
[5] M. Bentoumi, Diagnostic de systèmes non linéaires par réseaux de neurones - Application à la détection temps-réel de défauts de rail. Thèse de doctorat, Université Henri Poincaré de Nancy,France, 2004. [6] L. Oukhellou, P. Aknin, Hybrid training of radial basis function
networks in a partitionning context of classification. Revue Neurocom-puting, Vol. 28, Nos. 1-3 p.165-175, 1999.
[7] M. Bentoumi, G. Millérioux, G. Bloch, L. Oukhellou, P. Aknin, Classification de Défauts de Rail par SVM. Congrès International IEEE Signaux, Circuits et Systemes SCS’04, Monastir, Tunisie, p.18-21, mars 2004.
[8] C. Junsheng, Y. Dejie, Y. YuA, fault diagnosis approach for roller bearings based on EMD method and AR model, Mechanical Systems and Signal Processing, Volume 20, Issue 2, p.350-362, February 2006. [9] J.K. Hammond, P.R. White,The analysis of non-stationary signals using time-frequency methods, Journal of Sound and Vibration, Volume 190, Issue 3, 29, p.419-447, February 1996.
[10] N.M. Marinovic, G. Eichmann, Feature extraction and pattern classifi-cation in space-spatial frequency domain, SPIE Intell. Robots Comput. Vision 579, pages 19-25, 1985.
[11] N.M. Marinovic, G. Eichmann, An expansion of Wigner distribution and its applications, Proceedings of the IEEE ICASSP-85, Vol. 3, pages 1021-1024, 1985.
[12] D. Price, S. Kneer, L. Personnaz, G. Dreyfus, Pairwise neural network classifiers with probabilistic outputs, Neural Information Proceedings Systems, 1994.
[13] Yong-Qing Cheng, and al., Human face recognition method based on the statistical model of small sample size, SPIE Proceedings of the Intell. Robots and Computer Vision, Vol. 1607, pages 85-95, 1991. [14] G. Zumpano, M. Meo, A new damage detection technique based
on wave propagation for rails, International Journal of Solids and Structures 43 Pages 1023-1046, 2006.
[15] F. Lanza di Scalea, J. McNamara, Measuring high-frequency wave propagation in railroad tracks by joint time-frequency analysis, Journal of Sound and Vibration 273 Pages 637-651, 2004.
[16] J.-D Wu, J.-C Chen, Continuous Wavelet transform technique for fault signal diagnosis of internal combustion engines, NDT&E International Pages 1-8, 2005.
[17] T. Hastie, R.Tibshirani, Classification by pairwise coupling, Annals of Statistics, 26(2), p.451-471, 1998.
[18] C. Hsu, C.J. Lin, A comparison of methods for multiclass support vector machines, IEEE Transaction on Neural Networks 13(2), p.415-425, 2002.
[19] Ian H. Witten and Eibe Frank, Data Mining: Practical machine learning tools and techniques, 2nd Edition, Morgan Kaufmann, San Francisco, 2005.
Fig. 1. (a)The Translohr on tires. (b) The bearing system. (c) The guiding system: a pair of rollers. (d) The damaged overlay.
Fig. 3. The temporal segmentation of the whole vibratory signal.