DOI 10.1007/s10035-010-0179-6
Position dependent velocity profiles in granular avalanches
Marius Schaefer · Louis Bugnion ·Martin Kern · Perry Bartelt
Received: 4 May 2009 / Published online: 26 March 2010 © Springer-Verlag 2010
Abstract We present velocity profile measurements in granular avalanches flowing down a flat chute with wide rect-angular cross section. The flow is recorded through a trans-parent side-wall by a high-speed camera, which is able to capture 1,825 pictures in a second. Due to the high frame rate of the camera, several flow features can be observed. Quanti-tative statements can be made by analysing the images with a pattern matching algorithm. This provides us with flow-nor-mal velocity profiles with a very high temporal and spatial resolution. We find that even on flat surfaces, velocity pro-files are strongly changing through the flow and for the range of investigated chute angles (from 26◦ to 36◦) clear trends can be recognised. In the head of the avalanche the veloc-ity is highest, decreasing continuously over the length of the avalanche. Thus, the investigated granular avalanches stretch through the flow. The experimental method allows us to study the evolution of characteristic flow properties such as depth averaged velocity, slip velocity, surface velocity, shear rates or flow depth. Side-wall friction effects are estimated. Keywords Avalanches· Granular flows · Chute experiments· Velocity profiles · Dam-break experiments 1 Introduction
The flow of dry, cohesionless granular matter down inclined chutes has been investigated in laboratory experiments M. Schaefer (
B
)· L. Bugnion · P. BarteltWSL Institute for Snow and Avalanche Research SLF, Flüelastr. 11, 7260 Davos Dorf, Switzerland
e-mail: [email protected]
M. Kern
Department of Snow and Avalanches, Institute for Natural Hazards and Alpine Timberline, Rennweg 1, 6020 Innsbruck, Austria
[1–5] and in discrete particle simulations [6–9] with the goal of finding a constitutive law to describe the fluid-like motion of granular materials [1,10–16]. Such a law would have a wide range of applications in industry and the geosciences. Therefore, experiments [2,17–19] have been conducted which studied the evolution of the shape and the position of finite volume granular avalanches to test mod-els based on depth-averaged equations [13,17,18,20]. In other experimental investigations mass flow rates on inclined planes have been controlled to generate steady flow states. Relations between the applied mass flow rates and inclination angles and flow heights could be deduced for a certain range of inclination angles [3,14,21]. Insight into the constitutive behaviour of flowing granular material has also been obtained by measuring shear rates and then deducing the underlying shear forces. Shear rates can be obtained from flow-normal velocity profiles. Such profiles have often been measured in steady state conditions [1,5,21]. In other cases the velocity profile has been averaged over the observation time [22,23]. Rather than inferring the shear behaviour of granular flows from kinematic measurements, basal shear force measure-ments together with basal velocity measuremeasure-ments, have been applied to study the basal frictional behaviour of granular material [24].
In this contribution, we focus on the measurement of the evolutionof flow-normal velocity profiles from head to tail in granular avalanches using high-speed video recording. We release a finite mass of granular material down a flat inclined chute with rectangular cross-section. This type of experiment is often referred to as the dam-break problem in literature [25,26]. In Sect.2 we present our experimental setup that allows us to measure the strongly varying velocity profiles of the granular avalanche as it passes the measurement loca-tion and explain the data analysis methodology. We pres-ent and discuss our experimpres-ental findings in the following
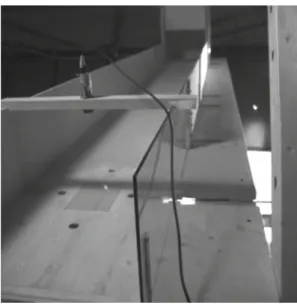
Fig. 1 Front view of the granular chute: force plate in the centre, ultra-sonic flow height sensor above it and optical velocity sensors on the ground are visible. During the experiments the high-speed camera is installed in the void space behind the glass wall
Sect.3, where we compare the results obtained for two gran-ular materials, with different grain sizes. Furthermore, we discuss the influence of side-wall effects. We conclude our findings in Sect.4.
2 Experimental procedure 2.1 Data acquisition
The granular avalanche experiments were performed on a 0.5 m wide, 4 m long laboratory chute that could be inclined between zero and forty degrees to the horizontal (Fig.1). The chute bottom and one lateral side-wall were made of wood, whereas the other side-wall was wooden in the upper part and made of glass in the lower part. The maximum flow depth observed in the experiments was 30 mm. At the upper end of the chute, a 1 m long, 0.6 m high hopper held the mass of approximately 100 kg of granular material. A trap door stood perpendicular to the running surface and was opened manually with a rope.
Glass beads (ballotini) of two different bead sizes were used as granular material: the larger beads had a mean diam-eter of d = 1.4 mm and the smaller beads of d = 0.1mm. They will be referred to as large ballotini and small ballotini in the following. The glass density was the same for both ballotini sizes, but the resulting bulk properties differed con-siderably. For the detailed properties, see Table1.
Various sensors were installed at the chute to capture the flow properties of the granular avalanches. Optical veloc-ity sensors were mounted flush to the basal surface. These
sensors extract velocities from the cross-correlation func-tion of infrared reflectivity signals [27]. A force plate was installed flush to the basal surface at the centre of the lower end of the chute. The force plate measured shear and normal force [24]. An ultrasonic flow height sensor measured the flow depth as the avalanche ran over the force plate.
The focus of this paper is on the data obtained from high-speed recordings of the flow by a modern high-high-speed camera. We used a Vosskühler HCC-1000 camera, which is able to capture 1,825 pictures in a second with a resolution of 256× 1,024 pixels. The pictures are eight bit grey scale images. The camera has one gigabyte internal memory. Thus, at the highest frame rate we could record 2.2 s of the flow. In order to obtain an image section of approximately 30 mm height and 7.5 mm width, we used a lens with 25 mm focus with an additional spacer of 5 mm. The image distortion due to the spacer was negligible. Illumination was accomplished by two high-speed AOS Technologies LED strobe lights, which can generate light pulses between 10 and 100 micro seconds and which were triggered by the shutter of the high-speed cam-era. The camera and the strobes are installed near the end of the chute behind the glass side-wall at the same down-stream position as the force plate. We assumed that, at this position, flow variations caused by different initial filling patterns of the hopper or the opening of the trap door were no longer apparent in the results. For the small ballotini, this was confirmed by the repeatability of the results while, for the larger ballotini, variations in measured flow depths could be observed for the same inclination angles. Due to the repeat-ability of the measured velocities during two different mea-surement campaigns we assume that the roughness of the wooden running surface did not change with the number of experiments conducted. All data acquisition was synchron-ised by a trigger signal supplied by one of the velocity sensors installed on the running surface.
2.2 Data analysis
Ground velocities in various positions of the flow were obtained by cross-correlating adequate intervals of the reflec-tivity signal of the optical sensors [27]. The force plate and flow height sensors were calibrated beforehand, allowing their signals to be converted to forces and heights, respec-tively. Due to the high frame rate of the high-speed camera the movies provide very detailed slow motion views of the flow. Individual particles can be distinguished and their trajectories can be traced. By comparing the positions of patterns between subsequent images, velocities of the flow can be extracted. To be able to identify these displacements automatically, a pat-tern matching algorithm was developed, similar to the one used in Particle Image Velocimetry (PIV): the images are divided into small sub-windows and the patterns contained in these small windows are matched in the successive image
Table 1 Material properties Diameter ( mm) Density (kg/m3) Bulk density (kg/m3) Angle of repose (◦) Number of particles Flow dimensions (particle diameters) Small Ballotini 0.1 2,400 1,410 (31 ± 1) 8× 10¹⁰ 4· 105× 5 · 103× 300 Large Ballotini 1.4 2,400 1,590 (26 ± 1) 1.5 × 10⁷ 2800× 360 × 21
by calculating the two dimensional cross-correlation func-tion. The area in the successive image where these patterns are searched for strongly influences the computing time. For the area we chose one additional window width in the down-stream direction and one window height in both flow-nor-mal directions. After finding the maxima of the correlation maps and, thereby, the direction and absolute value of the displacements of the patterns over all sub-windows, a two-dimensional velocity field between two consecutive images is determined. This procedure can be repeated for all pairs of consecutive images. Therefore, it was theoretically possible to obtain two dimensional velocity fields of the flow each half millisecond. However, in our images, the contrast was not always high enough to clearly determine the displacement. Meinhart et al. [28] have shown that if the noise-signal ratio is high, more accurate time averaged velocities are obtained by summing the two dimensional correlation functions for various time steps and then determining the displacement of the averaged correlation functions. We obtained sufficiently smooth velocity data by summing the correlation functions of 20 time steps (which is equivalent to an average over 0.01 s) and by choosing a sub-window size of 64 pixels in the flow direction and 4 (32) pixels in flow-normal direction for the small and the big ballotini, respectively. The quality of the correlation functions was substantially improved by remov-ing the very bright reflections in the images which move in a different way than the particles. An image of the flow super-imposed with the computed two-dimensional velocity field is shown in Fig. 2. The evolution of the two-dimensional velocity field provides detailed insight into the internal flow structure of the granular avalanches. In Fig.2we can rec-ognize that the downstream components of the velocity field are much higher than flow-normal velocity components. We therefore focus on the time evolution of the flow-normal pro-file of the downstream velocities. We obtain these velocity profiles by taking the median of the downstream component of the velocity values which correspond to the same flow depth. This ensures that outliers in the velocity field due to a flat correlation function are automatically filtered out. This is the only filtering mechanism which was used. The flow depth of the velocities was defined as the centre of the corre-lated sub-window. The velocity profile corresponding to the velocity field shown in Fig.2is plotted in the same figure.
0 20 40 100 200 300 400 500 600 700 800 900 1000 position in pix els
velocity in pixels per frame
Fig. 2 Image of the flow recorded by the high-speed camera together with the computed two dimensional velocity field (arrows) on the left and the corresponding downstream velocity profile (dots) on the right (colors online)
3 Results and discussion 3.1 Small ballotini
We start by describing the results of the experiments with the small ballotini in detail. After the similarities and con-trasts to the experiments with the large ballotini will be discussed. In Fig.3, we present the evolution of the down-stream velocity profiles for four different inclination angles as the small ballotini avalanches pass the measurement loca-tion. Profiles are plotted every 0.27 s and up to the flow depth of the dense part of the avalanches. This flow depth was auto-matically determined from the camera images by a grey level limit. Velocities were also recorded in higher regions of the
0 0.5 1 1.5 2 2.5 3 3.5 4 4.5 0 0.5 1 1.5 2 2.5 3 t1 t2 t3 t4 t5 t6 t7 t8 depth in cm velocity in m/s (a) 30 degrees 0 0.5 1 1.5 2 2.5 3 3.5 4 4.5 0 0.5 1 1.5 2 2.5 3 t1 t2 t3 t4 t5 t6 t7 t8 depth in cm velocity in m/s (b) 32 degrees 0 0.5 1 1.5 2 2.5 3 3.5 4 4.5 0 0.5 1 1.5 2 2.5 3 t1 t2 t3 t4 t5 t6 t7 t8 depth in cm velocity in m/s (c) 34 degrees 0 0.5 1 1.5 2 2.5 3 3.5 4 4.5 0 0.5 1 1.5 2 2.5 3 t1 t2 t3 t4 t5 t6 t7 t8 depth in cm velocity in m/s (d) 36 degrees
Fig. 3 Time evolution of the downstream velocity profiles for different inclination angles, time steps between the different profiles are 0.27 s (For a better distinction of the curves the reader is referred to the on-line version of this article)
flow where the particle density clearly decreased (see Fig.2). Here velocities decreased with height due to enhanced air drag. This trend is also visible in some of the plotted pro-files (Fig.3). Images from the camera were available for the first 2.2 s of the flow. For all angles, velocity profiles are strongly changing from the head to the tail of the avalanche. In the head, considerable slip velocities are observed and the velocity profile has a convex shape. Subsequently, the slip velocity decreases and the lower part of the velocity pro-file assumes a linear shape. Then an inflection point evolves between the lower, now concave-shaped part of the profile and the upper, still convex part. However, with growing flow depth, the position of this inflection point rises but descends again for decreasing flow depths at the tail. The graph for 36 degree inclination indicates that towards the end of the flow the velocity profile assumes a highly sheared and rather linear shape.
Comparing the evolution of the velocity profile for differ-ent inclination angles, one can observe a generic behaviour for all inclinations. However, for steeper chute inclinations, the changes of the profiles take place more rapidly. Using half of the maximum frame rate of the high-speed camera,
we were able to record these changes for 4 s. Thereby the lin-ear velocity profile towards the end of the granular avalanches could also be observed for smaller inclination angles.
The appearance of an inflection point, which assigns the position with the maximal shear rate in the velocity profile, is a distinct feature of the velocity profiles. The elevation of the inflection point follows the flow depth. This suggests the existence of a critical value of the overburden pressure which strongly decelerates the particles below a certain depth in the flow. This idea is confirmed at the tail of the avalanche when the inflection point in the velocity profile becomes less pronounced. Here velocities of ballotini in vicinity to the run-ning surface increase against the decreasing trend of the depth averaged velocity. As this increase of velocities is connected to a decreasing flow depth, it appears that this acceleration is caused by a reduction of the frictional force due to a decreas-ing overburden pressure.
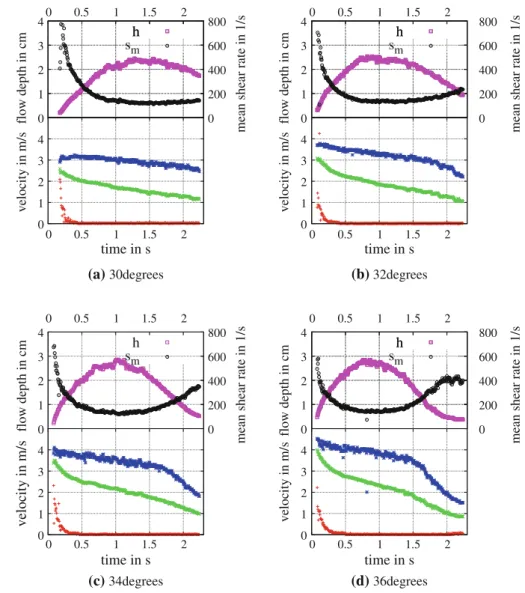
To quantify the changes of the velocity profiles that take place as the granular avalanches pass the measurement loca-tion, we trace the time evolution of some characteristic quan-tities through the avalanche. In Fig. 4 the depth averaged velocity vm, the slip velocity vs and the top velocity vt
Fig. 4 Evolution of characteristic quantities of the flows of small ballotini; flow depth (magenta squares), depth averaged shear rate (black circles), surface velocity (blue stars), depth averaged velocity (green crosses) and slip velocity (red plus signs) (For a better distinction of the curves the reader is referred to the on-line version of this article)
0 1 2 3 4 0 0.5 1 1.5 2 time in s velocity in m/s flow depth in cm h 0 1 2 3 4 0 200 400 600 800 0 0.5 1 1.5 2
mean shear rate in 1/s
h sm (a) 30degrees 0 1 2 3 4 0 0.5 1 1.5 2 time in s velocity in m/s flow depth in cm h 0 1 2 3 4 0 200 400 600 800 0 0.5 1 1.5 2
mean shear rate in 1/s
h sm (b) 32degrees 0 1 2 3 4 0 0.5 1 1.5 2 time in s 0 1 2 3 4 0 200 400 600 800 0 0.5 1 1.5 2 velocity in m/s flow depth in cm
mean shear rate in 1/s
h sm (c) 34degrees 0 1 2 3 4 0 0.5 1 1.5 2 time in s velocity in m/s flow depth in cm h 0 1 2 3 4 0 200 400 600 800 0 0.5 1 1.5 2
mean shear rate in 1/s
h sm
(d) 36degrees
are plotted as functions of time for the same four inclina-tion angles as in Fig.3. Furthermore, the flow depth h and the depth averaged shear rate sm, which we calculated as
sm = (vt − vs)/h, are shown in the same graphs. The flow depth (magenta squares) varies more quickly for steeper inclinations. For 36 degrees most of the avalanche volume has passed after the 2.2 s of recording time of the camera. Velocities decrease monotonically from head to tail of the avalanche for all inclination angles observed. The depth aver-aged velocityvmdecreases strongly in the first half second of the flow and then decreases approximately linearly until the end of the flow. The slip velocityvs also decreases rapidly in the beginning of the flow, decaying to nearly zero during this first half second. There is no slip throughout the rest of the flow except at 36 degrees where a very small increase of the slip velocity at small flow depths, towards the end of the flow, can be recognised. The top velocityvt evolves differ-ently: it decreases very slowly until a certain point in time after the maximum flow depth when it starts to decrease much quicker. The depth averaged shear rate smshows a very
inter-esting behaviour: it decreases with increasing flow depth and vice versa. This means that the relative motion of the ballotini to each other is slower for higher flow depths.
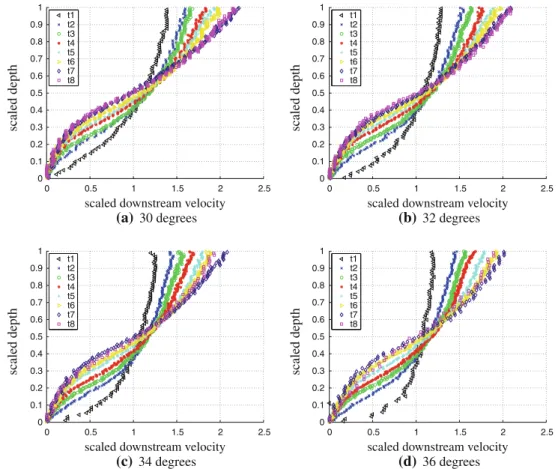
The idea that the shearing behaviour is coupled to the flow depth becomes more apparent, if the evolution of scaled velocity profiles is considered. In Fig.5we plot the down-stream velocities scaled with the depth-averaged downdown-stream velocityvmagainst the normalised flow depth. The evolution of the scaled velocity profiles shows the variations in veloc-ities and shear rates separated from the overall decelerating behaviour of the flow and separated from flow depth vari-ations. A striking feature of the scaled velocity profiles is that they all intersect at a point close to the centre-line of the flow. This is a surprising result and not an artifact of the scaling, since the profiles have been scaled with two a pri-ori independent time dependent parameters. It reveals that the velocity in the centre of our granular avalanches evolves in the same way as the depth averaged velocity. This property could be very useful when modelling these finite mass flows with depth-averaged models. The scaled velocity profiles above
0 0.5 1 1.5 2 2.5 0 0.1 0.2 0.3 0.4 0.5 0.6 0.7 0.8 0.9 1 t1 t2 t3 t4 t5 t6 t7 t8
scaled downstream velocity
scaled depth (a) 30 degrees 0 0.5 1 1.5 2 2.5 0 0.1 0.2 0.3 0.4 0.5 0.6 0.7 0.8 0.9 1 t1 t2 t3 t4 t5 t6 t7 t8
scaled downstream velocity
scaled depth (b) 32 degrees 0 0.5 1 1.5 2 2.5 0 0.1 0.2 0.3 0.4 0.5 0.6 0.7 0.8 0.9 1 t1 t2 t3 t4 t5 t6 t7 t8
scaled downstream velocity
scaled depth (c)34 degrees 0 0.5 1 1.5 2 2.5 0 0.1 0.2 0.3 0.4 0.5 0.6 0.7 0.8 0.9 1 t1 t2 t3 t4 t5 t6 t7 t8
scaled downstream velocity
scaled
depth
(d) 36 degrees
Fig. 5 Evolution of the scaled downstream velocity profile for 0.1 mm ballotini at different inclination angles. Profiles are plotted for the same times as in Fig.3(For a better distinction of the curves the reader is referred to the on-line version of this article)
the fixed point flatten out with time. The shape of the profiles below the fixed point change from convex to concave. This implies that the shear rate near the ground decreases at the expense of an increase of the shear rate towards the centre of the flow.
3.2 Large ballotini
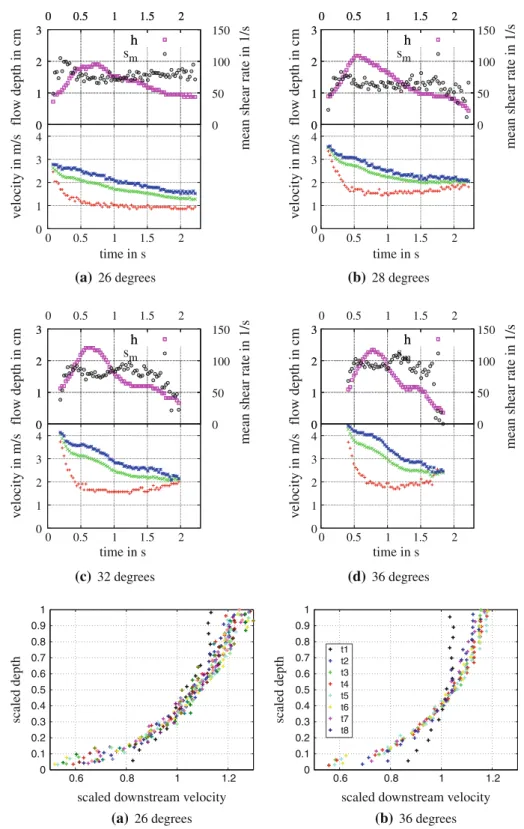
The evolution of characteristic properties of the downstream velocity profiles for the larger ballotini are shown in Fig.6. One striking difference to the small ballotini avalanches is the non-vanishing slip velocity over the entire avalanche. Differ-ent is also the course of the depth averaged shear rate through the granular avalanche. In the beginning when particles start to get in contact the depth averaged shear rate increases to a maximum value. With the maximum in flow depth it shows a local minimum similar to the small ballotini avalanches. With decreasing flow depth it increases again. Towards the end of the large ballotini avalanches the flow becomes more dilute and the depth averaged shear rate decreases again, due to less interaction of the glass beads. The evolution of the veloci-ties reveals a qualitatively similar behaviour as in the small ballotini avalanches. The slip velocityvsdecreases rapidly in
the beginning and becomes constant after half a second. At the end of the avalanchevsincreases slightly. Also the depth averaged velocityvm decreases quickly in the beginning of the flow. Subsequently it decreases much slower. It experi-ences a strong drop when the flow depth starts to decrease. Towards the end of the avalanches,vmstays almost constant. The top velocityvt evolves differently for different inclina-tion angles. For small inclinainclina-tions, it decreases at a nearly constant rate. For higher inclinations, it decreases slowly in the beginning. Subsequently it experiences a huge drop sim-ilar tovm with the decrease of the flow depth. Towards the end of the avalanchevtdecreases slowly again.
The scaled velocity profiles (Fig.7) show that the shearing behaviour is less complicated for the large ballotini experi-ments. Here the profiles are plotted every 0.14 s for two dif-ferent inclination angles. They all collapse relatively well on one curve. Only the first (black) profiles differ from the rest of the profiles. In the beginning, the flow is more dilute, the particles do not interact too much and the velocity pro-file is more plug-like. A very dilute flow is also observed towards the end of the flow. Here it becomes very difficult to determine the flow depth properly and therefore the profiles towards the very end of the flow are not shown in Fig.7. In our opinion the differences in the evolution of characteristic
Fig. 6 Evolution of characteristic quantities of the flows of large ballotini; flow depth (magenta squares), depth averaged shear rate (black circles), surface velocity (blue stars), depth averaged velocity (green crosses) and slip velocity (red plus signs) (For a better distinction of the curves the reader is referred to the on-line version of this article)
0 1 2 3 4 0 0.5 1 1.5 2 time in s 0 1 2 3 0 0.5 1 1.5 2 velocity in m/s flow depth in cm h 0 1 2 3 0 50 100 150 0 0.5 1 1.5 2
mean shear rate in 1/s
h sm (a) 26 degrees 0 1 2 3 4 0 0.5 1 1.5 2 time in s 0 1 2 3 0 0.5 1 1.5 2 velocity in m/s flow depth in cm h 0 1 2 3 0 50 100 150 0 0.5 1 1.5 2
mean shear rate in 1/s
h sm (b) 28 degrees 0 1 2 3 4 0 0.5 1 1.5 2 time in s 0 1 2 3 velocity in m/s flow depth in cm h 0 1 2 3 0 50 100 150 0 0.5 1 1.5 2
mean shear rate in 1/s
h sm (c) 32 degrees 0 1 2 3 4 0 0.5 1 1.5 2 time in s 0 1 2 3 velocity in m/s flow depth in cm h 0 1 2 3 0 50 100 150 0 0.5 1 1.5 2
mean shear rate in 1/s
h sm
(d) 36 degrees
Fig. 7 Evolution of the scaled downstream velocity profile for 1.4 mm ballotini at two different inclination angles. Profiles are plotted every 0.14 s. (For a better distinction of the curves the reader is referred to the on-line version of this article)
0.6 0.8 1 1.2 0 0.1 0.2 0.3 0.4 0.5 0.6 0.7 0.8 0.9 1
scaled downstream velocity
scaled depth (a) 26 degrees 0.6 0.8 1 1.2 0 0.1 0.2 0.3 0.4 0.5 0.6 0.7 0.8 0.9 1 t1 t2 t3 t4 t5 t6 t7 t8
scaled downstream velocity
scaled
depth
(b) 36 degrees
flow properties of the large ballotini avalanches to the small ballotini avalanches exist mainly due to two reasons: – We used the same running surface for the experiments
with the 0.1 mm ballotini and 1.4 mm ballotini. The wood of the running surface exhibits natural irregularities with a typical size of smaller than a 1 mm. This is why the small ballotini, which experienced the surface as bumpy,
stuck more to the running surface than the large ballotini, which experienced the wood as a flat/frictional surface. This clearly influenced the slip velocity and imposed dif-ferent boundary conditions for both materials.
– The number of ballotini used in the large ballotini avalanches was much smaller and thus the flow depth in particle numbers was much lower. Here a critical overburden pressure that strongly decelerates the
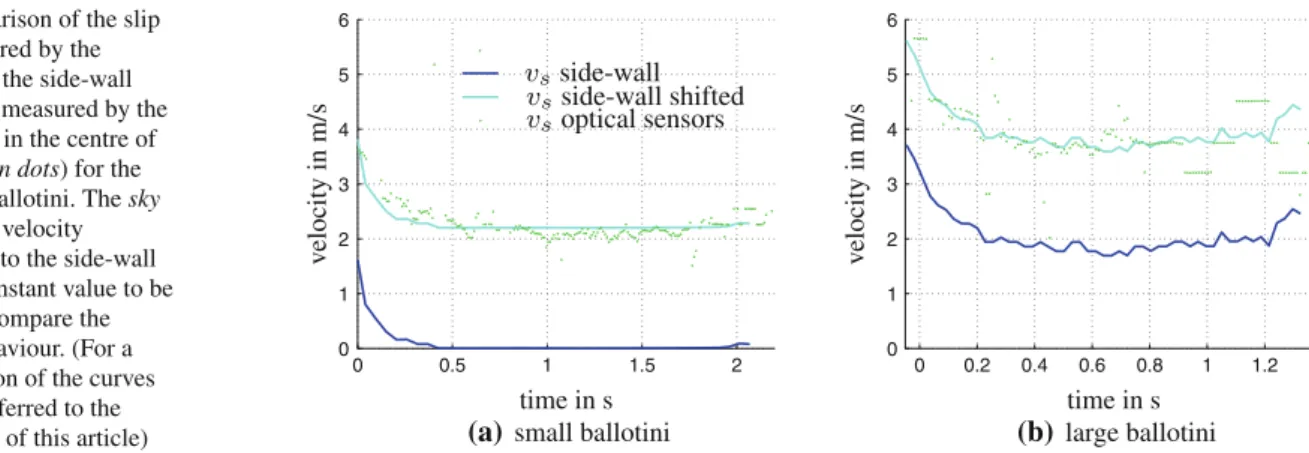
ballo-Fig. 8 Comparison of the slip velocity measured by the camera next to the side-wall (blue line) and measured by the optical sensors in the centre of the chute (green dots) for the two different ballotini. The sky blue line is the velocity measured next to the side-wall shifted by a constant value to be able to better compare the qualitative behaviour. (For a better distinction of the curves the reader is referred to the on-line version of this article)
0 0.5 1 1.5 2 0 1 2 3 4 5 6 side-wall side-wall shifted optical sensors v elocity in m/s time in s
(a) small ballotini
0 0.2 0.4 0.6 0.8 1 1.2 0 1 2 3 4 5 6 v elocity in m/s time in s (b) large ballotini
tini near the ground was not reached and therefore the shearing behaviour remained much simpler compared to the small ballotini.
An interesting feature of the avalanches with the large ballo-tini is the tail of these avalanches: the flow becomes dilute, the slip velocity increases and the velocity profile assumes a plug-like form. This can be clearly recognised in Fig.6as the velocities converge towards the end of the avalanche. Look-ing at the high-speed video images, one recognises that at the tail the ballotini only weakly interact through infrequent col-lisions. That is, they are flying almost freely down the chute and their friction is mainly due to air drag. A similar phase was not observed in the avalanches of the small ballotini. In spite of the differences in the time evolution of the granular avalanches for the different grain sizes, there are also clear consistencies:
– For both grain sizes and all inclination angles the mea-sured downstream velocities showed a clear decelerating trend from the head to the tail of the avalanche
– Slip velocities and depth averaged velocities decreased strongest in the head of the granular avalanches staying constant, respectively, decreasing at smaller rates for the other parts of the avalanches.
3.3 Side-wall effects
When observing a chute flow through a side-wall it is impor-tant to estimate, how much the friction with the side-wall disturbs the studied flow. This is a difficult task. With our laboratory setup we were able to measure basal slip veloc-ities with optical velocity sensors at the centre-line of the chute. This allowed us to estimate the effect of side-wall friction on the measured velocity profile. We checked the reliability of the data obtained from the optical sensors by conducting several experiments in which we recorded the flow through a glass window from the bottom of the chute with the high-speed camera. Here we saw good agreement between the velocities obtained from optical sensors and the
high-speed camera. Only at the avalanche head with our opti-cal sensors it was difficult to capture the strongly decelerating slip velocities properly. In Fig.8the velocity data from the optical sensors at the centre-line of the chute is compared to the velocities obtained from the camera when it was installed at the side-wall. This comparison reveals that the slip veloc-ities at the centre-line of the flow are faster than next to the side-wall. This indicates that the side-wall friction especially near the ground is not negligible. On the other hand the slip velocities in the centre-line of the flowqualitatively behave in the same way as next to the side-wall. They decrease very fast at the head of the avalanche and stay constant for the rest of the flow. This indicates that in the middle of the flow qualitatively the same processes occurs, with the difference that the side-wall friction diminishes the velocities near the side-walls.
Another indication that the side-wall effects are not dom-inant in our granular experiments was found by comparing the flow depth measurements from the high-speed camera at the side-wall to the values measured by the ultrasonic flow height sensor which was installed at the centre-line of the flow. Quantitative good agreement was obtained for most parts of the flows, which indicates a nearly uniform distribu-tion of the flow depth over the cross secdistribu-tion of the chute.
4 Conclusions and outlook
A series of experiments has been conducted on a wooden laboratory chute in which a finite mass of granular material was released from rest. By means of a fast, modern high-speed camera and an appropriate pattern matching algorithm, downstream velocities with very high temporal and spatial resolution could be measured. Although the chute dimen-sions were large in comparison to particle sizes and a huge amount of particles was employed in the experiments (com-pare Table1), no equilibrium state in form of a stationary velocity profile could be observed. For all experiments, the depth averaged velocity decreased through the flow: the front of the avalanche moved fastest and the granular avalanches
elongated while flowing downslope. Behind the front, the slip velocities decreased rapidly. After this first strong decrease, slip velocities remained mainly constant for the rest of the avalanche. The surface velocities decreased less rapidly in the beginning but strongly towards the tail.
In the experiments with the small ballotini we observed a very complex shearing behaviour, which varied strongly with the position in the avalanche. The velocities of the ballotini relative to each other, which are measured by the mean shear rate, were connected to the flow depth: The higher the flow depth, the smaller were the relative velocities. In spite of the complex position dependent shapes of the velocity profiles, a time invariant point was found at the centre-line of the flow when the flow depth and velocities were accordingly scaled. For the large ballotini, the change of the relative veloci-ties was less pronounced during the avalanche event. Here the scaled velocity profiles essentially collapsed all to one single curve. We suggest that this is due to the much smaller amount of particles (approximately one tenth of the flow depth in particle layers) and a different boundary condition on the running surface. Towards the end of the avalanches of large ballotini, a very dilute phase with weak particle interactions was observed.
An interesting result of our experiments is that one flow height was associated with more than one discharge value. This implies that a simple avalanche rheology which relates discharge to flow height [21,29] is not sufficient to model these finite mass flows. To be able to reproduce our exper-imental results correctly, rheological laws also have to con-sider time dependent processes which take place when a finite mass of granular material moves down a flat incline.
In order to better understand the effects of the roughness of the running surface and the size of the glass beads, more experiments will be conducted: The running surface will be varied by gluing sand papers with different roughness on the running surface. Ballotini with a medium grain size of around 0.5 mm will be employed as well. Furthermore, binary mix-tures of ballotini will be examined.
By studying dam break experiments of granular material, we hope to learn more about geophysical flows such as snow avalanches, debris flows and landslides, where a finite mass of granular material is released from rest. Indeed, similar to our experiments, in full-scale snow avalanches triggered at the SLF test site in Vallée de la Sionne we also observe a changing shear behaviour between the head and the tail of the avalanche [30]. Simultaneously high-speed recording of snow chute flows are performed in order to obtain the chang-ing shear behaviour in small scale snow avalanches. Acknowledgments The authors gratefully acknowledge Thomas Rösgen’s help for developing the pattern matching algorithm and to learn to understand some strange features of the high-speed camera. Financial funding for the project by the Swiss National Science Founda-tion under grant number 200021-112223 is acknowledged. The authors
thank K. Hutter and an anonymous reviewer for their interesting sug-gestions and remarks on the manuscript.
References
1. Savage, S.B.: Gravity flow of cohesionless granular materials in chutes and channels. J. Fluid Mech. 92(MAY), 53 (1979) 2. Hutter, K., Koch, T., Pluss, C., Savage, S.B.: The dynamics of
ava-lanches of granular materials from initiation to runout. II: experi-ments. Acta Mech. 109(1–4), 127–165 (1995)
3. Pouliquen, O.: Scaling laws in granular flows down rough inclined planes. Phys. Fluids 11(3), 542–548 (1999)
4. Louge, M.Y., Keast, S.C.: On dense granular flows down flat fric-tional inclines. Phys. Fluids 13(5), 1213–1233 (2001)
5. Jop, P., Forterre, Y., Pouliquen, O.: Crucial role of sidewalls in granular surface flows: consequences for the rheology. J. Fluid Mech. 541, 167–192 (2005)
6. Louge, M.Y.: Computer simulations of rapid granular flows of spheres interacting with a flat, frictional boundary. Phys. Flu-ids 6(7), 2253–2269 (1994)
7. Herrmann, H.J., Luding, S.: Modeling granular media on the com-puter. Continuum Mech. Thermodyn. 10(4), 189–231 (1998) 8. Silbert, L.E., Ertas, D., Grest, G.S., Halsey, T.C., Levine D.,
Plimp-ton S.J.: Granular flow down an inclined plane: Bagnold scaling and rheology. Phys. Rev. E, 6405(5, Part 1) Nov 2001
9. Silbert, L.E., Landry, J.W., Grest, G.S.: Granular flow down a rough inclined plane: transition between thin and thick piles. Phys. Flu-ids 15(1), 1–10 (2003)
10. Bagnold, R.A.: Experiments on a gravity-free dispersion of large solid spheres in a newtonian fluid under shear. Proc. R. Soc. Lond. Ser. A Math. Phys. Sci. 225, 49–63 (1954)
11. Jenkins, J.T., Savage, S.B.: A Theory for the rapid flow of identical, smooth, nearly elastic, spherical particles. J. Fluid Mech. 130(MAY), 187–202 (1983)
12. Lun, C.K.K., Savage, S.B., Jeffrey, D.J., Chepurniy, N.: Kinetic theories for granular flow: inelastic particles in Couette flow and slightly inelastic particles in a general flow field. J. Fluid Mech. 140, (1984)
13. Savage, S.B., Hutter, K.: The motion of a finite mass of granular material down a rough incline. J. Fluid Mech. 199, 177–215 (1989) 14. Jop, P., Forterre, Y., Pouliquen, O.: A constitutive law for dense
granular flows. Nature 441(7094), 727–730 (2006)
15. Pouliquen, O., Cassar, C., Jop, P., Forterre, Y., Nicolas, M.: Flow of dense granular material: towards simple constitutive laws. J. Stat. Mech. Theory Exp. (July 2006)
16. Delannay, R., Louge, M., Richard, P., Taberlet, N., Valance, A.: Towards a theoretical picture of dense granular flows down inclines. Nat. Mater. 6(2), 99–108 (2007)
17. Greve, R., Hutter, K.: Motion of a granular avalanche in a con-vex and concave curved chute : experiments and theoretical pre-dictions. Philos. Trans. R. Soc. Lond. Ser. A Math. Phys. Eng. Sci. 342(1666), 573–600 (1993)
18. Greve, R., Koch, T., Hutter, K.: Unconfined flow of granular ava-lanches along a partly curved surface I theory. Proc. R. Soc. Lond. Ser. A Math. Phys. Eng. Sci., 445(1924):399–413, 9 May 1994 19. Gray, J.M.N.T., Wieland, M., Hutter, K.: Gravity-driven free
sur-face flow of granular avalanches over complex basal topography. Proc. R. Soc. Lond. Ser. A Math. Phys. Eng. Sci. 455(1985):1841– 1874, 8 May 1999
20. Pudasaini, S., Hutter, K.: Avalanche Dynamics. Springer, Berlin (2007)
21. Ancey, C.: Dry granular flows down an inclined channel: exper-imental investigations on the frictional-collisional regime. Phys. Rev. E 65(1, Part 1) (Jan 2002)
22. Barbolini, M., Biancardi, A., Natale, L., Pagliardi, M.: A low cost system for the estimation of concentration and velocity profiles in rapid dry granular flows. Cold Reg. Sci. Technol., 43(1–2, Sp. Iss. SI):49–61, NOV 2005. 1st General Meeting of the European-Geo-sciences-Union, Nice, France, Apr 25 (2004)
23. Azanza, E., Chevoir, F., Moucheront, P.: Experimental study of collisional granular flows down an inclined plane. J. Fluid Mech. 400, 199–227 (1999)
24. Bartelt, P., Buser, O., Platzer, K.: Starving avalanches: frictional mechanisms at the tails of finite-sized mass movements. Geophys. Res. Lett. 34(20) (2007)
25. Roche, O., Montserrat, S., Nino, Y., Tamburrino, A.: Experimental observations of water-like behavior of initially fluidized, dam break granular flows and their relevance for the propagation of ash-rich pyroclastic flows. J. Geophys. Res. Solid Earth 113(B12), 1 Dec 2008
26. Hungr, O.: Simplified models of spreading flow of dry granular material. Can. Geotech. J. 45(8), 1156–1168 (2008)
27. Tiefenbacher, F., Kern, M.A.: Experimental devices to determine snow avalanche basal friction and velocity profiles. Cold Reg. Sci. Technol. 38(1), 17–30 (2004)
28. Meinhart, C.D., Wereley, S.T., Santiago, J.G.: A PIV algorithm for estimating time-averaged velocity fields. J. Fluids Eng. Trans. ASME 122(2), 285–289 (2000)
29. Pouliquen, O.: On the shape of granular fronts down rough inclined planes. Phys. Fluids 11(7), 1956–1958 (1999)
30. Kern, M.A., Bartelt, P., Sovilla, B., Buser, O.: Measured shear rates in large dry and wet snow avalanches. J. Glaciol. 55(190), 327– 338 (2009)