2: Comparison of copper-, nickel-, and iron-based oxygen carriers
The MIT Faculty has made this article openly available. Please share
how this access benefits you. Your story matters.
Citation Zhao, Zhenlong, and Ahmed F. Ghoniem. “Design of a Rotary
Reactor for Chemical-Looping Combustion. Part 2: Comparison of Copper-, Nickel-, and Iron-Based Oxygen Carriers.” Fuel 121 (April 2014): 344-360.
As Published http://dx.doi.org/10.1016/j.fuel.2013.11.055
Publisher Elsevier
Version Author's final manuscript
Citable link http://hdl.handle.net/1721.1/105381
Terms of Use Creative Commons Attribution-NonCommercial-NoDerivs License
Design of a Rotary Reactor for Chemical-looping
Combustion. Part 2: Comparison of Copper-,
Nickel-, and Iron-based Oxygen Carriers.
Zhenlong Zhao, Ahmed F. Ghoniem
Department of Mechanical Engineering, Massachusetts Institute of Technology 77 Massachusetts Avenue, Cambridge, MA 02139-4307, USA
Abstract
Chemical-looping combustion (CLC) is a novel and promising option for several applications
including carbon capture (CC), fuel reforming, H2 generation, etc. Previous studies demonstrated
the feasibility of performing CLC in a novel rotary design with micro-channel structures. Part 1
of this series studied the fundamentals of the reactor design and proposed a comprehensive
design procedure, enabling a systematic methodology of designing and evaluating the rotary
CLC reactor with different OCs and operating conditions. This paper presents the application of
the methodology to the designs with three commonly used OCs, i.e., copper, nickel, and iron. The physical properties and the reactivities of the three OCs are compared at operating conditions suitable for the rotary CLC. Nickel has the highest reduction rate, but relatively slow oxidation reactivity while the iron reduction rate is most sensitive to the fuel concentration. The design parameters and the operating conditions for the three OCs are selected, following the
Corresponding author. Tel.: +1 617 253 2295.
strategies proposed in Part 1, and the performances are evaluated using a one-dimensional plug-flow model developed previously. The simulations show that for all OCs, complete fuel conversion and high carbon separation efficiency can be achieved at periodic stationary state with reasonable operational stabilities. The nickel-based design includes the smallest dimensions because of its fast reduction rate. The operation of nickel case is mainly limited to the slow oxidation rate, and hence a relatively large share of air sector is used. The iron-based design has the largest size, due to its slow reduction reactivity near the exit or in the fuel purge sector where the fuel concentration is low. The gas flow temperature increases monotonically for all the cases, and is mainly determined by the solid temperature. In the periodic state, the local temperature variation is within 40K and the thermal distortion is limited. The design of the rotary CLC is also scaled to different pressures and inlet temperatures. The method of scaling is discussed and desirable operational performances are obtained.
Keywords
Chemical-looping combustion, rotary reactor, CO2 capture, oxygen carriers
Content
Abstract ... 1 Keywords ... 2 Content ... 2 Nomenclature ... 3 1. Introduction ... 5 2. Reactor Design ... 74. Results ... 18 5. Discussion ... 27 6. Conclusion ... 30 Acknowledgement ... 32 Reference ... 33 Appendix A ... 61
Nomenclature
Symbols A cross-sectional area, m2 a pressure coefficientCi concentration of species i, mol m-3
D reactor diameter, m
d channel width, m
Ea activation energy, J mol-1
Eg, Es energy of gas or solid, J m-3
H channel height, m
Hg enthalpy of gas, J m-3
hgs heat transfer coefficient between phases, W m-2 K-1
,
ˆ
s i
h molar enthalpy for species, J mol-1
k, kp reaction rate constant, m(3n-3) mol(1-n) s-1, n is the reaction order
ks, kg thermal conductivity of solid or gas phase, W m-1 K-1
k0 pre-exponential factor, m(3n-3) mol(1-n) s-1, n is the reaction order
mox mass of fully oxidized oxygen carrier, kg
mred mass of fully reduced oxygen carrier, kg
n reaction order
P operating pressure, Pa
Pc inner perimeter of the channel, m
pi,out partial pressure of species i, Pa
Qgs heat flux from gas phase to solid phase, W m-2
T temperature, K
u velocity, m s-1
X conversion of oxygen carrier
xi molar fraction of species i
Greek letters
δbulk thickness of the bulk support layer, m
δoc thickness of the porous oxygen carrier layer, m
εM cross-section area ratio of solid
εg porosity of the solid
ν stoichiometric coefficient
θi size of sector i, rad
ρ density, kg m-3
ˆ
molar density, mol m-3
τ cyclic period time, s
ω overall molar reaction rate, mol m-2s-1
Acronyms
CC carbon capture
CLC chemical-looping combustion
OC oxygen carrier
Redox reduction and oxidation
1. Introduction
Chemical-looping combustion (CLC) is a novel and promising technology for carbon capture
(CC). In CLC, the combustion process is performed in two reactors: a fuel reactor and an air
reactor. A solid oxygen carrier (OC) is circulated between these two reactors to transport
undiluted oxygen from air to fuel. The exhaust gas from the reduction contains only CO2 and
medium, the direct contact between air and fuel is circumvented and hence energy-intensive gas
separation processes are avoided.
CLC is mostly carried out in two interconnected fluidized-bed reactors with the OC in the form
of particles circulating in between [1-7]. Alternatively, a rotary reactor consisting of a large
number of micro-channels was proposed in previous studies [8-12]. As shown in Figure 1a, the
rotary reactor has a rotary wheel, which rotates through four sectors, i.e., fuel, air, and two steam
purging sectors. The wheel consists of a large number of channels (Figure 1b) with the OC
coated onto their inner walls. As shown in Figure 1c, the channel wall has two solid layers: a
highly porous OC layer and a bulk dense inert substrate. The porous layer consists of active
metal oxides, as well as inert binders to maintain the pore structures. Pressurized streams flow
though the reactor and react with the OCs to generate the product stream, in this case CO2/H2O,
and the oxygen-depleted air stream. A complete description of the reactor design and
functionality can be found in refs. [12, 13].
Few studies have been carried out to examine the performances of the rotary reactor for CLC
under different conditions [8, 9, 11, 14]. Pavone and co-workers [8, 9] simulated the initial
reduction and oxidation (redox) cycles of the reactor with NiO/Al2O3 as the OC, and observed
90% separation efficiency but large temperature variations. Zhao et al. [11] examined a
copper-based design with a dense boron-nitride support layer, and obtained a stable and periodically
stationary performance with complete fuel conversion and carbon separation. However, the
behavior strongly depends on the choice of the OCs, the designs, and the operating conditions
many parameters are closely involved and coupled, all of which strongly affect the
functionalities of the reactor. Thus, a comprehensive parametric study is important to understand
the intrinsic logics and develop the optimized procedures of design under different conditions.
The objective of this two-part series is to investigate the fundamental relations among the design
parameters, develop a systematic design procedure, and compare the performances of the design
under different conditions. In Part 1, the fundamental effects of the OC characteristics, the
reactor configurations, and the operating conditions are examined. A systematic procedure is
proposed on the basis of the parametric study. Part 2 presents the application of this procedure to
three commonly used OCs, i.e., copper, nickel, and iron. The reaction mechanisms utilized in
this study are based on the one-step overall kinetics proposed by Abad and co-workers [15-17].
The redox reactivities of the OCs are analyzed and compared, and their effects on the choice of
design are discussed. The performances of rotary reactor with the three OCs are illustrated and
the key parameters for each case are identified. The effects of the operating temperature and
pressure on the design are also studied and the scaling strategies to different conditions are
proposed.
2. Reactor Design
A number of criteria should be satisfied for the design of a rotary reactor, including complete (>99%) fuel conversion, sufficient (>95%) CO2 separation, and adequate operational stabilities.
To achieve these objectives, three groups of parameters can be specified, (i.e., the material selection, the reactor configuration, and the operational conditions), following the procedure
proposed in Part 1 (see Figure 7 in ref. [13]). For the scope of this study, the design focuses on the methane-fueled CLC with a target thermal power output of 1MWth.
Operation Specifications
As pointed out in Part 1, higher operating temperatures are always preferred to obtain better
performances and higher system efficiencies. For CLC process, however, concerns over the
temperature distribution and fluctuation inside the reactor, which may cause thermal and
mechanical stresses at high temperatures, must be addressed. A reasonable operating temperature for CLC is in the range of 1000-1200℃ [1, 18]. For the purpose of comparison, the exhaust temperature of the reactor is specified to be around 1200℃ and the inlet temperature is 550℃. For the copper-based design, the exit temperature is further constrained below the melting point
of copper. The operating pressure of 10 atm is selected on the basis of the system integration [19]
with a pilot-level reactor. In Section 5, the designs and performances with different inlet
temperatures and operating pressures are also presented.
OC Design
The active metal oxides used in this study are nickel-, copper-, and iron-oxides, which have been
widely suggested as the most promising OC candidates for CLC (e.g., nickel [20-23], copper [16,
20, 23, 24], and iron [20, 25, 26]). Important physical and chemical properties of these metal
oxides are summarized in Table 1. The experimental studies performed by Abad and co-workers
[15-17] cover a wide range of temperature and pressures for all three OCs using a similar
experimental setup. The redox reactivities were analyzed by thermogravimetry (TG) at
temperature ranging from 773 to 1073 K for the copper-based OC and from 873 to 1223 K for
the nickel-, and iron-based OCs. The OCs obtained with the same preparation methods, and thus
the same physical (loading content, porosity, tortuosity, active surface area, metal dispersion,
grain thickness, inert binder, etc.) and chemical characteristics (chemical kinetics), are used in
this study as the OC layers on the channel walls. As seen in Table 1, the copper-based OC
prepared by wet-impregnation possesses higher specific surface area and porosity, while the
nickel- and iron-based OCs prepared by freeze-granulation have higher loading of active metal
oxides.
The reaction mechanism [15-17] is based on the kinetics-controlled unreacted shrinking-core
model (USCM), which assumes that within each grain of metal oxide (or metal), as the reaction
progresses it leaves behind a layer of product (e.g, Cu for reduction and CuO for oxidation). For
the OCs investigated in refs. [15-17], the mass diffusion is fast compared to the chemical
reactions such that the active metal oxide (or metal) on the unreacted core surface is exposed to
the reactant in the bulk flow. Thus, the redox rates can be expressed as [11, 15, 17, 27],
/ 0 , 0 0 ˆ , a E RT n oc g s m i dX P k e C X X dt P (1)where ˆm i, is the molar density of the active metal oxide (or metal) grain. voc is the stoichiometric
coefficient. k0 is the Arrhenius constant. Cg,s is the concentration of the gaseous reactant at the
exterior surface of the OC layer and n is reaction order. X is the non-dimensional conversion of
the OC: it equals zero when the OC is fully reduced and unity when fully oxidized. The term (X0
– X) describes the effect of the OC conversion on the redox rates, where X0 is the final state of
coefficient, β, accounts for structural differences of the active metal oxide grains in the OCs. The
active metal oxide in the Fe- and Ni-based OCs prepared by freeze-granulation exhibits a
granular grain structure, and the USCM for spherical grains was considered (β= 2/3), while the
USCM for plate-like geometry in the porous surface of the OC was considered for the Cu-based
OC prepared by impregnation (β = 0) [15]. The reaction rate may increase at higher pressure
because of the reactant concentration, Cg,s [28-30]. On the other hand, this increase in the
reaction rate is lower than expected due to the saturation of gas molecules in the active sites on
the grain, as reported in refs. [13, 16]. This pressure-inhibition effect of the operating pressure is
described empirically [16] by the term (P/P0)-a where a is the pressure coefficient and P0 is
atmospheric pressure. The overall effect of pressure depends on the contributions from both
factors, as showed in Section 5. In Eq.(1), complete fuel conversion is assumed under
thermodynamic equilibrium [1, 15, 31] and the reverse reaction and the decomposition of H2O
(or CO2) into H2 (or CO) are neglected.
The kinetic parameters are listed in Table 1. As an example, Figure 2 shows the typical OC
conversion (X) profiles as a function of time for the redox reactions of the three OCs. The
reduction rate of copper oxide is faster than the other two OCs, while the oxidation rate of copper
or iron is faster than that of nickel. The conversion rates of copper are linear with time because
of the plat-like grain geometry. In contrast, the reaction rates of nickel and iron depend on the
amount of oxygen available in the OC, and as the conversion approaches full reduction or
oxidation, the rates decrease significantly. Among these OCs, nickel has the lowest oxidation
rate, especially when X is close to unity. The time required to oxidize nickel from X = 0.9 to X =
intermediate range of the OC conversions is used to maintain reasonable reaction rates. From
Figure 2, the reduction rate is in general slower than the oxidation rate for the three OCs.
In order to apply the reaction kinetics expressed by Eq.(1), the chemical kinetics must be the
rate-limiting step and the mass diffusion within the porous layer should be of limited significance,
as in refs. [15-17]. The thickness of the OC layer, δoc, is thus selected to be 50 μm, and the
Damköhler number, i.e., Dain = τin /τr1, remains smaller than 0.05 for all the three OCs over a
wide range of operating conditions. Therefore, the gas reaction rates can be expressed as:
, , , ˆ g i oc oc oc m i oc g i oc oc dX v v v dt (2)
where vg,i is the stoichiometric coefficient for the gas species, εoc is the volume fraction of the
active metal in the porous OC layer, and δoc is the thickness of porous OC layer (50 μm).
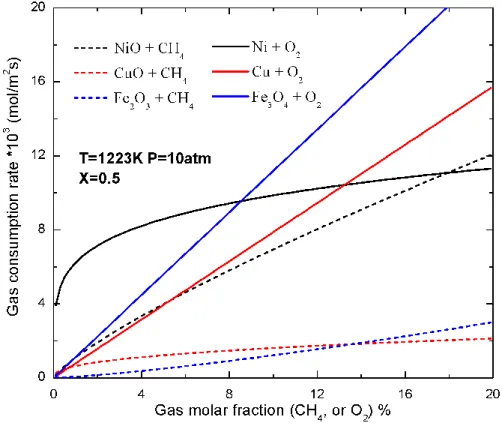
As an example, Figure 3 shows the typical gas reaction rate profiles as a function of gas
concentration (CH4 or O2) for the redox reactions of the three OCs. Among them, the
nickel-based OC has the highest fuel consumption rate. Because of the low active metal oxide loading
(xMeO), copper has an intermediate reduction rate although the conversion rate of OC is fastest
(Figure 2). Within the majority of the fuel concentration range, the fuel consumption rate of iron
is the lowest. The reduction rates of nickel and iron strongly depend on the local fuel
concentration, and therefore in the CLC process, a higher feed concentration at the inlet is
preferred. In contrast, the copper reduction rate is less sensitive to the fuel concentration. All the
OCs have a higher oxygen consumption rate as compared to the fuel consumption rate, also seen
1
τin is the characteristic time of conversion in an internal-diffusion controlled process, and τin is the that in
in Figure 2. The oxidation rate of copper and iron are highly dependent on the oxygen
concentration, and thus a high air feed rate is recommended in order to reduce the size of the
reactor. On the other hand, the nickel oxidation is less sensitive to oxygen, and hence a large
sector is required to sufficiently re-oxidize the OC.
The usage of the dense support layer is critical to the thermal stability of the reactor during
repeated cycles [14]: the dense layer acts as a heat reservoir to temporarily store energy from the
exothermic oxidation, redistribute heat within the solid wheel, heat up the flow, and sustain the
endothermic reduction. Boron nitride (BN) is used as the support material for the dense layer
owing to its key properties, such as high thermal conductivity, low thermal expansion, and high
chemical stability in an oxidizing environment. To select the thickness (δbulk) of the support layer,
we can estimate the maximum temperature fluctuation (∆Tmax) by matching the thermal inertia to
the exothermic heat release from the metal oxidation in the OC layer:
max
r oc oc oc bulk bulk bulk
O h R X c T vM (3)
where ρbulk, cbulk are the density and specific heat of the bulk layer, MO is the atomic weight of
oxygen, ∆X is the range of the OC conversion utilized for reaction, ρoc and Roc are the density
and oxygen transport capacity, ∆hr is the enthalpy of the exothermic reaction. With δbulk of about
200 μm, the maximum temperature variation (∆Tmax) is constrained below 50K for all the OCs
(assuming ∆X~30%).
In this study, squared-shaped channels are used for all three designs. As pointed out in Part 1, the
channel width should be large enough to accommodate both layers of the solid and mitigate
convective cooling near the inlet. On the other hand, the channel width is constrained below a
certain value to reduce the external mass diffusion resistance. On the basis of the reaction
kinetics, a channel width of 2 mm is used, and hence the Damköhler number 2, i.e., Daex = τex/τr,
is less than 0.1 for all the cases.
The reduction rate along the channel depends on the local fuel concentration, temperature and
the available OC. Therefore, a detailed model, as presented in Section 3, is required to obtain an
accurate profile of the fuel consumption. However, for the purpose of design and comparison, an
ideal scenario assuming a steady-state isothermal reactive flow with sufficient OCs along the
channel can be solved analytically to approximate the fuel conversion in the reactor. The
methane conversion (xCH4) versus the channel height (z) can be calculated as (see Appendix A):
0 4 1 1 0 ,0 2 2 1 1 n n y z c oc oc p tot n n y P CH P k C z d A u x
, where 4 1 2 CH 1 y x (4)Here Ap is the cross-section area of the channel, Pc is the channel perimeter. u0 is the feed
velocity, and xCH4,0 is the inlet fuel volume fraction. kp is the Arrhenius reaction rate constant,
which equals (P/P0)-ak0exp(-E/RuT). y(z) is defined as (2xCH4 + 1)-1 and at z = 0, y0 equals (2xCH4,0
+ 1)-1. For complete fuel conversion y equals unity.
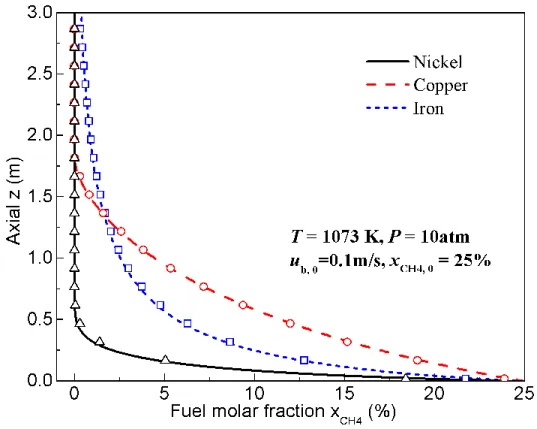
As an example, Figure 4 shows the fuel concentration profiles along the channels for the three OCs at 1073 K and 10 atm. The fuel concentration gradually decreases along the channel for the
2 τ
three cases, with nickel consuming the fuel faster than the other two. The fuel conversion of iron is faster than copper initially; however, in the downstream, the reduction rate slows down significantly. This is because the reduction reaction of iron oxide strongly depends on the local concentration of fuel (reaction order above unity). Thus, the integral on the left hand side of Eq. (4) diverges as the fuel concentration drops to zero, and as a result, the complete conversion of fuel is not reached at finite reactor height. In contrast, for nickel or copper, the fuel fraction decreases to zero at a finite height (z100%).
The reactor height required to consume 99.0% of the fuel, z99%, can be calculated according to
Eq.(4). Figure 5 shows z99% for all the OCs with varying inlet fuel concentration (xCH4,0). As seen
in Figure 5, a higher temperature significantly reduces z99%. Nickel has the shortest z99% because
of its fast reduction rate with methane. For copper or nickel, z99% increases monotonically with
the rise of xCH4,0. Thus, xCH4,0 should be maintained below a certain level for nickel- (e.g.,
20%~30%) and copper-based designs (e.g., 10%~20%). In contrast, z99% for iron shows a
bell-shaped curve: z99% is large when xCH4,0 is either very low or very high. This is again due to the
fact that the reduction of iron oxide is highly sensitive to the local fuel concentration. Therefore, for iron-based designs, a high feed concentration is preferred (e.g., 40%~50%).
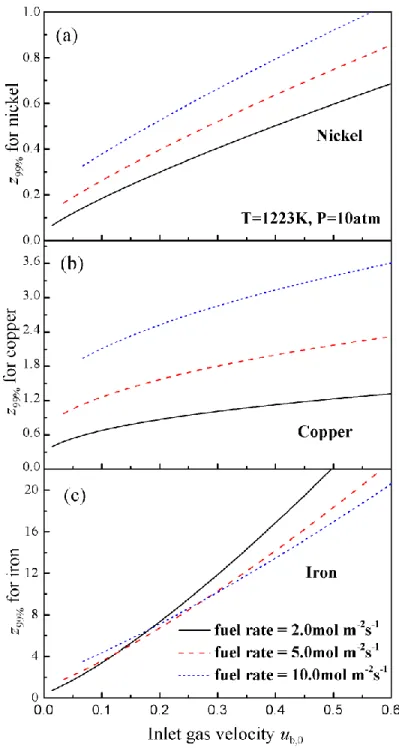
Figure 6 shows z99% as a function of the inlet gas velocity u0 at fixed fuel feed rates. For nickel,
the predicted z99%’s are similar with each other, and they are relatively small (below 1.0m). Thus
a high fuel feed rate is used for the nickel-based design. For copper, on the other hand, a significant raise of z99% is observed at high feed rate and thus the lowest fuel flow rate is adapted
velocity z99% increases with increasing fuel rate, while at high velocity the opposite trend is
observed. Two flow rates, 2.0 and 5.0 mol m-2s-1, require a similar height for conversion at low
inlet velocity. Thus, the intermediate fuel flow rate is selected for the iron-based design.
Combining the results in Figure 3, Figure 5 and Figure 6, the inlet fuel molar fraction (xCH4,0) for
copper-, nickel-, and iron-based designs are selected to be 15%, 25%, and 50%, as listed in Table 2. The reasonable inlet velocity (ufuel) is 0.09 m/s for copper, 0.25 m/s for nickel, and 0.065m/s
for iron. The reactor heights are then selected accordingly, to be 0.75m, 1.00m, and 1.50m for nickel, copper, and iron, respectively.
The steam purge velocity (ufuel,p) in the fuel purge sector should be similar to ufuel to completely
oxidize the residual fuel. As the channel moves to the fuel purge sector, the purging steam at the
inlet lowers the fuel concentration. As a result, for copper or nickel as OC, a slightly faster
purging stream velocity (as compared to the fuel flow velocity) can be used owing to the
monotonic relationship between z99% and xCH4,0 as showed in Figure 5. For the iron case,
however, ufuel,p should be slower than ufuel since z99% moves backwards along the curve to a much
higher value as the concentration decreases. As listed in Table 2, ufuel,p is 0.11m/s, 0.3m/s,
0.06m/s for the copper-, nickel-, and iron-based designs, respectively.
To separate the residual CO2, the residence time (τfuel,p) of a channel in the fuel purge sector is
then selected to be slightly longer than the steam residence time through the channel (tfuel,p). As
listed in Table 2, τfuel,p is 6s, 2s and 15s for copper, nickel, and iron. Here it is obvious that owing
iron-based design takes a larger share compared to nickel and copper. On the other hand, the purge
velocity in the air purge sector (uair,p) can be much higher owing to the absence of conversion
requirement, and therefore, the channel residence time (τair,p) in the air purge sector is much
shorter. In this study, τair,p is selected to be around 1s and uair,p is around 1.0 m/s for all the three
designs.
The channel residence time in the fuel sector (τfuel) is constrained to avoid complete OC
reduction and that in the air sector (τair) should be long enough to provide sufficient re-oxidation.
Figure 2 shows the conversion time of the OCs under typical conditions in the rotary reactor. As
seen in Figure 2, the reduction of copper oxide is relatively fast, and a complete reduction is
achieved after 20s. In contrast, it takes a much longer time for nickel- or iron-based OC to be
fully reduced. However, the reduction rate drops significantly as NiO or Fe2O3 is reduced. Thus,
τfuel is selected to be 15s for copper-based design, and around 10s for the nickel- and iron-based
designs. As seen in Figure 2, the complete oxidation of copper and iron occurs within 7s. On the
other hand, the oxidation rate of nickel is much slower, and it takes about 15s to re-oxidize
nickel from X=0.3 to X=0.7. Therefore, τair of about 7s is used for copper and iron, and of about
15s for the nickel design.
With the choice of the channel residence time in each sector, a cycle period (τ) of 30s is selected
in this study for all three OCs for the purpose of comparison. The size of each sector (θ) can then
be obtained accordingly. The diameter of the reactor is determined to achieve the target thermal
temperature. Thus, the air velocity, uair, is selected to be 0.7 m/s, 1.0m/s, and 1.0m/s for copper,
nickel, and iron, respectively.
3. Model Formulation
A one-dimensional model was developed previously [11] to analyze the heat and mass transfer processes within the reactor. Since the entire solid reactor shares the same angular velocity, each individual channel experiences the same sequence of events in each sector. Thus, the model focuses on the reactive flow within one channel. The pressure variation, caused by laminar skin friction, is negligible [14], and a constant thermodynamic pressure is assumed. The solid phase is treated with fin approximation because of the high thermal conductivity of the dense support material. The thermal radiation is neglected due to the relatively low temperature and the small channel size. The governing equations are the species, and energy conservation equations for both solid and gas phases:
g g i,
g g i,
p c i C x uC x A P t z : Gas species(5)
1 g
s oc c oc C A P t : Solid species (6)
, ˆ g g p c gs c s i i i uH E A P Q P h t z
: Gas energy (7) , ˆ s s s s s c gs c s i i i E T A A k P Q P h t z z
: Solid energy (8)Here Ap, Aoc, and As are the cross-section areas of the channel, the porous OC layer, and the solid
concentration, mole fraction, rate of reaction, velocity, energy, enthalpy, and temperature of the bulk flow. Cs, εg, ωoc, Es, Ts, and ks are the concentration, porosity, rate of reaction, energy,
temperature, and thermal conductivity of the solid. hˆs i, is the molar enthalpy of species i
produced (or consumed) in the porous layer, and Qgs is the inter-phase convective heat transfer
rate, calculated as, Qgs = hgs (Tg – Ts). A detailed description of the model formulation and
numerical solution is given in ref. [11].
Equations (5)-(8) are solved numerically using the method of lines with upwind discretization along the spatial coordinate. Eight species are included in the simulation, i.e., CH4, CO2, H2O,
O2, N2, metal, metal oxide, and inert binder. The thermal and transport properties of the gas
mixture and the solid phase are calculated dynamically using the NIST property database [32]. The numerical simulation was tested using the isothermal reactive flow scenario as presented in Section 2. Figure 4 compares between predicted results (symbols) and analytical solutions (lines) and a perfect agreement is obtained. For each design, the above equations are integrated, following a sequence of fuel sector, fuel purge sector, air sector and air purge sector. The simulation is repeated until the reactor performances reach a periodic stationary state, i.e.,
2 3 0 0 1 , , 10 H s s s T T z t T z t dzdt K H
(9) 4. ResultsThe periodic performances of the three designs are listed in Table 3. The fuel conversion
4
4
,
, 1 fuel zone CH out I CH in fuel zone m dt m dt
, 2 4 2 2 4 , , , , CO out CH out fuel zone CO CO in CH in fuel zone m m dt m m dt
(10)where mi in, and mi out, are the mass flow rate of species iat the inlet and the exit respectively. All
the fuel conversion efficiencies are above 99%. Nickel converts the fuel fastest and it takes only
0.49 m of the channel to consume 99% of the fuel. In contrast, z99% for iron is 1.44m, because of
the slow reduction rate near exit where the concentration is low. The carbon separation
efficiency for nickel is unity while that of the iron-based design is around 97%. The design
criteria listed in Section 2 are satisfied for all three cases. The maximum temperature variation
(ΔTmax) is listed in Table 3 and it indicates the extent of thermal distortion during the operation.
Nickel and copper have similar ΔTmax’s (around 20K) while for iron the maximum change is
slightly higher. ΔTmax occurs at the inlet for both copper and iron cases, while for nickel, it
occurs near one-third of the channel from the inlet.
The feed and the flue streams are summarized in Table 3. The merged flue streams in the
chamber downstream are steady. The gas velocities in the fuel zone for copper and iron are
similar, both of which are slower than that for nickel. Copper and nickel have a similar flue gas
composition in the fuel zone. In contrast, xCO2 for iron is much lower since less CO2 is used as
diluant in the feed stream. Nickel has the lowest purge feed rate due to the compactness of the
design. As a result, xH2O for nickel is lowest among the three. For all cases, the air-fuel ratio is
higher than stoichiometry. For iron, a small amount of methane leaves the reactor from the fuel
zone, corresponding to slightly lower fuel conversion at the exit (ηI = 99.12%). For copper or
nickel, on the other hand, fuel is completely consumed within the channel (xCH4 = 0). No
fuel zone. Some CO2 exits the reactor from the air zone for copper or iron, leading to relatively
lower separation efficiencies compared to nickel.
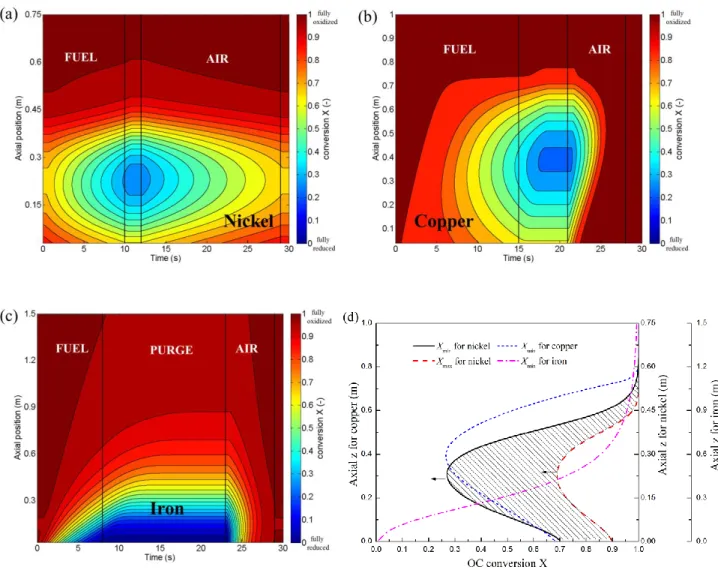
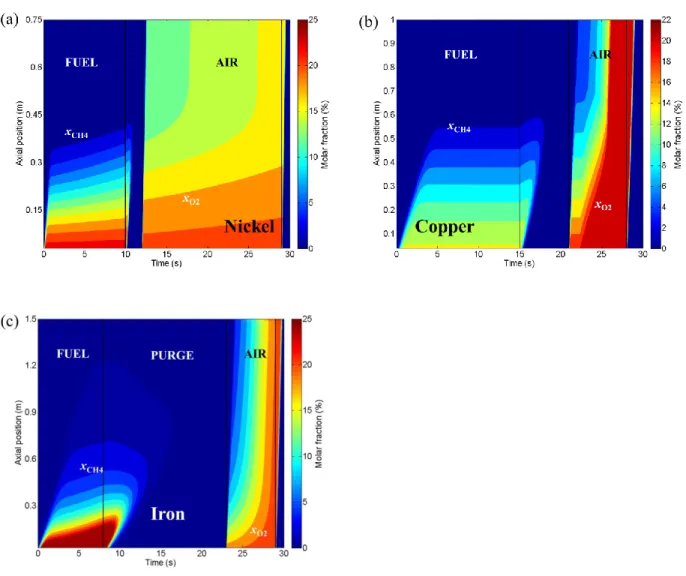
Figure 7a, b, and c shows the OC conversion (X) as a function of time and axis within one cycle for the three OCs. Red indicates higher oxygen concentration in the OC while blue represents
less oxygen. The gradients of the contours indicate the rates of OC conversion. For nickel and
copper, the reduction rates are relatively lower at both the inlet and the exit because of the low
temperature and low fuel concentration, respectively. The reduction rate is fastest near 40% of
the reactor from the bottom, leading to a “blue region” during the fuel purge sector at which the
lowest OC conversion is around 0.3 in both cases. In contrast, because of the strong dependence
on the fuel concentration, the iron has the highest reactivity at the inlet and the lowest X is close
to zero.
For oxidation, copper and iron share a similar pattern. The contours in the air sector (Figure 7b
and Figure 7c) are more packed along the channel and the gradients are almost constant,
although the extent of OC conversion is different along the channel owing to the different
reduction rates in the previous fuel sector. As seen in Figure 7b and Figure 7c, the oxidation rates
for copper and iron are highly sensitive to the oxygen concentration: as the oxygen concentration
rises, the local OC is rapidly regenerated, leading to a slowly moving oxygen front, as seen in Figure 8. However, the nickel oxidation rate is much slower and less sensitive to the local oxygen concentration and hence the OC along the channel is slowly regenerated back to its
initial state. As a result, the nickel-based design takes a larger share of the air sector, and the OC
oxidation rate drops as Ni is re-oxidized, leading to a much longer oxidation time required to
further regenerate the residual metallic nickel in the OC layer. Consequently, as pointed out in
Section 2, not all Ni is re-oxidized at the end of the air sector (Figure 7d). In contrast, for copper
or iron, the majority of the OC is regenerated before the new cycle.
Figure 7d shows the minimum OC conversion (Xmin) within one cycle. For all three cases, the
minimum conversion is reached at the end of the fuel purge sector. The conversion profiles are a
bell-shaped curve for nickel and copper, with a minimum of 0.30 at around 40% of the height
from bottom. Thus, at least 30% of oxygen remains within the OC during the entire cycle, which
mitigates the carbon deposition risk [1, 31]. In contrast, the iron case has a monotonic shape of
Xmin, with the lowest OC conversion close to zero at the inlet. The profiles of Xmin in Figure 7d
provide additional insight to the selection of the OC thickness within the reactor, and for an optimized design, a non-uniform coating could be an interesting option. Figure 7d also shows the maximum OC conversion Xmax for nickel. For iron or copper, Xmax is close to unity along the
channel. The region surrounded by Xmax and Xmin, e.g., the shaded area in Figure 7d, represents
the amount of oxygen that is used in the CLC rotary operation.
Comparing the redox processes for each design, we can conclude that the limiting steps for nickel, copper, and iron are oxidation in the air sector, reduction in the fuel sector, and conversion of the residual fuel near the exit of the reactor and in the purge sector, respectively.
Figure 8 shows the molar fraction of fuel and oxygen inside the channel within one cycle. In the fuel sector, the methane concentration decreases gradually from inlet to exit. Near the outlet, the
methane concentration is zero all the time, indicating high fuel conversion efficiency for all cases.
The CH4 concentration remains relatively stable in the fuel sector. The contours shift slightly
upwards in panels a and c, since for nickel or iron the reduction rate decreases as the OC is
reduced (Eq. (1)). In contrast, the concentration stays constant for copper case after the initial
several seconds during which the flow field becomes fully developed. In the following purge
sector, the contours are further stretched, because of the higher purge rates used in the nickel- or
copper-based cases, and a much slower reduction rate of iron in the fuel purge sector,
respectively. As the channel moves into the air sector, a slowly moving front of oxygen is
observed in panels b and c, which corresponds to the rapid re-oxidization of OC and hence fast
oxygen consumption, as mentioned before. Behind the front, the OC is fully regenerated, and the
flow remains stable for the rest of the stay in the air sector (see Figure 9b). In contrast, the
profiles for nickel vary mildly, leading to a quasi-steady flow field in the air sector (Figure 9a).
As the channel travels to the air purge sector, the residual air is removed and the oxygen
concentration quickly drops to zero.
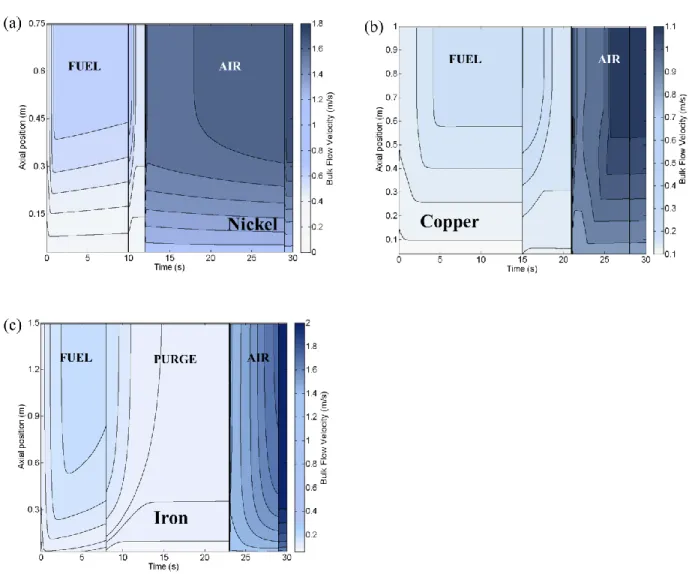
Figure 9 shows the flow velocity in the channel. Light colors correspond to low velocities. In the nickel design (panel a), the flow remains stable for the majority of the period, and only minor
transitions are observed at the beginning of the fuel and the fuel purge sectors. In contrast, the
transition periods for the iron-based design are long and strong variations are observed at the
beginning of all the sectors. The copper case exhibits an intermediate behavior, which has a clear
steady state in the late fuel and air sectors, and also strong oscillations in the fuel purge sector
and at the beginning of the air sector. Fluid velocity variations in the reactor cause pressure
From this perspective, nickel-based design merits over the other two because of its relatively
stable and mildly varying flow fields throughout different sectors.
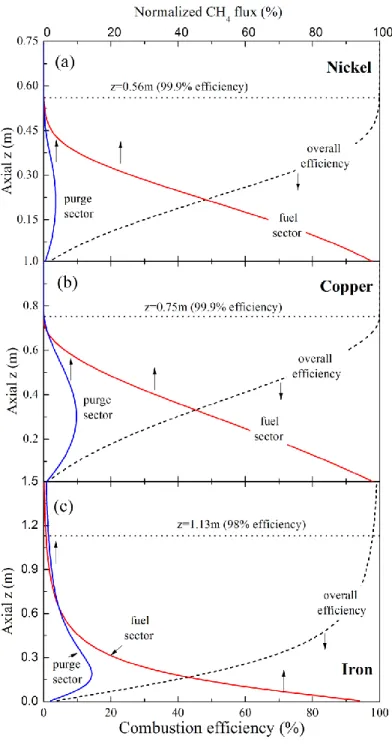
Figure 10 shows the fuel conversion throughout the channel. Here, the conversion of fuel, ηI, as a
function of axis, z, is calculated as [33],
ηI(z) = 1 – CCH4,fuel(z) – CCH4,fuel purge(z) (11)
Here
4
CH
C is the normalized CH4 flux, defined as mCH4
z /mCH inlet4, with mCH4
z being thetime-averaged methane flow rate at z and
4,
CH inlet
m the inlet feed rate. The majority of methane is
consumed within the fuel sector while a small fraction (6% for nickel, 18% for copper, and 29% for iron) is carried over to the following fuel-purge sector and then oxidized by the OC. As seen in Figure 10, almost all methane is converted within 75% of the channel for all the three designs, i.e., 0.56m, 0.75m, and 1.13m for nickel, copper, and iron, respectively. The rest 25% of the
reactor accounts for uncertainties and maintains stable operations under off-design conditions.
As seen in panels a and b, nickel and copper share a similar conversion pattern: the overall
conversion efficiency rises quickly near the inlet, but the increase slows down as it approaches
the exit. The inflection point of the curve corresponds to the position with the fastest reactivity,
as observed in Figure 7. In contrast, iron has a different pattern: the overall efficiency increases
convexly; the methane concentration in the fuel-purge sector exhibits an asymmetric bell-shaped
curve with a fat tail near the exit. This is again due to the fact that reduction of iron strongly
depends on the local fuel concentration and hence as the majority of the fuel is consumed near
the exit, the reduction rate drops significantly. Thus, to reach high fuel conversion efficiency, a
The temperature distribution within the channel is critical to the redox reactivities and the
operational stability. Figure 11 compares the time-averaged temperature distribution of the solid
and gas phases. For all the three OCs, the solid temperature rises monotonically from the inlet to
the exit. The temperature of copper is slightly lower than nickel or iron, owing to the material
limitation, as seen in panel b. The gas temperature is dominated by the solid except at the inlet
where the feed stream is much cooler. As seen in Figure 11, ΔTmax is around 20K for copper or
nickel and about 35K for iron. For iron or copper, ΔTmax occurs at the inlet while for nickel it
occurs around 1/3 of the channel from bottom, as also listed in Table 3.
Figure 12 shows the solid temperature deviation from its time-averaged temperature along the
channel within one cycle. Blue colors correspond to temperature drops and red correspond to
rises. As seen in panels a and c, solid temperature decreases in the fuel sector because of the
convective cooling as well as the endothermic reduction reactions. In the copper case, however,
the heat release from the exothermic reduction balances the cooling effect, and hence the solid
temperature remains almost constant within the fuel sector. In all cases, the solid temperature
jumps quickly in the air sector where the highly exothermic oxidation rapidly heats up the solid
phase back to its initial state. As seen in panels b and c, the solid temperature fluctuation for
copper or iron is small within the majority of the reactor and large changes are only observed
near the inlet, as also seen in Figure 11. In contrast, strong variations are observed within the
bottom half of the reactor in the nickel case. Nevertheless, for all three cases, ΔTmax is small, and
Sensitivity analysis is also performed to identify the key parameters and provide information on
the design robustness. The sensitivity ( S ) of an output (ψ) to an input (χ) is defined as:
ln ln S (12)
For the rotary CLC design, the most important outputs are [14]: the fuel conversion (z95%), the
carbon separation efficiency (ηCO2), and the maximum solid temperature fluctuation (ΔTmax).
Input parameters are grouped into three types [14, 34]: the OC kinetics, the design configurations, and the operating conditions. The model is run repeatedly with each input parameter changed by a certain range (e.g., -10%, -5%, +5%, and +10%) from its base value. The sensitivity of z95%, ηCO2 and ΔTmax are shown in Figure 13, Figure 14 and Figure 16
respectively. Parameters that result in very small changes of output are omitted for clarity.
Figure 13 shows the sensitivity of z95%. For all the OCs, z95% is most sensitive to the reduction
kinetics, the inlet temperature and the operating pressure. With lower reduction rates, the
temperature drops significantly which further decreases the reactivity. Thus, a much longer
distance is required for fuel conversion. Similarly, as the operating pressure increases or the inlet
temperature drops, the stronger convective cooling effects lower the solid temperature, leading to
reduced reduction rates. The sensitivities for copper are generally higher than the other two,
while the iron case is most robust with varying designs and operating conditions. The oxidation
kinetics is less important for copper or iron. However, z95% of the nickel case is sensitive to the
oxidation kinetics, because the extent of the OC conversion at the end of the air sector strongly
the same sign of sensitivity, and therefore, the effects of each input on the fuel conversion are
similar for the three designs.
Figure 14 shows the sensitivity of ηCO2. As seen in Figure 14, ηCO2 can be significantly improved
by using a shorter channel, a faster purging rate or simply a longer purging time. For nickel, the sensitivities are all close to zero, due to a sufficient purging applied in the base case. By raising the inlet temperature, an increase of ηCO2 is observed for copper in that z95% shifts significantly
backwards to the inlet, as seen in Figure 13, which leads to a significant solid temperature increase and hence a much higher gas velocity near the inlet. In contrast, the opposite trend is observed for iron, because in this case z95% changes only mildly, and thus the velocity increase
near the inlet is small. Meanwhile, owing to a lower methane feed rate at the raised inlet
temperature, less product molecules are generated from the reduction reaction, and hence the
velocity decreases near the exit where the majority of the fuel is oxidized. This is evident in Figure 15, which compares the time-averaged gas velocity in the fuel purge sector for copper (panel a) and iron (panel b) at different inlet temperatures. For both cases, the velocity near the
exit decreases with the increase of the inlet temperature. For copper, however, a relative large
velocity increase is observed within the bottom half of the reactor, which greatly shortens the gas
residence time, and hence leads to a higher ηCO2.
Figure 16 shows that ΔTmax is most sensitive to the reduction kinetics, pressure and the inlet
temperature. As the reduction rate increases, more OC is consumed in the fuel sector, leading to
higher energy release in the following air sector, and thus a larger temperature variation. In
ΔTmax. Similarly, the sensitivities of ΔTmax are strongest for copper, followed by nickel, while the
iron-based design is the most robust. For most of the input parameters, similar responses of ΔTmax
are recorded for the three cases. One exception is that as the thickness of the solid layer (δbulk)
increases, ΔTmax decreases for nickel and iron because of the higher thermal inertia of the solid
phase. On the other hand, a larger temperature variation is observed for copper. This is because
the conductive heat transfer in the solid phase is also enhanced by a thicker solid layer. The
chemical energy absorbed in the solid phase is more effectively transferred to the inlet, which
raises the surface temperature. Thus, the enhanced reaction rate consumes more OC in the fuel
sector, which leads to a larger temperature fluctuation near the inlet.
5. Discussion
As discussed in the sensitivity analysis, the OC kinetics, the inlet temperatures and the operating pressures are the most important parameters in determining the periodic performances of the rotary CLC reactor. From Eq.(1), different operating pressures or inlet temperatures can significantly affect the reaction rates by changing the fuel concentration or altering pressure inhibition effects. In addition, a raised operating pressure or a reduced inlet temperature enhances the cooling effect and decreases the reactivity. Besides, different operating conditions alter the flow field, change the gas residence time, and greatly affect the carbon separation efficiency. Thus, in order to utilize the rotary reactor in a power generation system, it is necessary to understand how the operating conditions in a power cycle affect the performance of the reactor, and how to adjust the design accordingly.
In general, the scaling strategy follows a similar logic to the selection of the base-case design
parameters, as proposed in Part 1. However, with the results from the base case, the scaling
process can be greatly simplified:
I. The heat duty of the stream is kept to be the same as in the base case to maintain a similar temperature profile inside the reactor and provide the same flue stream temperature.
II. The fuel feed rate is selected to be constant to produce similar fuel concentration and OC conversion profiles along the channel.
III. The height of the reactor is adjusted accordingly to provide an adequate gas residence time for fuel conversion.
IV. The cycle period and the size of each sector are sufficient for OC regeneration and carbon separation.
Panels a and b in Figure 17 compare z99% calculated according to the steady isothermal reactive
flow (Eq.(4)) for varying operating pressures and inlet temperatures, respectively, following the aforementioned procedure: the inlet velocity is adjusted to maintain the heat duty the same as in
the base cases; the inlet fuel molar fraction is selected to provide the same fuel feed rate. Same
design parameters and operating conditions with the base cases are used. An average temperature
along the channel, according to Figure 11, is selected to represent the reaction temperature.
With a higher inlet temperature, the surface temperature increases, leading to a higher reaction
rate and thus a smaller z99%. On the other hand, because of the higher gas velocity and the lower
fuel concentration at higher inlet temperature, the reduction rate is reduced and hence z99%
constant with varying inlet temperatures for the three OCs (Figure 17b). For iron, z99% slightly
increases with a higher inlet temperature. The operating pressure influences the fuel conversion
by changing the fuel concentration or altering the pressure inhibition effects, as discussed in
Section 2. The combined effect depends on the relative importance of these two factors (Figure 17a). For copper and nickel, the reduction reaction order is smaller than the pressure coefficient, and hence the inhibition effect dominates at a higher pressure. On the other hand, z99% decreases
at elevated pressures for iron because of the stronger reactivity increase caused by the raised
concentration. Nevertheless, the change of z99% with varying pressures is small, especially for the
nickel-based design, and thus in an industrial application, a sufficient redundant height can be
used to account for the pressure effect.
Table 4 lists the design parameters and the operating conditions at a low (5atm) and a high
pressure (20atm). The design follows the aforementioned scaling strategies. The performance of
each design is tested using the model presented in Section 3, and the simulated results are listed
in Table 4. According to Figure 17a, a shorter reactor height is used for the low pressure
operation with copper and nickel, while a longer reactor is selected to account for the reduced
reduction rate of iron at 5 atm. The cycle period is adjusted at different pressures to match the
residence time of gas with that of the channel, and account for the changes of the flow field and
the channel height. The sizes of sectors are similar to the base cases with minor revisions for
copper and iron to ensure sufficient purging, adequate OC regeneration, and avoid the complete
OC reduction. For all the designs showed in Table 4, the conversion efficiencies are close to
unity and over 95% of carbon dioxide is captured. Larger temperature fluctuations are observed
reduction period applied at high pressure. As a result, more OC is consumed, as seen in Figure 18, leading to a larger temperature rise in the following air sector. The convective cooling effect is less important as compared to the sensitivity study (Figure 16), because of the similar heating
load of the streams. Thus, similar solid temperature profiles are observed, as plotted in Figure 18,
although a higher pressure slightly lowers the temperature and decreases the surface reactivity.
As a result, the change of z99% with respect to the base case is larger than that predicted by Eq.(4).
Table 5 compares the designs and the operating conditions with different inlet temperatures. The reactor heights are the same as in the base cases, and the flow velocities are adjusted to account
for the change of the temperature ranges from the inlet to the exit. The fuel molar fraction at the
inlet is varied accordingly to maintain a constant feed rate. A same cycle period is used, since the
change of the gas residence time is small. For all the cases, the conversion efficiencies are close
to unity, and over 95% of CO2 is captured. ΔTmax decreases at higher inlet temperatures, as
against to the trends observed in Figure 16. This is because following the above scaling
procedure the fuel concentration at the inlet inversely changes with the inlet temperature.
Therefore, with a higher flow velocity at higher inlet temperatures the fuel concentration spans
more uniformly throughout the reactor and hence the OC conversion along the channel is more
uniform, as seen in Figure 19. As a result, the chemical energy released along the channel is
uniform under high inlet temperatures, and hence, the temperature fluctuation is small.
6. Conclusion
In this work, the idea of a rotary reactor with micro-channels to conduct CLC was extended to
operating conditions follow the design procedures proposed in Part 1. The reaction mechanisms
used were based on the one-step overall kinetics proposed by Abad and co-workers [15-17]
covering a wide range of conditions. The reactivities of different OCs with methane and air were
analyzed and compared, and the effect of the reaction rates on the choice of the design was
discussed. Because of the fast reduction rate, a higher fuel feed rate can be used for nickel and
hence a shorter reactor can adequately consume the fuel. In contrast, the oxidation rate of nickel
is slow, and thus, a large share of air sector is required to sufficiently regenerate the OC inside
the channel. For the copper design, because of the relative lower operating temperature, and the
less metal oxide loading in the OC, a lower fuel feed rate is preferred. The design of copper is
mainly controlled by the fuel conversion in the fuel sector. For the iron-based design, the
reduction rate strongly depends on the fuel concentration, and therefore, a high fuel
concentration at the inlet is selected to effectively improve the conversion rate. Due to the rapid
drop of the reduction rate with the decrease of the fuel concentration, a sufficient redundant
height is used for the iron-based design to provide an adequate gas residence time in the fuel and
the fuel purge sectors to reach the desirable fuel conversion efficiency. Thus, the fuel purge
sector in the iron-based design usually takes a large share to ensure carbon separation.
The one-dimensional reactive plug-flow model developed in the previous studies was adapted to
evaluate the performances of the reactor designs with the three OCs. Based on the operating
conditions selected, the nickel has the smallest dimensions, while the iron-based design is largest.
For all the cases, complete fuel conversion and carbon separation efficiencies are obtained and
reasonable operational stability is maintained. The simulation validated that the nickel-based
reduction rate, especially in the fuel purge sector. In the periodic states, the gas temperature
increases monotonically, and it is mainly determined by the solid temperature. The temperature
fluctuations with time are small for all the cases, and hence the thermal-stress-induced fracture is
limited. Sensitivity tests showed that the OC kinetics, the operating pressure and the inlet
temperature are the most important factors. Copper-based design is most sensitive to the varying
input parameters while iron case is most robust. Scaling strategies were also proposed to up-scale
the design to different pressures and inlet temperatures. The simulations showed that the design
can be easily adapted to different conditions to produce satisfactory periodic performance with
reasonable stability. The parametric study and the numerical simulation under different
conditions validate the design procedures proposed in Part 1.
Acknowledgement
This study is financially supported by a grant from the MASDAR Institute of Science and Technology and the King Abdullah University of Science and Technology (KAUST) Investigator Award.
Reference
[1] J. Adanez, A. Abad, F. Garcia-Labiano, P. Gayan, L.F. de Diego, Progress in
Chemical-Looping Combustion and Reforming technologies, Progress in Energy and Combustion Science,
38 (2012) 215-282.
[2] A. Lyngfelt, B. Leckner, T. Mattisson, A fluidized-bed combustion process with inherent
CO2 separation; application of chemical-looping combustion, Chem. Eng. Sci., 56 (2001)
3101-3113.
[3] C. Linderholm, T. Mattisson, A. Lyngfelt, Long-term integrity testing of spray-dried particles
in a 10-kW chemical-looping combustor using natural gas as fuel, Fuel, 88 (2009) 2083-2096.
[4] J. Adanez, P. Gayan, J. Celaya, L.F. de Diego, F. Garcia-Labiano, A. Abad, Chemical
Looping Combustion in a 10 kWth Prototype Using a CuO/Al2O3 Oxygen Carrier: Effect of
Operating Conditions on Methane Combustion, Ind. Eng. Chem. Res., 45 (2006) 6075-6080.
[5] T. Proell, P. Kolbitsch, J. Bolhar-Nordenkampf, H. Hofbauer, A novel dual circulating
fluidized bed system for chemical looping processes, AIChE J., 55 (2009) 3255-3266.
[6] N. Berguerand, A. Lyngfelt, Operation in a 10 kWth chemical-looping combustor for solid
fuel-testing with a Mexican petroleum coke, Energy Procedia, 1 (2009) 407-414.
[7] L. Shen, J. Wu, Z. Gao, J. Xiao, Characterization of chemical looping combustion of coal in a
1 kWth reactor with a nickel-based oxygen carrier, Combust. Flame, 157 (2010) 934-942.
[8] D. Pavone, CO2 capture by means of chemical looping combustion., in: Proceedings of the
COMSOL Multiphysics User's Conference., Paris, France, 2005.
[9] D. Pavone, M. Rolland, E. Lebas, CO2 capture using chemical looping combustion for gas
turbine application., in: Proceedings of 8th International Conference of Greenhouse Gas Control
[10] J.E. Cichanowicz, L.J. Muzio, Rotary regenerative chemical looping combustion. Patent US
2009/0265978, in, USA . 2009, pp. 9pp.
[11] Z. Zhao, T. Chen, A.F. Ghoniem, Rotary Bed Reactor for Chemical-Looping Combustion
with Carbon Capture. Part 1: Reactor Design and Model Development, Energy & Fuels, 27
(2013) 327-343.
[12] Z. Zhao, Rotary bed reactor for chemical-looping combustion with carbon capture, in:
Dept. of Mechanical Engineering, Massachusetts Institute of Technology, Cambridge, 2012.
[13] Z. Zhao, C.O. Iloeje, T. Chen, A.F. Ghoniem, Design of a Rotary Reactor for
Chemical-looping Combustion. Part 1: Fundamentals and Design Methodology, Submitted to Fuel for
publication, (2013).
[14] Z. Zhao, T. Chen, A.F. Ghoniem, Rotary Bed Reactor for Chemical-Looping Combustion
with Carbon Capture. Part 2: Base Case and Sensitivity Analysis, Energy & Fuels, 27 (2013)
344-359.
[15] A. Abad, J. Adanez, F. Garcia-Labiano, D.L.F. de, P. Gayan, J. Celaya, Mapping of the
range of operational conditions for Cu-, Fe-, and Ni-based oxygen carriers in chemical-looping
combustion, Chem. Eng. Sci., 62 (2007) 533-549.
[16] F. Garcia-Labiano, J. Adanez, L.F. de Diego, P. Gayan, A. Abad, Effect of Pressure on the
Behavior of Copper-, Iron-, and Nickel-Based Oxygen Carriers for Chemical-Looping
Combustion, Energy Fuels, 20 (2006) 26-33.
[17] F. Garcia-Labiano, L.F. de Diego, J. Adanez, A. Abad, P. Gayan, Reduction and Oxidation
Kinetics of a Copper-Based Oxygen Carrier Prepared by Impregnation for Chemical-Looping
[18] R. Naqvi, Analysis of Natural Gas-Fired Power Cycles with Chemical Looping Combustion
for CO2 Capture., in, Norwegian University of Science and Technology, 2006.
[19] G. Energy, Heavy duty gas turbine products, GEA-12985H (06/09), General Electric,
(2009).
[20] J. Adanez, L.F. de Diego, F. Garcia-Labiano, P. Gayan, A. Abad, J.M. Palacios, Selection of
Oxygen Carriers for Chemical-Looping Combustion, Energy Fuels, 18 (2004) 371-377.
[21] T. Mattisson, M. Johansson, A. Lyngfelt, The use of NiO as an oxygen carrier in
chemical-looping combustion, Fuel, 85 (2006) 736-747.
[22] M. Johansson, T. Mattisson, A. Lyngfelt, A. Abad, Using continuous and pulse experiments
to compare two promising nickel-based oxygen carriers for use in chemical-looping
technologies, Fuel, 87 (2008) 988-1001.
[23] P. Cho, T. Mattisson, A. Lyngfelt, Comparison of iron-, nickel-, copper- and
manganese-based oxygen carriers for chemical-looping combustion, Fuel, 83 (2004) 1215-1225.
[24] L.F. de Diego, F. Garcia-Labiano, J. Adanez, P. Gayan, A. Abad, B.M. Corbella, J.M.
Palacios, Development of Cu-based oxygen carriers for chemical-looping combustion, Fuel, 83
(2004) 1749-1757.
[25] M. Johansson, T. Mattisson, A. Lyngfelt, Investigation of Fe2O3 with MgAl2O4 for
Chemical-Looping Combustion, Ind. Eng. Chem. Res., 43 (2004) 6978-6987.
[26] M. Ryden, E. Cleverstam, M. Johansson, A. Lyngfelt, T. Mattisson, Fe2O3 on Ce-, Ca-, or
Mg-stabilized ZrO2 as oxygen carrier for chemical-looping combustion using NiO as additive,
[27] F. Garcia-Labiano, L.F. de Diego, J. Adanez, A. Abad, P. Gayan, Temperature variations in
the oxygen carrier particles during their reduction and oxidation in a chemical-looping
combustion system, Chem. Eng. Sci., 60 (2005) 851-862.
[28] R. Siriwardane, J. Poston, K. Chaudhari, A. Zinn, T. Simonyi, C. Robinson,
Chemical-Looping Combustion of Simulated Synthesis Gas Using Nickel Oxide Oxygen Carrier Supported
on Bentonite, Energy Fuels, 21 (2007) 1582-1591.
[29] H. Jin, T. Okamoto, M. Ishida, Development of a Novel Chemical-Looping Combustion:
Synthesis of a Solid Looping Material of NiO/NiAl2O4, Ind. Eng. Chem. Res., 38 (1999)
126-132.
[30] G. Wu, W.A. Sirignano, F.A. Williams, Simulation of transient convective burning of an
n-octane droplet using a four-step reduced mechanism, Combustion and Flame, 158 (2011)
1171-1180.
[31] E. Jerndal, T. Mattisson, A. Lyngfelt, Thermal analysis of chemical-looping combustion,
Chem. Eng. Res. Des., 84 (2006) 795-806.
[32] NIST Standard Reference Database Number 69, webbook.nist.gov/chemistry, accessed
12/2011.
[33] Z. Zhao, T. Chen, A.F. Ghoniem, Rotary Bed Reactor for Chemical-Looping Combustion
with Carbon Capture. Part 2: Base Case and Sensitivity Analysis, Energy & Fuels, 27 (2012)
344-359.
[34] Z. Zhao, C.O. Iloeje, T. Chen, Design of a Rotary Bed Reactor for Chemical-looping
Figure 1. Schematic diagram of rotary CLC system design [11]: (a) front view, (b) bottom view of channels, and (c) the oxygen carrier coated on the channel walls.
Figure 2 OC conversion versus time for reduction (dashed lines) and oxidation (solid lines). The operating conditions are similar to those in the designs.
Figure 3 Gas consumption rate as a function of gas concentration for reduction (dashed lines) and oxidation (solid lines). The operating conditions are similar to those in the designs.
Figure 4 Comparison of fuel molar fraction profiles of different OCs along the channel for the steady-state isothermal reduction. Lines are from analytical solutions and symbols are
Figure 5 The channel height to reach 99.0% fuel conversion, z99%, as a function of the inlet fuel
Figure 6 z99% versus inlet gas velocity ub,0 for the three OCs at different fuel feed rate. For each
curve, the inlet fuel concentration is varied accordingly to keep the fuel flow rate constant. The operating condition is 1223K and 10 atm, and the inlet velocities are evaluated at 823K.
Figure 7 OC conversion versus time within one cycle for (a) nickel-, (b) copper-, and (c) iron-based designs. Panel d shows the minimum OC conversion within one cycle for the three OCs. The maximum OC conversion for nickel is also included. The shaded area in panel d represents
Figure 8 Molar fraction of the fuel and oxygen in one cycle for (a) nickel-, (b) copper-, and (c) iron-based designs.
Figure 9 Bulk flow velocity versus time within one cycle for (a) nickel-, (b) copper-, and (c) iron-based designs.
Figure 10 Normalized CH4 concentration in the fuel and purge sectors (solid lines) and the
periodic fuel conversion efficiency (dashed line) as a function of the axial position for (a) nickel-, (b) copper-nickel-, and (c) iron-based designs.
Figure 11 Time-averaged temperature profiles versus the axial position for the solid (lines) and the flow (circles) for (a) nickel-, (b) copper-, and (c) iron-based designs. The dashed lines are the
maximum temperature variation of the solid phase in one cycle. In panel b, the melting temperature for copper is also included.
Figure 12 Solid temperature deviation versus time within one cycle for (a) nickel-, (b) copper-, and (c) iron-based designs.
Figure 13 Sensitivity of z95% on the reaction kinetics, design parameters and the operating
Figure 14 Sensitivity of 𝜂CO2 on the reaction kinetics, design parameters and the operating
Figure 15 Time-averaged bulk flow velocity within the fuel purge sector for (a) copper and (b) iron at different inlet temperatures.
Figure 16 Sensitivity of ΔTmax on the reaction kinetics, design parameters and the operating
![Figure 1. Schematic diagram of rotary CLC system design [11]: (a) front view, (b) bottom view of channels, and (c) the oxygen carrier coated on the channel walls](https://thumb-eu.123doks.com/thumbv2/123doknet/14685300.560107/38.918.116.806.143.671/figure-schematic-diagram-rotary-design-channels-carrier-channel.webp)