Design of a Chemical Sampling and Analysis
System Using Excimer Laser Ablation and Quartz
Microcolumns
by
Luis G. Ortiz
S.B., Mechanical Engineering (1995)
Massachusetts Institute of Technology
Submitted to the Department of Mechanical Engineering
in partial fulfillment of the requirements for the degree of
Master of Science in Mechanical Engineering
at the
MASSACHUSETTS INSTITUTE OF TECHNOLOGY
June 1997
@
Massachusetts Institute of Technology 1997. All rights reserved.
Author ...
Department of Mechanical Engineering
May 9, 1997
Certified by...
7
r
Kamal Youcef-Toumi
Associate Professor of Mechanical Engineering
Thesis Supervisor
Certified by.... . . ...
...
Ian W. Hunter
Professor of Mechanical Engineering
Thesis Supervisor
A ccepted by ...
Ain Sonin
Chairman, Departmental Committee on Graduate Students
Design of a Chemical Sampling and Analysis System Using
Excimer Laser Ablation and Quartz Microcolumns
by
Luis G. Ortiz
S.B., Mechanical Engineering (1995)
Massachusetts Institute of Technology
Submitted to the Department of Mechanical Engineering on May 9, 1997, in partial fulfillment of the
requirements for the degree of
Master of Science in Mechanical Engineering
Abstract
The advent of miniaturization technology has greatly increased the potential for smaller, better performance, and versatile chemical sampling and analysis devices. To this end, a device which can sample and analyze high molecular weight compounds is being developed. In order to make the device as non-invasive as possible, the possi-bility of using miniaturization technology is being investigated. This will allow for a self-contained system with minimum interaction with the environment. The goal of this thesis was to develop some of the essential tools to realize such a device. First, the ability to sample and analyze high molecular weight compounds using excimer laser ablation and gas chromatography was investigated. Second, a quartz micro-column manufacturing technique which uses a linear Lorentz-force actuator and a carbon dioxide laser to draw quartz micro-columns was developed. Results showed that excimer laser pulse frequency, sample volume and ablation time affected the analytical results in terms of the number of ablation products and their concentra-tion. These results are promising in terms of developing an excimer laser sampling and analysis tool for chemical compounds. The quartz micro-column manufacturing technique developed succeeded in making a few quartz micro-columns which could also find many potential uses. This work lays the foundation which should contribute towards the endgoal of developing a microanalyzer as well as other applications.
Thesis Supervisor: Kamal Youcef-Toumi
Title: Associate Professor of Mechanical Engineering Thesis Supervisor: lan W. Hunter
Acknowledgments
First of all, I would like to thank Professors Kamal Youcef-Toumi and Ian W. Hunter for giving me the opportunity to work with them in this project. I am truly indebted to them. They provided me with the guidance and encouragement through-out the duration of my graduate studies at MIT and they are truly very admirable, kind people. Furthermore, I would like to thank the many sponsors of the Total Home Automation and Eldercare Systems Consortium who helped fund my education and project.
I also want to give my thanks to all of my labmates whose friendship and helpfulness allowed me to finish my work and to stay sane. In particular, I'd like to thank John Madden for all of his time and help throughout the duration of this project; Peter Madden for showing me how to use the CNC machining center, giving me sugges-tions on how to design the gas-collection cell, and for the many times he answered my questions; Justin Won for lending me his laptop with which I wrote all of this thesis, and for helping me time and time again with computer problems including setting up software to listen to U2; James for his friendship, continuous encouragement, and help; Joe for his many stories and help; Benjie for his comic relief and encourage-ment; Colin Brennan for his help and suggestions; Serge for his resourcefulness; Tania for helping me find chemicals for calibration; Susan for her help with administrative matters; and to everyone else in the lab who made it worthwhile: Michel, Debo, Ari, Paul, Mark, and Sylvan.
I want to thank my family and friends who have always supported me throughout these years. In particular, I want to thank my mother and father (Irma and Noris), my three brothers (Gustavo, Victor, and Fito), my two sisters-in-law (Brenda and Angelica) and my two beautiful nieces (Angelica and Liliana). Last but not least, I want to thank my fiancee and future wife Anna for all of her love, inspiration and encouragement. Anna, te amo con todo mi corazon y gracias por todo. Finally, I want to thank God for his help throughout my years at MIT, his guidance and for
Contents
1 Introduction
1.1 Overview of Chemical Analysis Technology . . . 1.1.1 Thermal Sensors . ... ... 1.1.2 Mass Sensors ...
1.1.3 Electrochemical Sensors . . . ... 1.1.4 Optical Sensors . ... ... 1.2 Gas-Liquid Chromatography . . . .... 1.3 Applications for Chemical Analyzers . . . .
1.3.1 H om e . . . .. . . . 1.3.2 Healthcare . ...
1.3.3 Environmental ...
1.3.4 Automotive and Defense . . . ... 1.3.5 Other Applications for Chemical Sensors 1.4 Motivation for Micro-analyzer Development . .
1.4.1 Lower-End Sensor Technology Problems 1.4.2 Thesis Overview ...
2 Gas Chromatography
2.1 Introduction . . . ...
2.1.1 Classification of Chromatography . . . .
2.1.2 Chromatograms ... 2.2 Migration Rates of Solutes . ...
2.2.1 Partition Ratios . ... ... . . . . . . . . . 15 .. . . . . 16 .. . . . . 17 . . . . . 18 . . . . . 20 .. . . . . 27 .. . . . . . 28 . . . . . .. . 28 . . . . . . . 28 .. . . . 28 .. . . . 29 . . . . . 29 . . . . . . . . . 30 . . . . . 3 1 .. . . . 32 33 35 35 36 37
2.2.2 2.2.3 2.2.4 2.2.5 2.3 Band 2.3.1 2.3.2 2.3.3 Retention Times .. ... ... The Retention Time and Partition Ratio Relationship . The Rate of Migration of Solutes: The Capacity Factor Differential Migration Rates: Selectivity Factor . . . . Shapes and Band Broadening . ... ...
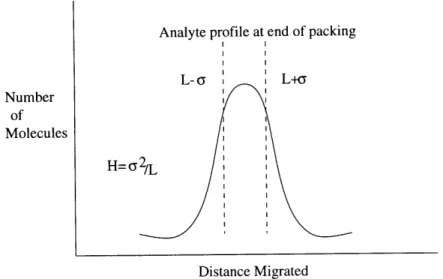
The Shapes of Chromatographic Peaks . . . . Efficiency of Chromatographic Columns . . . . The Plate Height and Band Broadening Relationship .
. . . . 37 . . . . 38 . . . . 39 . . . . 40 . . . . 40 . . . . 41 . . . . 41 . . . . 41
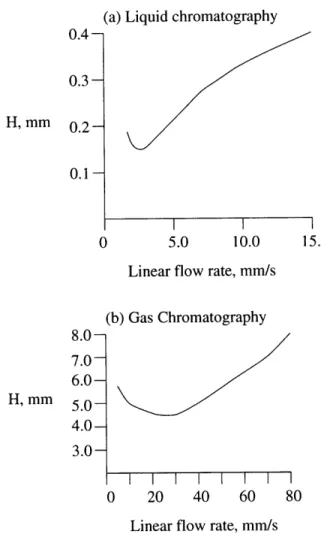
2.3.4 Experimental Evaluation of N and H . 2.4 Variables That Affect Column Efficiency . . . 2.4.1 The Effect of Mobile-Phase Flow Rate 2.4.2 A Theory of Band Broadening . . . . . 2.5 Column Resolution ... 2.5.1 The Relationship Between Resolution Column and Solute . . . .... 2.5.2 The Relationship Between Resolution a 2.5.3 Optimization Techniques . . . . 2.6 The General Elution Problem . . . ... 2.7 Components of a Chromatography System . . 2.8 Applications of Chromatography . . . . 2.8.1 Qualitative . ... 2.8.2 Quantitative ... 2.9 Micro-Chromatographs . ... . . . . . . . . . 43 . . . . . . . . . 44 . . . . . . . . 45 .. . . . . . 49 and Properties nd Eli 3 Excimer Laser Ablation 3.1 Introduction . .... ... 3.2 Excimer Lasers . . ... 3.3 Excimer Laser Materials Processing . . . .. 3.3.1 Physical Mechanisms of Ablation . . . . . 3.3.2 Excimer Laser Ablation Product Analysis of the .. . . . 50
ition
Time . . . 50 . . . . . . . 50 .. . . . . 51 . . . . . . . 52 .. . . . 53 .. . . . . 53 .. . . . 53 .. . . . 54 56 .. . . . . . 56 .. . . . 56 .. . . . 57 .. . . . . . 58 . . . . . 593.4 Application Areas ...
4 Manufacturing of Quartz Micro-Columns
4.1 Introduction . ... ... 4.2 Lorentz Linear Actuator . ... 4.3 Amplifier Circuit. ...
4.4 C0 2 Laser Setup and Optics . . . .
4.5 Quartz As a Column Material . . . . 4.6 Manufacturing of Quartz Micro-columns .
5 Excimer Laser Ablation Product Sampling 5.1 Introduction ... ...
5.2 Excimer Laser and Optics . . . ... 5.3 Gas Collection Cell ...
5.4 Gas Chromatograph ...
5.5 Excimer Laser Ablation Experiments . . . 5.5.1 Influence of Pulse Rate . . . . 5.5.2 Influence of Injection Volume . . . 5.5.3 Influence of Ablation Time . . . . . 5.5.4 Variation According to Material . . 5.5.5 Calibration of Gas Chromatograph
64 .. . . . . . 64 .. . . . . . 65 .. . . . . . 66 .. . . . 68 .. . . . 68 . . . . . . . . . . 70 and Analysis . . . . . . . 71 .. . . . . . 71 72 .. . . . 73 .. . . . . . . . 73 .. . . . 74 .. . . . . . . . 74 .. . . . . . . . 75 . . . . . . . . . . . 75 . . . . . . . . . 75 6 Results 6.1 Quartz Micro-Column Manufacturing . . . .... 6.2 Excimer Laser Ablation Products Sampling and Analysis 6.2.1 General Results . . ... 6.2.2 Influence of Repetition Rate on Concentration . 6.2.3 Influence of Injection Volume on Concentration 6.2.4 Influence of Ablation Time on Concentration . . . 6.2.5 Variation According to Material . . . ... 6.2.6 Identification of Ablation Products . . . .. 76 . . . . . . 76 . . . . . . 78 .. . . . 78 . . . . . . 83 . . . . . . 83 . . . . . . 84 .. . . . 84 . . . . . . 85
7 Conclusion and Recommendations 92
7.1 Recommendations ... 93
7.1.1 Micro-column Manufacturing . ... 93
7.1.2 Excimer Laser Ablation Experiments . ... 94
7.2 Possible Applications ... ... . 94
7.3 Conclusion ... ... .. 95
A Gas-Collection Cell Drawing 96
B Amplifier Circuit Diagram 99
C Gas Chromatography Setpoints 100 D Integration Results 103
List of Figures
1-1 Block diagram for gas/liquid microanalyzer. . ... . 15 1-2 General schematic of a thermal catalytic sensor. . ... 16 1-3 Schematic of a SAW sensor with transmitter T, receiver R, and the
chemically selective layer deposited on the delay line. . ... 18 1-4 Operation of the tin-oxide sensor. ... ... ... . 19 1-5 General arrangement of a spectroscopic absorption/emission
experi-ment. Cuvette of a defined path length L contains solution of concen-tration C. The single wavelength radiation (AA) irradiates the sample and the attenuated radiation or secondary radiation (AF) are used to evaluate the extent of the interaction. The signal from the detector D is amplified (>) and recorded (R)... ... . . . . .. ... 20 1-6 Types of mass spectrometer analyzers: a) magnetic (mi and zi
repre-sent mass and charge, respectively), b) time-of-flight, c) quadrupole. . 23 1-7 Block diagram of equipment for observation of Raman spectra... . 24 1-8 Three most common types of arrangement of an optical sensor, where
R is the reagent or selective layer, and S and D are the source and detector, respectively. ... ... ... . 26 1-9 Gas-liquid chromatography via column separation: a) Mixture poured
on top of column, b) partial separation, c) complete separation. . . . 27
1-10 Spectrum of technologies in gas/liquid sensing. . ... 30 2-1 Elution chromatography. ... ... .. . 34 2-2 Typical chromatogram showing the output peaks for each subspecies. 36
2-3 Definition of retention time for output peak of length W. ... . 38 2-4 Definition of efficiency from Gaussian output peaks... 42 2-5 The effect of mobile phase flow rate on column efficiency. ... . 44 2-6 Contribution of longitudinal diffusion and mass transfer terms to total
efficiency. ... ... ... . 48 2-7 Contrast between different resolutions for the same compounds A and
B. ... ... ... 49
2-8 The general elution problem. ... ... .... 51 2-9 Typical components for a gas chromatography system: 1) Carrier gas
supply; 2) Injection port; 3) Column; 4) Detector; 5) Gas supply for FID, (a) air, (b) hydrogen, (c) make-up gas. . ... 52 2-10 Two of the first micro-chromatographs: From Terry, et al., 1979 [20]
(left), and Manz, et al., 1987 [22](right). ... ... 54 3-1 Images showing the difference between Nd : YAG (left), CO2 (middle)
and excimer laser (right) material processing results. Note the high degree of precision in the excimer case, and the absence of damage to
the surrounding material (From Poulin et al, 1988 [35]) ... 57
3-2 Image showing of 5 ,tm diameter holes machined in a human hair using an excimer laser (From Poulin et al, 1988 [35]). . ... . 59 3-3 SEM photograph of an array of 70 pm square holes etched in 25 pm
thick polyimide film. The webbing between the holes is 35 tum wide. The time taken to drill approximately one thousand such holes was one second (From Poulin et al, 1988 [35]). ... ... ... ... . 60 3-4 Image showing an example of the removal of a polymer film from a
metallic substrate (From Poulin et al, 1988 [35]) ... 61 3-5 Image showing an example of the removal of a thin metal film from a
polymer substrate (From Poulin et al, 1988 [35]). . ... . 62 3-6 Image showing the difference between CO2 (left) and excimer laser
3-7 Pharmaceutical application. ... ... .. 63
4-1 Micro-column manufacturing setup. ... ... ... 65
4-2 Photograph showing micro-column manufacturing setup. . ... 66
5-1 Excimer laser ablation sampling and analysis setup. . ... 72
6-1 Photograph showing two quartz micro-columns. . ... . . . . . 77
6-2 Influence of excimer laser pulse frequency on component concentration for SaranWrap. Concentration of the three major components (A, B, C) of the ablation gases shown. Ablation time was 40 s and injection volume 0.3 ml. ... ... . 80
6-3 Influence of injection volume on component concentration for Saran-Wrap. Ablation frequency of 100 Hz and ablation time of 40 s. . . . 80
6-4 Influence of ablation time on component concentration for SaranWrap. Ablation frequency of 100 Hz and injection volume of 0.3 ml. ... 81
6-5 Influence of excimer laser pulse frequency on component concentration for polyethylene. Four major components (A, B, C, D) of ablation gases shown. Ablation time was 40 s and injection volume 0.3 ml. .. 81
6-6 Influence of injection volume on component concentration for polyethy-lene. Ablation frequency of 100 Hz and ablation time of 40 s. ... 82
6-7 Influence of ablation time on component concentration for polyethy-lene. Ablation frequency of 100 Hz and injection volume of 0.3 ml. . 82 6-8 Results for pulse frequency variation experiments for SaranWrap. Clock-wise starting from the top left corner: 10 Hz, 50 Hz, 75 Hz, and 100 Hz... ... . ... 86
6-9 Results for injection volume variation experiments for SaranWrap. Clock-wise starting from the top left corner: 0.1 ml, 0.2 ml, 0.4 ml, and 0.6 ml ... ... ... 87
6-10 Results for ablation time variation experiments for SaranWrap. Clock-wise starting from the top left corner: 60 seconds, 90 seconds, and 120
seconds ... ... ... 88
6-11 Results for pulse frequency variation experiments for polyethylene. Clockwise starting from the top left corner: 10 Hz, 50 Hz, 75 Hz, and 100 H z ... .. . ... . 89
6-12 Results for injection volume variation experiments for polyethylene. Clockwise starting from the top left corner: 0.1 ml, 0.2 ml, 0.4 ml, and 0.6 ml. ... . .... ... ... . 90
6-13 Results for ablation time variation experiments for polyethylene. Clock-wise starting from the top left corner: 60 seconds, 90 seconds, and 120 seconds. . ... . .. ... 91
A-1 Cell Drawing (Front Section) ... ... ... .... 96
A-2 Cell Drawing (Back Section). ... ... ... . 97
A-3 Cell Drawing (Plexiglas Section). . ... . . 97
A-4 Assembly Drawing. ... ... . 98
List of Tables
2.1 2.2
Classification of chromatography . ....
Variables that affect column efficiency . . . . . . . . . ..
4.1 Properties of clear fused quartz (Adapted from Bolz et al, 1973 [44])
D.1 File FID00095.D-Frequency rate of 10 Hz for SaranWrap. .. D.2 File FID00096.D-Frequency rate of 50 Hz for SaranWrap. .. D.3 File FID00097.D-Frequency rate of 75 Hz for SaranWrap. .. D.4 File FID00098.D-Frequency rate of 100 Hz for SaranWrap... D.5 File FID00099.D-Injection volume of 0.1 ml for SaranWrap.
D.6 File FID00100.D-Injection volume of 0.2 ml for SaranWrap. D.7 File FID00101.D-Injection volume of 0.4 ml for SaranWrap. D.8 File FID00102.D-Injection volume of 0.6 ml for SaranWrap. D.9 File FID00103.D-Ablation time of 60 s for SaranWrap. .... D.10 File FID00104.D-Ablation time of 90 s for SaranWrap. .... D.11 File FID00105.D-Ablation time of 120 s for SaranWrap... D.12 File FID00106.D-Frequency rate of 10 Hz for polyethylene... D.13 File FID00107.D-Frequency rate of 50 Hz for polyethylene... D.14 File FID00108.D-Frequency rate of 75 Hz for polyethylene... D.15 File FID00109.D-Frequency rate of 100 Hz for polyethylene. D.16 File FID00110.D-Injection volume of 0.1 ml for polyethylene.. D.17 File FID00111.D-Injection volume of 0.2 ml for polyethylene.. D.18 File FID00112.D-Injection volume of 0.4 ml for polyethylene. D.19 File FID00113.D-Injection volume of 0.6 ml for polyethylene..
35 43 69 . . . . 103 . . . . 103 . . . . 103 . . . . 104 . . . . 104 . . . . 104 . . . . 104 . . . . 104 . . . . 105 . . . . 105 . . . . 105 . . . . 105 . . . . 106 . . . . 106 . . . . 106 . . . . 106 . . . . 106 . . . . 107 . . . . 107
D.20 File FID00114.D-Ablation time of 60 s for polyethylene. . ... 107 D.21 File FID00115.D-Ablation time of 90 s for polyethylene. . ... 107 D.22 File FID00116.D-Ablation time of 120 s for polyethylene. ... . 107
Chapter 1
Introduction
The sampling and analysis of chemicals has been an area of wide research and devel-opment for many decades now. The advent of miniaturization technology has greatly increased the potential for smaller, better performance, and versatile chemical sam-pling and analysis devices. One of the projects which is developing such technology is the Total Home Automation and Eldercare Systems Consortium which has the objective to take a lead in the development of fundamental technologies for home automation and home-based eldercare systems. As part of the research consortium, one of the projects is to design and construct a device which can analyze chemical gases and liquids (see Figure 1-1). The idea is to be able to introduce a fluid via a pump into the device, to detect and analyze the fluid by anyone of several methods (e.g., chromatography, spectroscopy), which might include the addition of agents to the fluid as sample pretreatment, and then to act accordingly after dispensing the fluid. The information gathered is to be communicated to a central computer via wireless communication for monitoring and diagnostic purposes. This device could be used as a multi-purpose sensor for the home. For instance, it may be used for carbon monoxide monitoring, stale or decayed food detection, smoke detection, and medical diagnosis. In order to make the device as non-invasive as possible, the possi-bility of using miniaturization technology is being investigated. Miniaturization will allow for a self-contained system with minimum interaction with the environment. In addition, miniaturization will make it more attractive to the consumer and minimize
Figure 1-1: Block diagram for gas/liquid microanalyzer.
interference with any other tasks which may be necessary.
The project presents several challenges. These include the development of sensors and actuators for sampling and analyzing gases and liquids. Furthermore, there must be adequate communication between the sensors, actuators and information process-ing equipment to allow for proper operation of the device. The use of miniaturization technologies amplifies these challenges since the miniaturization process changes the overall physics of the system. The following paragraphs describe the motivation be-hind the microanalyzer project in more detail, and a summary of each of the different techniques of chemical gas and liquid detection being considered is given.
1.1
Overview of Chemical Analysis Technology
There exists a wide variety of chemical gas and liquid sensing and analysis tech-nologies. These range from the cheaper, smaller, commercially-available smoke de-tectors for the home to the more sophisticated methods used in analytical chemistry such as spectroscopy and chromatography. Other general types of sensors include thermal, mass, electrochemical, and optical sensors. The following sections give a
Thermometer
IK
Catalytic Layer
Figure 1-2: General schematic of a thermal catalytic sensor.
1.1.1
Thermal Sensors
Thermal sensors are based on the heat generated by a specific reaction as the source of analytical information [1]. The general strategy is to place a chemically selective layer on top of a thermal probe and to measure the heat evolved in the specific chemical reaction taking place in that layer, either as the change in temperature of the sensing element or as the heat flux through the sensing element (see Figure 1-2). The heat is evolved continuously, so thermal sensors are in a non-equilibrium state and their signal is obtained from a steady-state situation. An example of a thermal sensor is the enzyme thermistor, in which an enzyme-containing layer is deposited over a thermal probe and the substrate is allowed to diffuse into this from the sample solution which then reacts and the heat equal to the enthalpy of that reaction is evolved. Another example is that of the pyroelectric sensor. This sensor usually consists of a pyroelectric crystal which experiences a change in surface charge when it is heated [1]. A chemically selective material is usually applied to an electrode to generate heat when it reacts with another chemical. This heat of reaction causes the pyroelectric material to undergo a change in surface charge which can be measured. The major drawback of thermal sensors is the inherent tradeoff in their design. In order for the sensor to interact with the chemical analytes, it must exchange matter which means that it must be a thermodynamically open system. On the other hand, in order to obtain a maximum response it should be as adiabatic, or thermally insulated, as possible. In other words, ideal conditions for proper operation are difficult to attain
Thenno
t---~
which limits the sensors' performance.
1.1.2
Mass Sensors
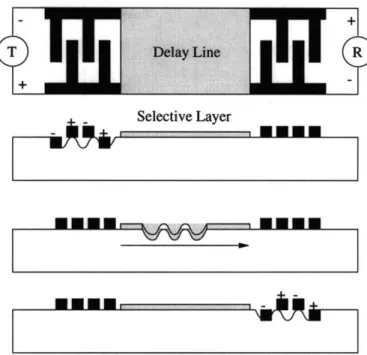
Mass sensors use the change of mass which occurs during the interaction of chem-ical species and the sensing element as their principle of operation [1]. Piezoelectric materials have found wide use in mass sensor development due to their small size, high sensitivity, and stability. Another example of a mass sensor is the surface acoustic wave sensor (SAW). These devices are based on the propagation of surface acous-tic waves along solid surfaces in contact with a medium of low density. Thus when addition of mass during sensing using one of these devices takes place, a change in the magnitude of the amplitude of wave propagation, frequency shift, or phase shift can be measured and expressed as a function of concentration. A surface acoustic wave sensor usually consists of a transmission or delay line in which an acoustic wave is piezoelectrically generated in one oscillator, propagated along the surface of the substrate, and then transformed back to an electrical signal in the receiving oscilla-tor (Figure 1-3). Analytical information is then obtained from the interaction of the sample with the propagating wave in the region of the transmission line. Selective chemical layers may also be used to enhance selectivity in these devices.
The major advantages of mass sensors are their simplicity of construction and operation, their light weight, and the low power consumption [1]. Compared to elec-trochemical sensors the measurement is carried out in a monopolar mode, i.e., only a single physical probe is necessary. Mass sensors have a high sensitivity and can be used for a very broad range of compounds. A major drawback is a high vulnerability to interferences. Also, the sensor will operate properly only if the interaction between species and the sensor results in a net change of mass of the chemically selective layer attached to the crystal being used. Mass sensors are also limited when used in liquid phases. In this case the output signal of the sensor is not only affected by the in-cremental mass due to the reaction, but also by frictional effects at the sensor-liquid interface that affect the energy loss [1].
Selective Layer
Figure 1-3: Schematic of a SAW sensor with transmitter T, receiver R, and the chemically selective layer deposited on the delay line.
1.1.3
Electrochemical Sensors
Electrochemical sensors are the largest and oldest group of chemical sensors [1]. Many members of this group have reached commercial maturity while many are still in various stages of development. Electrochemical sensors are divided by their mode of measurement into potentiometric (measurement of voltage), amperometric (measure-ment of current), and conductimetric (measure(measure-ment of conductivity) sensors. They include enzyme electrodes, high-temperature oxide sensors, fuel cells, and surface con-ductivity sensors. The name electrochemical is due to the fact that there is a transfer of charge from an electrode to another phase, which may be a solid or liquid sample. In this process chemical changes occur at the electrodes and the charge is conducted through the bulk of the sample phase. Both the electrode reactions and/or the charge transport can be modulated chemically and serve as the basis of the sensing process
Heater Thick-Film Cerami Air/gas mixture - /_1 n-dioxide ctrode Lead wires Thin-film tin-dioxide Thin-Film
VHeater
Gold electrodeFigure 1-4: Operation of the tin-oxide sensor.
The Tin-Oxide Sensor
The most commonly used commercially-available electrochemical sensor is the tin-oxide sensor which has a high sensitivity to a wide range of gases. Some of the companies involved in this area include Figaro, Nimoto, Matsushita Panasonic, and Texas Instruments [2]. There are two types of tin-oxide sensors available in the market: thin and thick-film. The main advantage of the thin-film version is its smaller size (Figaro design is 3 to 1) and a lower power consumption. They both operate in the same manner: Gas molecules react with chemisorbed oxygen species on the sensor which results in a change in the conductivity (see Figure 1-4). These sensors operate at an elevated temperature (100-6000C) which is provided by a heater. The heater provides two functions: it speeds up the reaction rate and it helps avoid water absorption onto the surface of the sensor. Tin-oxide sensors are quite sensitive to combustible materials (0.1-100 ppm) such as alcohols, but are generally poor at detecting sulfur- or nitrogen-based gases [2]. Catalytic metals may be incorporated within the sintered tin-oxide to control the selectivity of the sensor.
L
SA
Source
Monochromator
Figure 1-5: General arrangement of a spectroscopic absorption/emission experiment. Cuvette of a defined path length L contains solution of concentration C. The single wavelength radiation (AA) irradiates the sample and the attenuated radiation or sec-ondary radiation (AF) are used to evaluate the extent of the interaction. The signal from the detector D is amplified (>) and recorded (R).
1.1.4
Optical Sensors
The interaction of electromagnetic radiation with matter takes place over a wide range of frequencies and usually in a highly specific manner. The study and use of these interactions comprise the domain of spectroscopy which provides information ranging from the electronic structure of atoms to the dynamics of polymeric chains [1]. In the most general conventional arrangement, the sample is irradiated with monochromatic radiation and the extent of the interaction is evaluated from the at-tenuation of the original radiation or by observing the secondary radiation emitted from the sample (Figure 1-5). The absorption of the primary radiation can also be coupled to other, non-optical effects, such as the increase in temperature or pressure, or the change in electrical conductivity.
Optical sensors and classical spectroscopic measurements use the same equipment, but the difference comes in the arrangement of the experiment itself [1]. In spectro-scopic measurements the sample is generally placed in a well-defined path of the beam and the emerging radiation is captured by the detector. In the case of optical sensors, the beam is captured by the spectrophotometer, allowed to interact with the sample, and then reintroduced into the spectrophotometer in either its primary or secondary form for further processing. The need to guide and change the light over some
dis-tance limits the frequency range within which optical sensors can be used. The large spectroscopic knowledge base forms the basis for the development of optical sensors.
The following sections describe some of the spectroscopic methods that have found
wide use in chemical analysis as well as some examples of optical sensors.
Mass Spectroscopy
Mass spectroscopy refers to the destructive analytical method which can reveal specific characteristics about a compound's structure [3]. The technique is used mostly in a qualitative manner. The most important searched-for ion in the mass spectrum is the molecular ion because it directly indicates the molecular weight of the compound. During ionization, a considerable amount of excess energy can be transferred to the molecular ion, which, depending on its stability, may decompose into many fragment ions. These ions define subsets of atoms which may be related to functional groups or structural components of the original molecule. The set of fragment ions, which are represented by peaks in a mass spectrum, is often called a fragmentation pattern. Usually, the indication of molecular weight is sufficient enough to indicate the presence of a compound. However, it is better to compare the major peaks in the experimental results with those in a reference mass spectrum of the compound being sought. If molecular structure is of importance, careful study of the fragmentation pattern is crucial. Fragmentation of the compound-of-interest is efficiently achieved by electron ionization (EI) or chemical ionization (CI) which is a more "gentle" ionization technique that leaves more appreciable populations of molecular ions. Chemical ionization does not provide good information about struc-ture though since the molecular ions that result from CI are relatively stable and they tend not to fragment into ions which could help in determining the identity and arrangement of functional groups in the molecule. For this reason, EI and CI are usually used in a complementary way to obtain reliable results.
Another consideration is the purity of the sample-of-interest. One must ensure that the sample being analyzed is as pure as possible [3]. In order to do this, a gas chromatography-mass spectrometer combination is often necessary to separate the
compound-of-interest from others.
Three of the common basic types of mass spectrometers are the magnetic, time-of-flight, and quadrupole (see Figure 1-6). Each of them have their own advantages and disadvantages.
The magnetic mass spectrometer (Figure 1-6a) is composed of a wedge-shaped magnetic field which disperses the total, unresolved ion beam from the ion source into discrete ion beams of individual mass per unit charge values by a process of direct focusing [1]. The ions which leave the ion source are accelerated in the mass spectrometer as they pass a potential which imparts kinetic energy to the ions. If an ion enters the magnetic field (which is perpendicular to the line of flight of the ion), it will be subjected to a magnetic force. This results in the ion following a circular path determined by balancing of the magnetic force by the centripetal force. From Figure 1-6a, it can be observed that when ions enter the magnetic field they follow circular paths of different radii (which depend on the different mass-to-charge ratios
Z) and only one of these will be of the correct value for an ion to reach the detector.
Time-of-flight mass spectrometers (Figure 1-6b) operate by measuring the time necessary for an ion to travel from the ion source to the detector [1]. All of the ions receive the same kinetic energy during acceleration but since they have different masses, they separate into groups according to velocity (and, hence, mass) as they traverse the region between the ion source and detector in the flight tube.
Finally, quadrupole mass spectrometers use a combination of DC and radio fre-quency (RF) potentials as a mass filter [1]. The quadrupole analyzer consists of four parallel electrodes with hyperbolic, elliptical, or circular cross-section (Figure 1-6c). The diagonally opposite electrodes (arranged symmetrically with the minimum-radius curve innermost) are at the same potential and are separated by a distance equal to twice the minimum radius of curvature. A potential is applied to the electrode to accelerate the ions. Once inside the rods, ions can have stable or unstable trajectories depending on the initial position and direction of movement of the ion when it enters the quadrupole. Once stability is established, stable ions are filtered and detected after passage through the quadrupole. Mass scanning is done by varying the voltage
applied to the electrodes.
Electron
or
Extraction and focusing Extraction and focusing
Figure 1-6: Types of mass spectrometer analyzers: a) magnetic (mi and zi represent mass and charge, respectively), b) time-of-flight, c) quadrupole.
Raman Spectroscopy
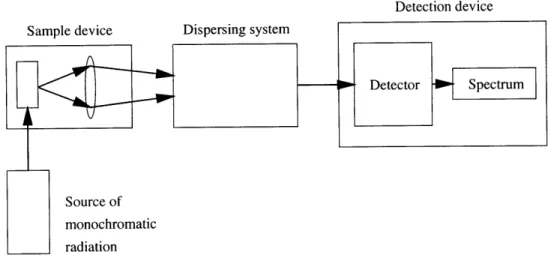
Raman spectroscopy refers to the phenomenon of scattering when monochromatic radiation is incident on gases, liquids or solids [4]. If the frequency content of the scattered radiation is analyzed, the results show not only the frequency of the incident light but also, in general, pairs of new frequencies. These frequencies are found to lie primarily in the ranges associated with transitions between rotational, vibrational, and electronic levels of the fluid's molecules. The scattered radiation usually has po-larization characteristics which are different from that of the incident light, and both the intensity and polarization of the scattered radiation depend on the direction of observation. The scattering is usually now made using a suitable laser and detected
Detection device Sample device Dispersing system
Figure 1-7: Block diagram of equipment for observation of Raman spectra.
photoelectrically. Figure 1-7 shows the block diagram of the equipment needed for observation of Raman spectra. The source of monochromatic radiation is usually a laser. The sample device is where the sample to be considered is illuminated and its scattered radiation collected using some kind of lens configuration. The dispersing system usually consists of a diffraction grating. Finally, the detection device consists of a photographic plate in the case of a spectrograph, or a special kind of photocell in the case of a spectrometer.
Problems with Raman include fluorescence and thermal sample degradation [4]. The high sensitivity of Raman spectroscopy can be drastically reduced when weak scattering occurs in the presence of background fluorescence, a situation often en-countered. Thermal decomposition of samples under intense focused laser beam is also encountered. These two problems can be avoided by using Fourier Transform Raman (FT-Raman) spectroscopy. Since both problems are related to absorption of the incident photons by some species in the sample, the way to avoid them is to use an incident laser frequency that avoids all absorption processes. FT-Raman uses this idea and other additional instrumentation to bypass the problems of fluorescence and
thermal sample degradation [5].
There are several advantages to using Raman spectroscopy over other techniques such as infrared (IR) spectroscopy [4]. Since Raman scattering from molecular vi-brations can be measured in the visible region of the spectrum, the optics of the
instrument are relatively simple. Sensitive detectors with high signal-to-noise ratios are available. The intrinsic weakness of the Raman effect necessitates the use of an intense monochromatic light source, and, as such, the laser is ideal. A decided ad-vantage of Raman spectroscopy is that a wide part of the spectrum is obtained with the same instrument and cell, giving more information in a shorter time. Infrared is applicable to almost any kind of sample but some materials (intractable polymers, single crystals, and aqueous solutions) are quite difficult to handle. With Raman spectroscopy, sample preparation is remarkably simple and the capability for using glass or quartz cells is a marked advantage (they are both transparent to Raman). Its principal limitation is with high colored or fluorescing materials.
Miniaturization of the spectroscopic methods just described has been an area of study for some years now [6]. Miniaturization of some of the subcomponents are possible. In terms of sources of laser radiation, optical fibers can be a possible tool. The detectors can be composed of miniature diode arrays. Furthermore, diffraction gratings may be made using deep-etch X-ray lithography, which is the first step of the LIGA manufacturing technique [6]. One of the major limitations in terms of minia-turization is the optical path length needed for some of the spectrometers which limits the physical size and performance of the spectrometer.
Some Optical Sensors
The principle source of selectivity in optical sensors, like in any other type of sensor, is provided by a chemically selective layer through the specific interactions with the chemical to be determined. This selective layer can be placed on the optical fiber in several different ways, depending on the type of interaction used. The simplest arrangement for absorption studies uses two fibers facing each other across a gap, which is filled with the selective layer [1]. One fiber delivers and the other collects the light with some acceptable efficiency (Figure 1-8a). The gap dimensions define the optical path length required for proper operation. Another configuration is the use of two parallel fibers and a mirror, which reflects the light into the collection fiber. The detection limit is improved since the light traverses the selective layer
Detector Source Beam Sample Splitter (a)
S
D ,(b) RS
f
Sample (c)Figure 1-8: Three most common types of arrangement of an optical sensor, where R is the reagent or selective layer, and S and D are the source and detector, respectively.
twice. A similar arrangement uses only one bifurcated layer, which transmits both the initial and final intensity (Figure 1-8b). The simplification at the sensing end leads to complications at the instrumentation end, where the two beams must be separated by mirrors, beam splitters, and other necessary hardware, and piped to the appropriate parts of the spectrophotometer. The reflecting surface in these two implementations can be a mirror or a scattering surface. In any case the sensor has the appearance of a monolithic probe. Optical sensors based on absorption, fluorescence, phosphorescence, and luminescence can employ these two configurations.
The second possibility is to make use of the continuous evanescent field which exists at the surface of an optical fiber and place the selective layer within this field (Figure 1-8c). For such an arrangement the protective coating and cladding are replaced by the selective layer in a short segment of the fiber [1].
a) b) c)
Figure 1-9: Gas-liquid chromatography via column separation: a) Mixture poured on top of column, b) partial separation, c) complete separation.
1.2
Gas-Liquid Chromatography
Gas-Liquid Chromatography (GLC) refers to a technique of separating substances [7]. This method relies on the relative movement of two phases with one of them be-ing fixed (stationary phase) and the other one movbe-ing (mobile phase). A column is usually used to separate a mixture (see Figure 1-9). The column is packed with porous material coated with a layer of liquid, usually water. The stationary phase is the liquid layer and the solid merely serves as a support for it. A small sample of the mixture is introduced into the column which then forms a band of absorbed material. When the solvent is allowed to flow through the column it carries with it the com-ponents of the mixture. The rate of movement of a given component depends on its solubility in the stationary phase. Hence, more soluble substances travel more slowly through the column than the less soluble ones. During their travel the substances undergo partition between the two phases and separation takes place because of the difference in the partition coefficients. All separations by chromatography depend on the fact that the substances which are being separated distribute themselves between the mobile and stationary phases in proportions which vary from one substance to
another.
01
E
1.3
Applications for Chemical Analyzers
There are countless of applications for gas and liquid sensors and analyzers. These range from smoke detectors to process control sensors for food and beverage
process-ing. The following sections describe these and other applications in more detail.
1.3.1
Home
The number one concern in the home, as far as gas sensors are concerned, is the establishment of clean air and the maintaining of clean air [2]. There are several gases of importance for gas sensing in the home. These include carbon monoxide, carbon dioxide, methane, propane, radon, and smoke. These gases can be poisonous when high enough concentrations are present (carbon monoxide/dioxide), they can cause respiratory problems (radon), or they may indicate dangerous situations (smoke, methane, and propane).Other possible applications for the home include air quality detectors, ethanol sensors in microwaves to improve cooking quality, sensors for com-bustion control in heaters and furnaces, and food spoilage or freshness sensors for the refrigerator or kitchen area.
1.3.2
Healthcare
In the healthcare area, chemical sensors can be very useful for diagnostic pur-poses. Examples of these include acetone detection in the breath for the diagnosis of diabetes, and the detection of oxygen content in the blood which is used to diagnose several medical conditions. Other applications include sensors for low levels of certain drugs in urine, and monitoring of glucose levels in diabetic patients to control insulin injections [8].
1.3.3
Environmental
Aside from healthcare and the home, chemical sensors have several other potential applications. The drive to improve combustion efficiency and reduce pollutant gas
products is very strong. The Environmental Protection Agency has requirements of smokestack monitoring of such combustion products as nitrous oxides, sulfur oxides and carbon monoxide which usually require exotic detection techniques (e.g., infrared absorption techniques) which are currently very costly. The competitive advantage of cheaper, smaller sensor technologies is obvious in this case [8].
1.3.4
Automotive and Defense
In the automotive area, sensors may be useful for climate control (e.g., humidity sensors), oil change indication, and exhaust pollution monitoring (e.g., nitrous and sulfur oxides, carbon monoxide). In the defense field, one of the most commonly-mentioned applications for chemical sensors is that of a portable low-level nerve gas monitor. As chemical and biological weapons become more of a threat, such a tool can help prevent prolonged exposure to dangerous levels of chemical and biological species [8].
1.3.5
Other Applications for Chemical Sensors
In the biotechnology area sensors for process yield and fermentation progress can be very useful [8]. These may include sensors for dissolved oxygen, carbon monoxide, sodium, potassium, chloride, calcium, pH, and sensors for various sugars and metal ions. Two more fields where chemical sensors may be useful are wastewater treatment and food and beverage processing. Monitoring and controlling the waste levels in dis-charged process water is a very attractive application for chemical sensors. Among the most important species to be monitored are hydrocarbons in general, and pro-cess solvents in particular, as well as heavy-metal ions, dissolved ammonia, chlorine and pesticides. Chemical sensors in the food and beverage processing area include sensors for continuous pH monitoring during various processing steps, and sensors for sulfur dioxide, which is used as a preservative in many foods and in beverages such as wine, where a minimum useful concentration is important to maintain proper flavor and aroma. Chemical sensors for monitoring the fermentation of wines, beer
Low Cost High Cost
Small Large
Selective Versatile
Examples: Examples: IR, electrochemical, FT-Raman, mass organic, organic spectroscopy, semiconductors gas/liquid
chromatography Figure 1-10: Spectrum of technologies in gas/liquid sensing.
and alcohol would improve uniformity and reduce costs. Devices for this purpose would include sensors for glucose, fructose, ethyl alcohol, pH, dissolved oxygen, dis-solved carbon dioxide, malic acid and tartaric acid. Other general purpose sensors may include potassium-ion sensors, sodium sensors, chloride sensors and calcium sen-sors. Although many of the latter chemical sensors exist in one form or another, they currently are not very useful in the food processing business because of surface contamination problems and high maintenance requirements.
1.4
Motivation for Micro-analyzer Development
As described in the previous sections, there are several technologies for gas and liquid analysis for a wide range of needs. These technologies can be separated into two broad categories (see Figure 1-10 ). At the lower end of the technology spectrum we have small, low cost, selective sensing technologies such as electrochemical and organic sensors. These include commercially-available sensors for the home such as carbon monoxide and smoke detectors. At the other end of the spectrum we have the high cost, larger, yet more versatile methods for gas sensing and analysis, such as spectroscopic methods (infrared, FT-Raman), and chromatography (gas, liquid). The following sections describe the general problems with the lower end sensing tech-nologies and thus provide motivation for the use of higher-end techtech-nologies for the microanalyzer project.
1.4.1
Lower-End Sensor Technology Problems
The problems with current lower-end sensor technology include limited selectivity, baseline drift, calibration, nonlinearity in the response of the sensor, size, high power consumption and operating temperature, and sensor poisoning. In terms of selectiv-ity, no sensor is specific enough, i.e., a sensor will be sensitive to other gases, humidselectiv-ity, and temperature [2]. Second, sensor baseline drift with time is usually caused by sev-eral environmental factors such as temperature and humidity. In addition, calibration and training of sensors must be portable to other nominally identical sensors espe-cially if the sensor baseline drifts over time. Also, sensor response is nonlinear for current sensors which adds complexity to the problem. Most current commercially-available sensor technology is relatively large compared to miniaturized devices, and operation is at high temperatures which means a high power consumption (e.g., tin-oxide sensor). Reactant gases also tend to poison sensors over time which affects the sensor reliability.
Some of the methods that may be used to overcome the problems just discussed can be in terms of design. For example, selectivity may be enhanced by having an ar-ray of non-selective (wide-band) sensors with broadly overlapping sensitivities. This is known as the electronic nose approach [9, 10, 11, 12]. The use of temperature and pressure modulation may also be used to improve selectivity. In terms of signal processing, the use of pre- and post-filtering of the signals (e.g., averaging, pattern recognition techniques), may be useful to compensate for drift, nonlinearity, and other environmental factors [9, 10, 11, 13]. Fourier analysis and sensor signal deconvolution using Gaussian functions have also been found to be useful tools for compensation and selectivity purposes [14, 15, 16, 17]. Even though these techniques for sensor improvement exist, there are still several practical problems in terms of long-term reliability and robustness which have not been solved and which have limited the operation of lower-end sensors.
There is a definite technological advantage in using the higher-end sensing and analysis technologies on the right of the technology spectrum shown in Figure 1-10,
and for this reason the decision was made to concentrate on utilizing these in the microanalyzer project. In order to minimize the higher cost and larger size of this technology, the miniaturization of such a device is being investigated. By doing this there will be several benefits. First, the small size of the microanalyzer will make it an attractive tool for on-site monitoring such as in environmental, industrial and combat settings. Second, with time its small size should help reduce the cost of such a system once production becomes cost effective. Thirdly, by concentrating on higher-end technologies, the system will have the versatility that other sensors don't have in terms of the variety of compounds which can be analyzed, increased sensitivity and robustness against drift and other factors. Another important advantage of using higher end technologies is their long history and the vast amount of knowledge base which exists as a result of it. The techniques that have been developed over the years can be very useful in optimizing a miniaturized system.
In particular, miniaturization of gas chromatographic systems has several benefits. First, aside from the portability and lower power consumption which miniaturization brings, smaller column diameters help improve column efficiencies, and the lower volumes help reduce cost in terms of mobile phase and stationary phase amounts re-quired. An introduction to gas chromatography and a brief history of miniaturization in chromatography will be described in the next chapter.
1.4.2
Thesis Overview
The following two chapters will describe the two topics of focus in this thesis, that is, gas chromatography and excimer laser ablation. These chapters are followed by chapters which describe the quartz micro-column manufacturing process which was developed, and the excimer laser ablation products sampling and analysis technique which was studied. Experimental setup and results are presented and discussed, and finally, suggestions for future work are made.
Chapter 2
Gas
Chromatography
Chromatography offers a way to separate and characterize complex mixtures of liquids or gases. In this section the basic theory behind gas chromatography is described and a brief history of the development of micro-chromatographs for the characterization of complex gas and liquid mixtures is introduced.
2.1
Introduction
Chromatography is an analytical method that is widely used for the separation, identification, and determination of the chemical components in complex mixtures, many of which could not otherwise be resolved [18]. In general, chromatography uses a stationary phase and mobile phase which can be either a gas or a liquid. Components of a mixture are carried through the stationary phase by the flow of the gaseous or liquid mobile phase. Separations are based on the differences in migration rates among the sample components. Figure 2-1 shows a schematic which explains how chromatography works in general. A single portion of the sample dissolved in the mobile phase is introduced at the head of the column, whereupon components A and B distribute themselves between the two phases. Introduction of additional mobile phase (the eluent) forces the dissolved portion of the sample down the column, where further partition between the mobile phase and fresh portions of the stationary phase takes place. Partitioning between the fresh solvent and the stationary phase takes
Sample Mobile Phase B+A Packed Column Detector Signal B A Detector tO tl t2 t3 t4 tO tl t2 t3 t4 Time
Figure 2-1: Elution chromatography.
place simultaneously at the site of the original sample. Further additions of solvent carry solute molecules down the column in a continuous series of transfers between the two phases. Since solute movement can occur only in the mobile phase, the average rate at which a solute migrates depends upon the fraction of time it spends in that phase. This fraction is small for solutes that are strongly retained by the stationary phase (B), and large where retention in the mobile phase is more likely (A). Ideally, the resulting differences in rates cause the components in a mixture to separate into bands, or zones, along the length of the column. Isolation of the separated species is then accomplished by passing a sufficient quantity of mobile phase through the column to cause the individual bands to pass out at the end (to be eluted from the column), where they can be collected.
Sample Moie hs_ ~ ~
I
tO tl t2 t3 t4-00-General Specific Stationary Phase Equilibrium
Liquid Liquid-liquid Liquid adsorbed Partition between Chromatography or partition on a solid immiscible liquid (Mobile phase-liquid)
Liquid- Organic species Partition/ bonded phase bonded to a solid adsorption
surface
Liquid-solid, Solid Adsorption
or adsorption
Ion exchange Ion-exchange resin Ion-exchange Size exclusion Liquid in Partition/sieving
interstices of a polymeric solid
Gas Gas-liquid Liquid adsorbed Partition between Chromatography on a solid gas and liquid
(Mobile phase-gas) Gas-bonded Organic species Partition/ phase bonded to a solid adsorption
surface
Gas-solid Solid Adsorption Table 2.1: Classification of chromatography.
2.1.1
Classification of Chromatography
Classification of chromatographic methods is based on either the physical means by which stationary and mobile phases are brought into contact with each other (e.g., column and planar chromatography), or by whether the mobile phase is a liquid or a gas (e.g., liquid, gas chromatography) [18]. Each type varies according to the specific method that is used to bring the mobile and stationary phases into contact, the stationary phase used, and the type of equilibrium which takes place during the separation process. Table 2.1 summarizes the different types of chromatography generally encountered in the field.
2.1.2
Chromatograms
The performance of any chromatographic separation is based on the output from the detector at the end of the column. This is usually in the form of a chromatogram.
0 0 0 Q t2 Distance Migrated
Figure 2-2: Typical chromatogram showing the output peaks for each subspecies.
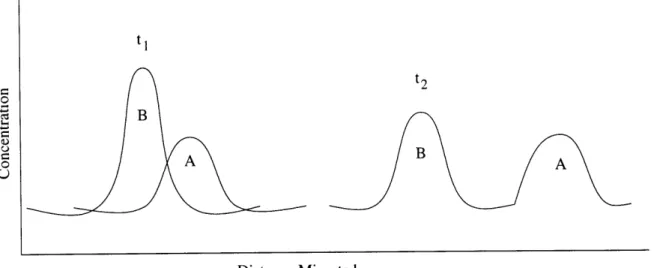
A chromatogram is a plot showing the solute concentration detected at the end of the column versus time (or volume of added mobile phase) [18]. The positions of the peaks on the time axis can be used to identify the components of the sample, while the areas under the peaks provide a quantitative measure of the amount of each species.
Figure 2-2 shows a typical chromatogram which shows the output of a detector. The chromatogram shows that species B is more strongly retained by the stationary phase than A. The distance between the two increases as they move down the column. The time from the point of sample introduction into the column to the time the peaks appear in the chromatogram is known as the retention time for that particular peak. In Figure 2-2 tl and t2 correspond to the retention times for compounds A and B,
respectively.
2.2
Migration Rates of Solutes
There exist several indices used to characterize chromatographic separations. These serve as a tool to describe the physical variables involved in the separation process as well as to provide a way to measure the performance of the separations, find optimal values for each separation, and to have some way of comparing different chromato-graphic separations in terms of efficiency. The following sections discuss these in
©
•9 ©
greater detail.
2.2.1
Partition Ratios
All chromatographic separations are based upon differences in the extent to which solutes are partitioned between the mobile and stationary phase [18]. The equilibrium constant for this reaction is called the partition ratio and it is defined as
K = cs (2.1)
CM
where cs is the molar analytical concentration of a solute in the stationary phase and CM is its analytical concentration in the mobile phase. Ideally K is constant
over a wide range of solute concentrations, that is, cs is proportional to CM. This
condition is the basic assumption made when doing chromatography and in this case the process is referred to as linear chromatography.
2.2.2
Retention Times
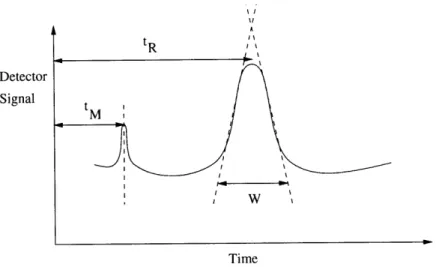
As mentioned before, the retention time tR is the time required for an output peak to reach the detector at the end of the column (see Figure 2-3) [18]. The peak at retention time tM is for a species that is not retained by the column; its rate of migration is the same as the rate of motion of the molecules of the mobile phase. The retention time serves as the main indicator of compound presence in a mixture. It is used to differentiate between compounds once proper calibration with known standards has been carried out. The average linear rate of solute migration v is
v =
(2.2)
tR
where L is the length of the column packing. Similarly, the average linear rate of movement u of the molecules of the mobile phase is
u = (2.3)
Detector Signal
Time
Figure 2-3: Definition of retention time for output peak of length W.
2.2.3
The Retention Time and Partition Ratio Relationship
In order to relate the retention time of a solute to its partition ratio, the migration rate is expressed as a fraction of the velocity of the mobile phase:S= u x fraction of time solute spends in mobile phase (2.4)
This fraction is equal to the average number of moles of solute in the mobile phase at any instant divided by the total number of moles of solute in the column [18]:
moles of solute in mobile phase
v = ux
(2.5)
total moles of solute
CMu VM 1
= uX
MVM
=ux
(2.6)
CMVM+ + CSVS + CMVMVs
where CM and cs are the molar concentrations of the solute in the mobile and sta-tionary phases, respectively, and VM and Vs are the total volumes of the two phases in the column. After some manipulation using Equation 2.1 and Equation 2.6, an expression for the rate of solute migration as a function of its partition ratio and the
volumes of the stationary and mobile phases is obtained:
v = x
(2.7)
1 + KE s
VMThe two volumes may be estimated from the method by which the column is prepared [18].
2.2.4
The Rate of Migration of Solutes: The Capacity Factor
The capacity factor is an important parameter that is widely used to describe the migration rates of solutes in columns [18]. For a solute A, the capacity factor is defined asA = KA (2.8)
AVM
where KA is the partition ratio for the species A. Substitution of Equation 2.8 into Equation 2.7 yields
v= u , (2.9)
1+ kA
After some manipulation of Equation 2.9 using Equations 2.2 and 2.3, it can be shown that the capacity factor can be obtained from a chromatogram:
k tR - tM (2.10)
tM
When the capacity factor for a solute is much less than unity, elution goes on so rapidly that accurate determination of the retention times is difficult. When the capacity factor is larger than perhaps 20 to 30, elution times become inordinately long. Ideally, separations are performed under conditions in which the capacity factors for the solutes in a mixture lie in the range between 1 to 5. Capacity factors can be varied by changing temperature and column packing. In liquid chromatography, capacity factors can often be manipulated to give better separations by varying the composition
2.2.5
Differential Migration Rates: Selectivity Factor
The selectivity factor of a column for the two species A and B is defined asKB
= (2.11)
KA
where KB is the partition ratio for the more strongly retained species B and KA is the constant for the less strongly held or more rapidly eluted species A. By this definition, a is always greater than unity. Substituting Equation 2.8 into Equation 2.11 yields
a =kB (2.12)
kA
which relates the selectivity factor for two solutes and their capacity factors where k'B
and kA are the capacity factors for B and A, respectively. Substitution of Equation
2.10 for the two solutes into Equation 2.12 gives
S_ (tR)B - tM (2.13)
(tR) A - tM
which shows that the selectivity factor can be determined from an experimental chro-matogram. The selectivity factor is useful in describing differential migration rates between two compounds being separated [18].
2.3
Band Shapes and Band Broadening
Theory of column chromatography must address the following phenomena: 1. Differential migration rates of solutes.
2. The Gaussian shapes of chromatographic peaks. 3. Peak broadening.
The previous section addressed differential migration rates and in this section the shapes and breadths of chromatographic peaks are considered.