HAL Id: hal-02948127
https://hal.inrae.fr/hal-02948127
Submitted on 24 Sep 2020
HAL is a multi-disciplinary open access
archive for the deposit and dissemination of
sci-entific research documents, whether they are
pub-lished or not. The documents may come from
teaching and research institutions in France or
abroad, or from public or private research centers.
L’archive ouverte pluridisciplinaire HAL, est
destinée au dépôt et à la diffusion de documents
scientifiques de niveau recherche, publiés ou non,
émanant des établissements d’enseignement et de
recherche français ou étrangers, des laboratoires
publics ou privés.
Distributed under a Creative Commons Attribution| 4.0 International License
quantitative trait loci underlies natural variation of
Arabidopsis thaliana quantitative disease resistance to
Ralstonia solanacearum under heat stress
Nathalie Aoun, Henri Desaint, Léa Boyrie, Maxime Bonhomme, Laurent
Deslandes, Richard Berthomé, Fabrice Roux
To cite this version:
Nathalie Aoun, Henri Desaint, Léa Boyrie, Maxime Bonhomme, Laurent Deslandes, et al.. A complex
network of additive and epistatic quantitative trait loci underlies natural variation of Arabidopsis
thaliana quantitative disease resistance to Ralstonia solanacearum under heat stress. Molecular Plant
Pathology, Wiley, In press, �10.1111/mpp.12964�. �hal-02948127�
Molecular Plant Pathology. 2020;00:1–16. wileyonlinelibrary.com/journal/mpp
|
11 | INTRODUCTION
Climate scenarios predict that extreme climate events will become more frequent by the end of the century (IPCC, 2018), alongside an expected increase in global surface temperature from 1.5 to 4.8°C
(IPCC, 2018). In such a context of climate warming, global food security is at risk, with crop yields threatened by both the direct effect of increased temperature on plant development (Hatfield et al., 2011; Saidi et al., 2011; Bita and Geratz, 2013; Gray and Brady, 2016) and the indirect ef-fect of increased temperature on the emergence of new pathogens and Received: 21 November 2019
|
Revised: 18 May 2020|
Accepted: 19 May 2020DOI: 10.1111/mpp.12964
O R I G I N A L A R T I C L E
A complex network of additive and epistatic quantitative
trait loci underlies natural variation of Arabidopsis thaliana
quantitative disease resistance to Ralstonia solanacearum under
heat stress
Nathalie Aoun
1| Henri Desaint
1,2| Léa Boyrie
3| Maxime Bonhomme
3|
Laurent Deslandes
1| Richard Berthomé
1| Fabrice Roux
1This is an open access article under the terms of the Creative Commons Attribution License, which permits use, distribution and reproduction in any medium, provided the original work is properly cited.
© 2020 The Authors. Molecular Plant Pathology published by British Society for Plant Pathology and John Wiley & Sons Ltd 1LIPM, Université de Toulouse, INRAE,
CNRS, Castanet-Tolosan, France 2SYNGENTA seeds, Sarrians, France 3LRSV, Université de Toulouse, CNRS, Université Paul Sabatier, Castanet-Tolosan, France
Correspondence
Fabrice Roux and Richard Berthomé, LIPM, Université de Toulouse, INRAE, CNRS, Castanet-Tolosan, France.
Email: fabrice.roux@inrae.fr; richard. berthome@inrae.fr
Funding information
Occitanie Regional Council; INRA Plant Health and Environment division; Agence Nationale de la Recherche, Grant/Award Number: DeCoD; Syngenta seeds
Abstract
Plant immunity is often negatively impacted by heat stress. However, the underly-ing molecular mechanisms remain poorly characterized. Based on a genome-wide association mapping approach, this study aims to identify in Arabidopsis thaliana the genetic bases of robust resistance mechanisms to the devastating pathogen Ralstonia
solanacearum under heat stress. A local mapping population was phenotyped against
the R. solanacearum GMI1000 strain at 27 and 30 °C. To obtain a precise description of the genetic architecture underlying natural variation of quantitative disease resist-ance (QDR), we applied a genome-wide local score analysis. Alongside an extensive genetic variation found in this local population at both temperatures, we observed a playful dynamics of quantitative trait loci along the infection stages. In addition, a complex genetic network of interacting loci could be detected at 30 °C. As a first step to investigate the underlying molecular mechanisms, the atypical meiotic cyclin SOLO
DANCERS gene was validated by a reverse genetic approach as involved in QDR to R. solanacearum at 30 °C. In the context of climate change, the complex genetic
ar-chitecture underlying QDR under heat stress in a local mapping population revealed candidate genes with diverse molecular functions.
K E Y W O R D S
epistasis, GWA mapping, heat stress, local score, natural accessions, Ralstonia solanacearum, SOLO DANCER
the number and severity of epidemics (Garett et al., 2006; Evans et al., 2008; Bebber et al., 2013; Bita and Gerats, 2013; Suzuki et al., 2014). Unravelling the genetic and molecular mechanisms allowing plants to face pathogen attacks under elevated temperature therefore represents a promising strategy for sustainable disease resistance.
Being sessile, plants have developed a wide range of immune re-sponses to face simultaneous and/or sequential stresses caused by various bioaggressors (Roux and Bergelson, 2016). Plant immunity re-lies on a surveillance system involving plasma membrane-anchored pattern recognition receptors (PRRs) that perceive microbial elicitors, called pathogen- or microbe-associated molecular patterns (PAMPs or MAMPs). PRR-triggered immunity (PTI) is efficient against a broad spectrum of pathogens (Cook et al., 2015). Adapted pathogens such as phytopathogenic bacteria trigger susceptibility thanks to secreted viru-lence factors called effectors that can inhibit PTI and promote pathogen invasion (effector-triggered susceptibility, ETS). The specific recognition of pathogen effectors by plant intracellular nod-like receptors (NLRs) triggers a more robust immune response called effector-triggered im-munity (ETI), often associated with a cell death response or hypersen-sitive response (HR) that restricts pathogen invasion to the infection site. In general, ETI is specific to a single pathogenic species, and even to a single pathogenic strain. This specificity causes a strong selective pressure on virulent strains to bypass ETI, making in most cases this form of immunity not durable in crop field conditions (Roux et al., 2014). Another form of resistance represented by a reduction rather than an absence of disease refers to quantitative disease resistance (QDR) (St Clair, 2010; Mundt, 2014; Roux et al., 2014; French et al., 2016). QDR is generally polygenic, durable and broad spectrum (Young, 1996; Poland et al., 2009). Unlike PTI and ETI, molecular mechanisms underlying QDR remain largely unknown (Roux et al., 2014). Noteworthy is the alteration of all these major forms of immunity by heat stress. Numerous studies involving various pathosystems reported inhibition of ETI responses by a temperature increase (3–7°C) (de Jong et al., 2002; Xiao et al., 2003; Yang and Hua, 2004; Wang et al., 2009; Cheng et al., 2013; Menna et al., 2015; Aoun et al., 2017; Venkatesh and Kang, 2019).
Bacterial wilt, caused by the gram-negative bacterium Ralstonia solanacearum, is one of the most devastating bacterial diseases in the world. Indeed, this soilborne pathogen affects more than 200 species, including members of Solanaceae and Brassicaceae, and is responsible for dramatic yield losses not only in tropical and subtropical areas, but also in warm temperate regions (Elphinstone, 2005). In the model plant Arabidopsis thaliana, a broad-spectrum resistance response to R. sola-nacearum is conferred by the RPS4/RRS1-R locus that encodes a pair of NLR receptors cooperating molecularly to form homodimers (Deslandes et al., 2002; Birker et al., 2009; Narusaka et al., 2009; Williams et al., 2014). In addition, the leucine-rich repeat receptor-like kinase ERECTA was identified as underlying one of the three quantitative trait loci (QTLs) detected against the R. solanacearum strain 14.25 (Godiard et al., 2003).
The genetic architecture and the molecular mechanisms of plant re-sponses to R. solanacearum in changing abiotic environments, and more particularly under elevated temperature conditions, remain elusive. Recently, a genome-wide association study (GWAS) performed in A. thali-ana and aimed at exploring the genetic bases associated with the natural
variation of plant response to strain GMI1000 at 30°C led to the identifica-tion of the Strictosidine Synthase-Like protein 4 (SSL4) gene, although the underlying molecular mechanisms are still unknown (Aoun et al., 2017). This study was based on 176 accessions of A. thaliana from a worldwide collection. While being informative, a limitation of this mapping popula-tion-based approach resides in an increased effect of the demographic history on genotype–phenotype association at large geographical scales. Statistical methods controlling for confounding by population structure can reduce the rate of false-positive associations, but to the detriment of a loss of detection power (i.e., markers linked to causative genes that are lost after correcting for population structure; Bergelson and Roux, 2010, Brachi et al., 2010). In addition, because different QTLs and/or different alleles at the same QTL can be responsible for the same phenotypic values, the power of GWAS can be strongly reduced by the effects of genetic and allelic heterogeneity due to the increased probability of the presence of rare alleles at large geographical scales (Bergelson and Roux, 2010). To limit these drawbacks, GWA mapping can be combined with traditional linkage mapping (based on the use of experimental populations such as recombinant inbred lines, RILs), which is prone to identifying rare alleles and not subjected to the effect of population structure (Bergelson and Roux, 2010). Combining GWA mapping and traditional linkage mapping has been demonstrated to reduce the rates of false positives and nega-tives when applied to flowering time data in A. thaliana (Brachi et al., 2010), but remains time-consuming due to the need to phenotype thousands of experimental lines. To limit the drawbacks of GWA mapping performed at a worldwide scale, an alternative approach is to work at a small geograph-ical scale (Bergelson and Roux, 2010). As reported in a GWAS performed on flowering in A. thaliana from a worldwide to a local scale (by using two highly polymorphic French mapping populations), a great reduction of con-founding by population structure was observed at the smaller geograph-ical scales (Brachi et al., 2013). In addition, the genetic architecture was highly specific on the considered geographical scale (Brachi et al., 2013).
In the present study, we therefore investigated the genetic bases of QDR to R. solanacearum under elevated temperature by performing a GWAS at a small geographical scale using the TOU-A local mapping population. This local mapping population offers several advantages, including (a) the detection of more than 1.9 million single nucleotide polymorphims (SNPs), only 5.6 times less than observed in a panel of 1,135 accessions collected at the worldwide scale (Frachon et al., 2017); (b) an extensive genetic variation for a large range of phenotypic traits, including QDR to the bacterial vascular pathogen Xanthomonas campestris pv. campestris; (c) a linkage disequilibrium (LD) decay below 3 kb allowing fine-mapping of genomic regions associated with phe-notypic variation; (d) a strongly reduced confounding effect by popu-lation structure; and (e) an adaptation to local warming in fewer than eight generations (Brachi et al., 2013; Huard-Chauveau et al., 2013; Baron et al., 2015; Debieu et al., 2016; Frachon et al., 2017).
Interestingly, this work revealed a genetic architecture of natu-ral variation of QDR to R. solanacearum that totally differs from the one previously described at the worldwide scale (Aoun et al., 2017). In particular, at 30°C, we observed a playful dynamics of 12 QTLs, showing an increase or a decrease in significance, along the disease symptom progression, with most QTLs displaying complex epistatic
relationships. Using a reverse genetic approach, we identified SOLO DANCERS (SDS) encoding a cyclin-like protein as the gene underlying one of the two additive QTLs detected at 30 °C.
2 | RESULTS
2.1 | Impact of temperature on genetic variation
for QDR to R. solanacearum among local A. thaliana
accessions
In this study, we tested 192 whole-genome sequenced local acces-sions of A. thaliana in response to the R. solanacearum GMI1000 ref-erence strain, under growth chamber conditions. No germination was observed for six accessions that were therefore discarded from the study (Table S1). The remaining 186 local accessions from the TOU-A population were challenged with GMI1000 at 27 and 30 °C by cut-ting the roots. The accessions were on average more susceptible at 30 °C than at 27 °C (Figure 1a,b). For each temperature treatment, we observed a large genetic variation at most infection stages, that is, 5, 6, and 7 days after inoculation (dai) at 27 °C and 4, 5, 6, and 7 dai at 30 °C (Table 1 and Figure 1), with broad-sense heritability estimates ranging from 0.34 to 0.41 at 27°C and from 0.29 to 0.39 at 30 °C (Table 1). Based on genotypic values estimated for the 186 TOU-A accessions, cross-temperature genetic correlation was weak, albeit significant (5 dai: Spearman's rho = 0.23, p = .003, 6 dai; Spearman's rho = 0.16, p = .033, 7 dai; Spearman's rho = 0.20, p = .008; Figure 1c), suggesting a flexible genetic architecture of A. thaliana response to the GMI1000 strain between 27 °C and 30 °C.
2.2 | Playful dynamics of QTLs at 27 and 30 °C
To increase the probability to discover QTLs with additive effects conferring QDR to R. solanacearum along the infection stages, wecombined a genome-wide association mapping approach with a local score analysis (with tuning parameter ξ = 2) (Bonhomme et al., 2019). We detected over the infection stages 215 and 738 significant unique SNPs (i.e., top SNPs) at 27 and 30 °C, respectively (Figure 2). In agreement with weak cross-temperature genetic correlation, no single top SNP was common to both temperatures, indicating a contrasted genetic architecture for natural variation of response to R. solanacearum GMI1000 between 27 and 30 °C. Next, we fo-cused on the 14 most highly significant additive QTLs (i.e., top QTLs with a Lindley process >10, Figures 2 and 3). Two top QTLs were detected at 27 °C while the remaining top QTLs were detected at 30 °C (Figure 2). Interestingly, all these top QTLs displayed playful dynamics, with two QTLs (i.e., QTL1 at 27 °C and QTL3 at 30 °C) and 12 QTLs showing a decrease and increase in significance with advanced infection stages, respectively (Figure 2).
Based on LD calculation among the 14 top QTLs, both QTLs detected at 27 °C only present additive (i.e., independent) effects (Figures 4, S1, and S2). By contrast, at 30 °C, nine out of the 12 top QTLs also displayed epistatic interactions (Figures 4 and S2) with the identification of two groups of epistatic QTLs (Figure 5). The first one regroups seven QTLs (QTL5 + QTL6 + QTL7A + QTL7B + QTL 9 + QTL10 + QTL11) with highly significant pairwise LD values (p < .001); in particular at the interchromosomal level (Figures 4, 5, and S2). Based on the representative SNPs of the seven QTLs, 47.1% of disease index variation was explained by the cumulative number of resistance alleles at these QTLs (Figure 5c). It should be noted that c.80% of the accessions have a susceptible allele at each of the seven QTLs (Figure 5c), precluding testing with sufficient power any pairwise interactions among these QTLs. The second group contains QTL12A + QTL12B (Figure 5), with a clear disequilibrium in the num-ber of accessions among the four expected haplotypes (SS = 88.9%, RR = 9%, RS = 0.7%, SR = 1.4%; Figure S1). QTL8 showed weak epistatic relationships with QTL5 and QTL9 (Figure 5a), whereas no significant epistatic relationship was detected for the two remaining QTLs detected at 30 °C (i.e., QTL3 and QTL4) (Figures 5, S1, and S2).
F I G U R E 1 Genetic diversity of plant response to Ralstonia solanacearum GMI1000 in the local TOU-A mapping population. (a) Genetic
variation of response dynamics at 27 °C. (b) Genetic variation of response dynamics at 30 °C. The red line represents the mean of disease index over all the accessions in (a) and (b). (c) Relationship between disease index at 6 dai scored at 27 and 30°C. dai, days after inoculation. DI, disease index. The black line represents the locally weighted polynomial regression
2.3 | Molecular functions of the candidate gene
products underlying the QTLs identified
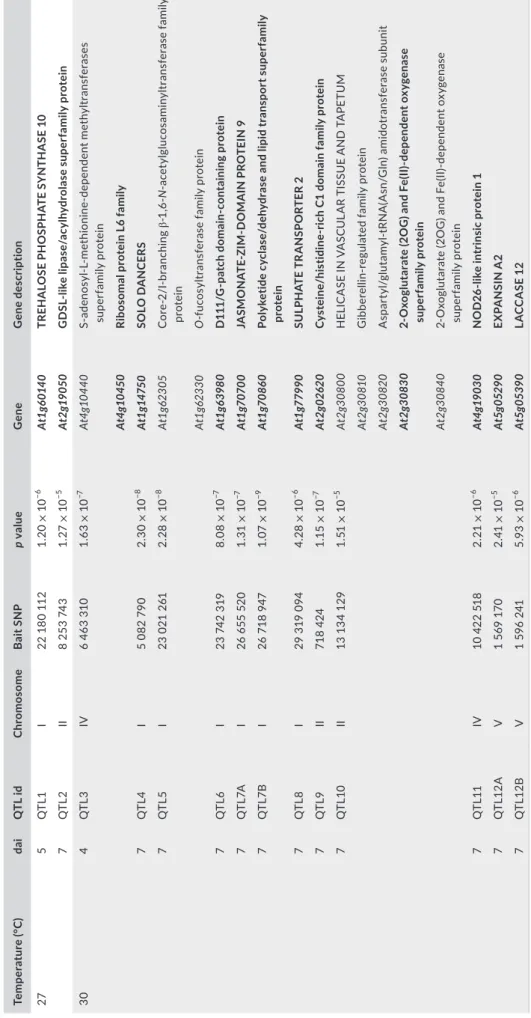
In agreement with the LD decay below 3 kb observed in the TOU-A population, the average size of the 14 QTLs was 4,589 bp (min = 141 bp, max = 26.07 kb, Figure 3), thereby limiting the num-ber of candidate genes underlying each QTL. The AGI locus code and the corresponding predicted molecular function(s) of the can-didate genes are indicated in Table 2. At 27°C, the top SNP of QTL1 (SNP-1-22180112) is located in the coding region of TREHALOSE PHOSPHATE SYNTHASE 10 (At1g60140) (Figure 3a). QTL2 cov-ers a short region of c.1.77 kb, with the top SNP SNP-2-8253743 located in a gene (At2g19050) belonging to a GDSL-like Lipase/ Acylhydrolase protein superfamily (Figure 3b).
At 30 °C, the candidate genes underlying the 12 top QTLs en-code for various molecular functions. Functional classification was performed with the Classification Superviewer Tool on the University of Toronto website (http://bar.utoro nto.ca/ntool s/cgi-bin/ntools_class ifica tion_super viewer.cgi) using the MAPMAN classification as source (Provart and Zhu, 2003) and the list of genes to which top SNPs were associated. In particular, two QTLs correspond to genes involved in abiotic stress signalling pathways, that is, QTL3 with the top SNP SNP-4-6463310 and QTL7B with the top SNP SNP-1-26718947 falling within At4g10450 and At1g70860 encoding a ribosomal pro-tein L6 family and a cytokinin responsive lipid transport propro-tein, re-spectively (Figure 3c,h and Table 2). QTL4 covers a small region of 730 bp, with the top SNP SNP-1-5082790 falling within the promoter region of SOLO DANCERS (At1g14750) that encodes an atypical mei-otic cyclin-like protein (Figure 3d and Table 2). The top SNPs SNP-1-29319094 and SNP-4-10422518 of QTL8 and QTL11 were located in the genomic region of At1g77990 (SULPHATE TRANSPORTER 2;2) and At4g19030 (NOD26-LIKE INTRINSIC PROTEIN 1,1), respec-tively, encoding a sulphate and an aquaporin transporter, respectively (Figure 3i,l and Table 2). QTL12A and QTL12B with the top SNP SNP-5-1569170 and SNP-5-1596241 are located within genes encoding EXPANSIN A2 (At5g05290) involved in cell wall modification and a lignin peroxidase (At5g05390) involved in vascular development, re-spectively (Figure 3m,n and Table 2). However, among the different biological pathways represented by the 18 candidate genes identi-fied, only the hormonal metabolism was significantly overrepresented (p < .01). For instance, the top SNPs of QTL7A (SNP-1-26655520) and QTL10 (SNP-2-13134129) are located in genes At1g70700 (JAZ9) and At2g30830 (or alongside At2g30810), which are involved in jasmon-ate (JA), ethylene (ET), and gibberellin (GA) hormonal metabolisms, respectively (Figure 3g,h,k and Table 2).
2.4 | SOLO DANCERS is the gene underlying QTL4
involved in QDR to R. solanacearum GMI1000 at 30 °C
Next we investigated the molecular mechanisms underlying plant response to R. solanacearum at 30 °C in the TOU-A population. For this, we focused on the additive QTL with the highest allelicT A B LE 1 N at ur al v ar ia tio n a m on g T O U -A n at ur al a cc es si on s f or d is ea se i nd ex a t 2 7 a nd 3 0° C Tem per at ur e (° C ) Mo de l t er m s Sy m pt om s 3 d ai Sy m pt om s 4 d ai Sy m pt om s 5 d ai Sy m pt om s 6 d ai Sy m pt om s 7 d ai Sy m pt om s 9 d ai F o r L RT p F o r L RT p F o r L RT p F o r L RT p F o r L RT p F o r L RT p 27 B lo ck 0.7 0. 52 62 1.7 0. 20 49 6. 3 0.0 03 6 36 .4 0.0 00 2 58 .4 0.0 00 2 50 .9 0.0 00 2 Ac ce ssi on 0.0 1. 0000 2.9 0. 10 76 9. 0 0.0 04 2 14 .3 0.0 00 4 7. 9 0.0 06 9 3. 3 0.0 90 6 C on tr ol C ol -0 ne ne 54 .8 0.0 00 2 105 .9 0.0 00 2 12 2. 8 0.0 00 2 11 0.0 0.0 00 2 87. 1 0.0 00 2 H 2 0.0 0 ns 0. 21 ns 0. 35 ** 0. 41 *** 0. 34 ** 0. 37 ns 30 B lo ck 3.7 0.0 38 2 20 .9 0.0 00 4 18 .2 0.0 00 4 9. 0 0.0 00 4 5. 8 0.0 06 4 4. 2 0.0 60 2 Ac ce ssi on 1.4 0. 28 74 9. 5 0.0 05 1 18 .4 0.0 00 4 8.7 0.0 06 4 12 .4 0.0 01 4 0. 2 0. 69 56 C on tr ol C ol -0 0.1 0. 78 62 12 .2 0.0 01 4 6. 8 0.0 15 8 0.4 0. 59 67 2.4 0.1 59 5 ne ne H 2 0.1 3 ns 0. 29 ** 0. 39 *** 0. 3 ** 0. 37 ** 0. 11 ns F, F v al ue r es ul tin g f ro m t he t es t o f f ix ed e ff ec t; L RT , L RT v al ue r es ul tin g f ro m t he l ik el ih oo d r at io t es t; H 2, b ro ad -s en se h er ita bi lit y v al ue s; d ai , d ay s a ft er i no cu la tio n; n e, n ot e st im at ed d ue t o t he a bs en ce of v ar ia tio n i n d is ea se s ym pt om s a m on g C ol -0 c on tr ol p la nt s; n s, n ot s ig ni fic an t. I ta lic t er m s i nd ic at e r an do m e ff ec ts . ** p < .0 1; *** p < .0 01 .
effect, that is, QTL4 located on the top of chromosome I and that encompasses the SOLO DANCERS locus (SDS, At1g14750) (Figures 2b and S1). To check whether SDS was involved in this QDR, we monitored at 27 and 30 °C the phenotypical response of sds-2 and sds-3 null mutants (in Col-0 and Ws-4 genetic back-grounds, respectively). Col-0 and Ws-4 are both susceptible to GMI1000 at 30 °C while Ws-4, but not Col-0, is resistant at 27 °C. At 27 °C, the sds-2 mutant response was not significantly differ-ent from Col-0 except at 6 dai (Figure 6a and Table S2). At 30 °C, the wilting of sds-2 was significantly delayed compared to that of Col-0 from 3 to 5 dai (Figure 6b and Table S2). As expected, sds-3 mutant and Ws-4 plants remained symptomless at 27 °C, from 3 to 7 dai (Figure 6c and Table S2). By contrast, at 30 °C, wilting
of sds-3 plants was strongly reduced during all infection stages (Figure 6d and Table S2). Altogether, these data suggest that SDS plays a role in wilting disease development on infection with the R. solanacearum GMI1000 strain at 30 °C.
3 | DISCUSSION
3.1 | Worldwide versus local genetic variation in
A. thaliana facing R. solanacearum
In comparison with a temperature of 27 °C, local Arabidopsis ac-cessions exposed at 30 °C were on average more susceptible to
F I G U R E 2 The genetics of quantitative disease resistance to Ralstonia solanacearum GMI1000 in the TOU-A population. (a) Manhattan
plot of the Lindley process (local score method with a tuning parameter ξ = 2) at 5, 6, and 7 days after inoculation ( dai) at 27 °C. (b) Manhattan plot of the Lindley process (ξ = 2) at 4, 5, 6, and 7 dai at 30 °C. (c) Zoom spanning a genomic region at the end of chromosome I from 23 Mb to 29.3 Mb containing five quantitative trait loci (QTLs). The dashed line indicates the maximum of the five chromosome-wide significance thresholds. To better highlight minor QTLs in (a) and (b), Lindley process values on the y axis range from 0 to 40. Note that for the main association peak detected on chromosome I at V dai and 27 °C, the highest local score value is 58.6. The number close to association peaks correspond to the 14 QTLs with a Lindley process value above 10. "7A&B" corresponds to two QTLs on chromosome I separated by c.63.5kb. "12A&B" corresponds to two QTLs on chromosome V separated by c.27.1kb
F I G U R E 3 Zoom spanning the 14 quantitative trait loci (QTLs) with a Lindley process value above 10. Each of the 14 QTLs highlighted
in Figure 2 are depicted from (a) to (n). The x axis corresponds to the physical position of the single nucleotide polymorphisms (SNPs). The dots correspond to the −log10 p values of the SNPs obtained with the mixed model implemented in the EMMAX software (y axis on the left). The solid coloured curve indicates the Lindley process (local score method with ξ = 2) calculated from left to right (y axis on the right). The two coloured dashed vertical lines indicate the QTL intervals detected, without taking into account the right part of the curve (Fariello et al., 2017; Bonhomme et al., 2019)
the GMI1000 strain as indicated with a faster wilting disease pro-gression than that observed at 27 °C. This observation is in line with the drastic impact of heat stress on Arabidopsis response to
the GMI1000 strain previously monitored in a worldwide collec-tion of A. thaliana (Aoun et al., 2017). This is also in accordance with a growing number of studies performed on crops infected by
F I G U R E 4 Detection of inter-QTLs
epistasis for QTL1 (a), QTL4 (b), and QTL9 (c). For each quantitative trait locus (QTL), a genome-wide distribution (grey area) was established by calculating linkage disequilibrium (LD) values between the bait top single nucleotide polymorphism (SNP) and all the other SNPs across the genome (with the exception of the SNPs located in a 100 kb window surrounding the bait top SNPs). Only SNPs with a minor allele relative frequency (MARF) > 0.07 were considered. In addition, LD values (above 0.1) between the bait top SNP for the corresponding QTL and the bait top SNPs from the other QTLs are represented by arrows. The x axis corresponds to the LD estimates expressed as the absolute value of the r correlation coefficient. The black line corresponds to the density curve
different pathogenic species that have described the drastic impact of heat stress on resistance response (Moury et al., 1998; Jablonska et al., 2007; Wang et al., 2009; Webb et al., 2010). The respective
impact of heat stress on host and pathogen is still a matter of debate. Alteration of plant immunity under heat stress has been reported in several studies. For instance, a temperature of 28 °C inhibits “spontaneous lesion” phenotypes or autoimmune responses linked to autoactive alleles of genes encoding NLR resistance proteins (Zhu et al., 2010; Negeri et al., 2013). While heat stress increases A. thaliana susceptibility to infection with Pseudomonas syringae pv. tomato DC3000, it also promotes the plant-dependent bacte-rial multiplication (Huot et al., 2017). In this study, R. solanacearum grows faster at 30 °C than at 28 °Cunder in vitro conditions (Figure S3a) and a significant increase in bacterial multiplication was ob-served in planta at 30 °C (Figure S3b), suggesting an effect of heat stress on bacterial multiplication and its pathogenicity.
In previous studies, the level of genetic variation for diverse phe-notypic traits such as flowering time and QDR to the bacterial patho-gen X. campestris was similar between the TOU-A population and a set of worldwide accessions (Brachi et al., 2013; Huard-Chauveau et al., 2013; Debieu et al., 2016). Here, the level of phenotypic and genetic variation for QDR to R. solanacearum in the TOU-A popula-tion was limited compared to that of the worldwide (WW) collec-tion (mean standard deviacollec-tion of phenotypic values between 5 and 7 dai: WW 27 °C = 1.61, TOU-A 27 °C = 1.38, WW 30 °C = 1.08, TOU-A 30 °C = 0.89; mean H2 estimates between 5 and 7 dai: WW 27 °C = 0.77, TOU-A 27 °C = 0.37, WW 30 °C = 0.74, TOU-A 30 °C = 0.35; Aoun et al., 2017). This may be explained by the ab-sence in the TOU-A population of fully resistant accessions at 27 °C, which is consistent with the absence of any association peak located around the RPS4/RRS1-R locus on chromosome V (Figure 2). By con-trast, this locus was detected as the major association peak at 27 °C in a set of worldwide accessions (Aoun et al., 2017).
Given that most of the A. thaliana natural populations located in France are genetically diverse (Le Corre, 2005; Platt et al., 2010; Brachi et al., 2013; Frachon et al., 2018; Frachon et al., 2019), it would be interesting to investigate the level of genetic variation of QDR to R. solanacearum GMI1000 (or to other strains) within those popula-tions. This would provide valuable information on the local dynamics of QDR to a bacterial pathogen in A. thaliana at the metapopulation level (Ding et al., 2007; Vetter et al., 2012; Karasov et al., 2014; Roux and Bergelson, 2016).
3.2 | Complex genetic architecture of QDR to
R. solanacearum at 27 and 30 °C
Combining GWA mapping related mixed models and genome-wide local score analysis increases the probability of discovering minor QTLs with additive effects (Fariello et al., 2017; Bonhomme et al., 2019). This is also well exemplified here with a more detailed charac-terization of the genetic determinants responsible for QDR to R. sola-nacearum. Because no top SNPs were common to both temperature treatments, our data illustrate how only a weak temperature in-crease of 3 °C can drastically affect the genetic architecture of QDR to R. solanacearum. We next evaluated the effect of the geographic
F I G U R E 5 Linkage disequilibrium (LD) patterns among the
14 quantitative trait loci (QTLs) with a Lindley process above 10. (a) Graphical display of the LD matrix. (b) Weighted network visualization of the LD matrix (qgraph library implemented in the R environment). (c) Relationship between disease index and the cumulative number of resistant R alleles at the seven QTLs of the first group of epistatic QTLs. Dots correspond to the kinship-adjusted genotypic values of the TOU-A accessions. A total amount of 47.1% of disease index variation was explained by the cumulative number of resistance alleles at the seven QTLs
T A B LE 2 Li st o f c an di da te g en es u nd er ly in g t he 1 4 q ua nt ita tiv e t ra it l oc i ( Q TL s) w ith a L in dl ey p ro ce ss v al ue a bov e 1 0 a t 2 7 a nd 3 0° C Tem per at ur e (° C ) dai Q TL i d Ch ro mo so me B ai t S N P p value G ene G ene d esc rip tio n 27 5 Q TL 1 I 22 1 80 1 12 1. 20 × 10 −6 At 1g6 01 40 TR EH A LO SE P H O SP H AT E S YN TH A SE 1 0 7 Q TL 2 II 8 2 53 7 43 1. 27 × 10 −5 At 2g 19 05 0 G D SL -lik e lipa se /a cy lh yd ro la se s up er fa mil y pr ot ein 30 4 Q TL 3 IV 6 4 63 3 10 1. 63 × 10 −7 At 4g 1044 0 S-adeno sy l-L -me th io ni ne -dep en den t me th yl tr an sf er as es su pe rf ami ly p ro tein At4 g1 045 0 Ri bo so m al p ro te in L 6 f am ily 7 Q TL4 I 5 0 82 7 90 2. 30 × 10 −8 At 1g 14 75 0 SO LO D A N C ER S 7 Q TL 5 I 23 0 21 2 61 2. 28 × 10 −8 At1 g6 23 05 C or e-2/ I-br an ch in g β -1 ,6 -N -a ce ty lgl uc os amin ylt ra ns fe ra se fa mi ly pr ot ei n At 1g 62 33 0 O -f uc os ylt ra ns fe ra se fa mi ly p ro tein 7 Q TL 6 I 23 7 42 3 19 8. 08 × 10 −7 At 1g6 39 80 D 11 1/ G -pa tc h do m ain -c on tainin g pr ot ein 7 Q TL 7A I 26 6 55 5 20 1. 31 × 10 −7 At 1g 70 70 0 JA SM O N AT E-ZI M -D O M A IN P RO TE IN 9 7 Q TL7 B I 26 7 18 9 47 1. 07 × 10 −9 At 1g 70 86 0 Po ly ke tid e c yc la se /d ehy dr as e a nd l ip id t ra ns po rt s up er fa m ily pr ot ei n 7 Q TL 8 I 29 3 19 0 94 4. 28 × 10 −6 At 1g 77 99 0 SU LP H AT E T R A N SP O RT ER 2 7 Q TL9 II 71 8 4 24 1.1 5 × 10 −7 At 2g 02 620 Cy st ein e/ his tidin e-ric h C1 d om ain fa mil y pr ot ein 7 Q TL 10 II 13 13 4 1 29 1. 51 × 10 −5 At 2g 308 00 H EL IC A SE I N V A SC U LA R T IS SU E A N D T A PE TU M At 2g 308 10 G ib be re llin -r eg ula te d f ami ly p ro tein At 2g3 08 20 A spa rt yl /g lu ta m yl -t RN A (A sn /G ln ) a m id ot ra ns fe ra se s ub un it At 2g 308 30 2-Ox og lu ta ra te (2 OG ) a nd F e( II) -dep en den t o xy gena se su pe rf amil y pr ot ein At 2g 30 840 2-O xo gl ut ar at e ( 2O G ) a nd F e( II) -dep en den t o xy gen as e su pe rf ami ly p ro tein 7 Q TL 11 IV 10 4 22 5 18 2. 21 × 10 −6 At 4g 19 03 0 N O D2 6-lik e i nt rin si c p ro te in 1 7 Q TL 12 A V 1 5 69 1 70 2. 41 × 10 −5 At 5g 052 90 EX PA N SI N A 2 7 Q TL 12 B V 1 5 96 2 41 5.9 3 × 10 −6 At 5g 05 39 0 LA CC A SE 1 2 Fo r e ac h Q TL , t he c an di da te g en es c or re sp on di ng t o t he t op s in gl e n uc le ot id e p ol ym or ph is m ( SN P) a nd t he f la nk in g g en e a re i n b ol d a nd n or m al t ex t, r es pe ct iv el y. d ai , d ay s a ft er i no cu la tio n.
scale on the genetic architecture of this QDR by applying a genome-wide local score approach to the EMMAX results previously obtained on a set of 176 worldwide A. thaliana accessions (Aoun et al., 2017). No genomic regions containing top SNPs were shared between the local and worldwide scales (Data S1). Interestingly, similar results were obtained in a study investigating the genetic determinants of flowering time scored on both local and worldwide mapping popula-tions of A. thaliana in two environmental condipopula-tions simulating two seasonal germination cohorts (Brachi et al., 2013). The genetic archi-tecture of flowering was highly dependent on both the geographi-cal sgeographi-cale and the considered season (Brachi et al., 2013). Together, the data obtained from various phenotypic traits reinforce the need to account for the geographical scale of phenotypic variation when choosing accession panels for GWAS (Bergelson and Roux, 2010). Consequently, this would help to get a better view of the genetic architecture flexibility of phenotypic traits.
Theoretical predictions suggest that phenotypic changes in onto-genetic time (typically time-to-event or time-to-failure traits such as flowering time or death time) are often driven by the temporal reg-ulation of QTLs (Johannes, 2007). In this study, all the 14 top QTLs control QDR to R. solanacearum GMI1000 in a playful manner at both 27 and 30°C, suggesting that disease progression to R. solanacearum highly depends on the time specificity of the genetic effects. At 30°C, disease progression also resulted from a complex genetic net-work of interacting loci. The more complex genetic architecture ob-served at 30°C suggests that under heat stress, A. thaliana responses to R. solanacearum involve a specific and complex network of mecha-nisms associated with the time specificity of the genetic effects. Few studies analysed the specificities of plant responses to individual
or combined stresses, and mostly through transcriptome analyses. Interestingly, it turns out that transcriptional responses of plants to combined stresses are unique and cannot be predicted from that of individual stress (Atkinson and Urwin, 2012; Suzuki et al., 2014; Pandey et al., 2015). In addition, combined stresses induce a major transcriptional reprogramming characterized by the regulation of the expression of a greater number of genes than observed with individ-ual stresses (Rasmussen et al., 2013; Suzuki et al., 2014). For instance, more Arabidopsis genes were differentially expressed when nema-tode infection was combined with water stress compared to plants only subjected to nematode infection (Atkinson et al., 2013). Similar observations were made in other pathosystems, including A. thaliana exposed to the simultaneous application of virus and heat or virus and drought (Prasch and Sonnewald, 2013; Pandey et al., 2015). This may indicate that the more complex the environment is, the more the plants establish a response with a polygenetic architecture involving different genetic pathways.
Epistatic networks involving long-distance LD among physically unlinked loci were reported to represent the main fraction of pheno-typic variance for herbivore resistance in A. thaliana at a worldwide scale (Brachi et al., 2015), yeast growth (Forsberg et al., 2017), or body weight and abdominal fat content in chicken (Carlborg et al., 2006; Li et al., 2013). While complex epistatic relationships among QTLs, in-cluding higher-order epistasis, may be therefore more frequent than anticipated (Carlborg and Haley, 2004; Roux et al., 2005; Pettersson et al., 2011), the functional validation of epistatic QTLs remains chal-lenging but feasible if we consider a multi-CRISPR-Cas9 approach to create double, triple, quadruple, etc. mutants. Nonetheless, it would be interesting to determine whether such an epistatic network is
F I G U R E 6 Effects of knockdown of SDS expression on the dynamics of disease symptoms after inoculation with the
Ralstonia solanacearum GMI1000 strain in two genetic backgrounds at 27 and 30 °C. Dynamics of disease symptoms in Col-0 and sds-2 mutant at 27 °C (a) and 30 °C (b). Dynamics of disease symptoms in Ws-4 and sds-3 mutant at 27 °C (c) and 30 °C (d). Least-square means ± SE of the LS means from three independent inoculations (n = 72 plants per genetic line × temperature combination. Symbols *, **, and *** denote significant difference observed between each wild-type background and its corresponding mutant at p < .05, p < .01, and p <.001, respectively. Coloured stars indicate significant differences after a false-discovery rate correction. DI, disease index; dai, days after inoculation
restricted to the TOU-A population by estimating LD between these five QTLs in other local highly polymorphic populations or at a larger geographical scale.
However, we should stress that some limitations in this study pre-clude a full description and understanding of the epistatic network underlying QDR to R. solanacearum. First, in contrast to traditional mapping populations such as F2 populations or RILs, the number of accessions among the haplotypes expected between two (or more) epistatic QTLs was clearly unbalanced in the TOU-A population. While it may reflect the maintenance of haplotypes with extreme pheno-types (i.e., susceptible versus resistant) by selective processes (Brachi et al., 2015), it precludes testing with sufficient power the magni-tude and type of epistasis. Secondly, epistatic relationships were only tested on QTLs with additive effects that were first identified by com-bining a GWA mapping approach with a local score analysis. Although computationally intensive, a complementary step will be to test the significance of all pairwise interactions among the 981,617 SNPs used in this study, which will require controlling the individual and joint ef-fect of population structure on both SNPs tested in interaction (Wang et al., 2018).
3.3 | Various molecular functions are involved in
QDR to the GMI1000 strain at 30°C
Consistent with the molecular functions of previously cloned QDR genes (Roux et al., 2014), the nature of most candidate genes under-lying the 14 major QTLs identified here is quite diverse and they do not correspond to typical resistance genes encoding NLRs. Indeed, unlike a previous GWAS performed on worldwide A. thaliana ac-cessions that led to the detection of the RPS4/RRS1-R NLR locus as the main genetic determinant for full resistance to GMI1000 at 27°C (Aoun et al., 2017), the two main QTLs identified at 27°C in the local TOU-A population do not correspond to any NLR genes. For QTL1, the top SNPs fall in TREHALOSE PHOSPHATE SYNTHASE 10 (At1g60140), suggesting that the regulation of tre-halose-6-phosphate synthesis participates in the plant response. This is consistent with previous data showing that the production of this metabolite by the R. solanacearum effector RipTPS plays an important role in pathogen virulence (Poueymiro et al., 2014). For QTL2, the top SNPs fall in the At2g19050 gene encoding a GDSL-like lipase/acylhydrolase superfamily protein. Interestingly, overexpression of GLIP1 that also belongs to the Arabidopsis GDSL LIPASE-LIKE gene family was shown to confer enhanced resistance to several pathogens, including Alternaria brassicicola, Erwinia caro-tovora and P. syringae) (Kwon et al., 2009). Therefore, these proteins might also play a role in plant immunity against R. solanacearum.
The molecular functions of the candidate genes underly-ing the 12 major QTLs detected at 30 °C are even more diverse. Interestingly, these functions may reflect different plant responses to face virulence strategies developed by the bacteria to colonize plant tissues and promote its multiplication within the xylem ves-sels. For instance, candidate genes underlying QTL7A and QTL10 are
involved in the synthesis or signalling of hormones that may contrib-ute positively to pathogen resistance and in plant response to com-bined biotic and abiotic stress. In particular, JA is known to interfere with GA signalling through the degradation of transcriptional repres-sors such as JAZ9 (the candidate gene underlying QTL7A) to balance plant defence response and growth (Yang et al., 2012).
From 4 to 7 dai, QTL4 was detected with increasing significance on chromosome I. The corresponding candidate gene, SDS, encodes an atypical meiotic cyclin-like protein related to A- and B-type cyc-lins, previously described as being required for DNA double-strand break (DSB) repair (Azumi et al., 2002; De Muyt et al., 2009). To our knowledge, SDS has never been associated with plant disease susceptibility. Interestingly, two allelic null sds mutants were found to be more resistant at both 27 and 30 °C to GMI1000, albeit the allelic effect was different between the two genetic backgrounds. The functional validation of SDS as a susceptibility gene represents the first demonstration of its involvement in plant defence response to a bacterial pathogen under heat stress. It is noteworthy that (a) SDS acts together with CYCB3;1 in suppressing unscheduled cell wall synthesis (Bulankova et al., 2013); and (b) the two candidate genes underlying QTL12A and QTL12B encode, respectively, pro-teins involved in cell wall and lignin polymerization. Two cyclin-L type proteins, MOS12 (Modifier of SNC1, 12) and MOS4-associated complex (Modifier of SNC1, 4), have also been shown to participate in the alternative splicing of SNC1 and RPS4 genes, thereby enabling the fine-tuning of NLR gene expression (Xu et al., 2012). As several NLR genes have been described to be alternatively spliced without knowing the regulatory mechanism (Xu et al., 2012), it is tempting to hypothesize that SDS would participate in the regulation of NLR functions under combined R. solanacearum and elevated tempera-ture conditions through the production of splicing variants. Because the top SNPs are located in the promoter region of SDS, the next step to decipher the underlying molecular mechanisms would be to investigate the natural variation of SDS expression in the TOU-A population and its link to the QDR.
4 | EXPERIMENTAL PROCEDURES
4.1 | Bacterial strain, plant material, and growth
conditions
The wild-type R. solanacearum GMI1000 strain was grown on com-plete bacto glucose (BG) agar as previously described (Plener et al., 2010). GWAS was performed using 192 whole-genome sequenced natural accessions of the TOU-A population (France, Burgundy, 46°38ʹ57.302ʺN, 04°07ʹ16.892ʺE; Frachon et al., 2017) (Table S1). Around five seeds of each accession were directly sown on Jiffy pots (Jiffy Products International AS) and left for 48 hr at 4 °C for stratification. Afterwards, plants were grown under controlled conditions for 4 weeks (22 °C, 70% relative humidity [RH], 9 hr of light) before inoculation. The two homozygous sds-2 and sds-3 mu-tants (SAIL and FAG105 T-DNA insertion mumu-tants in Columbia-0
[Col-0] and Wassilewskija [Ws-4] genetic backgrounds, respec-tively) were kindly provided by Raphaël Mercier (INRA, Versailles, France) (De Muyt et al., 2009). An altered expression of SDS in these two mutants was confirmed in De Muyt et al. (2009). The two null mutants were grown as described above.
4.2 | Plant inoculation and phenotyping
Four-week-old plants were root-inoculated with the R. solan-acearum GMI1000. The R. solansolan-acearum GMI1000 reference strain was grown in complete BG agar, supplemented with 6 ml of glucose (20%) and 1 ml of triphenyltetrazolium chloride (1%), and incubated at 28 °C for 48 hr then left at room temperature for 24 hr. One day before inoculation, one colony was grown in liquid BG medium and grown overnight at 28 °C under shaking. Plants were inocu-lated with a bacterial suspension at OD600 nm between 0.8 and 1. Before inoculation, roots were cut with scissors 1 cm from the bot-tom of the Jiffy pot (Deslandes et al., 1998). This method gives the bacteria direct access to the xylem vessels. During inoculation, plants were soaked in a bacterial suspension at 107 bacteria/ml for 15 min. Inoculated plants were incubated in growth chambers at 27 or 30 °C (75% RH, 12 hr light, 100 μmol⋅m−2⋅s−1). Disease symp-toms were scored daily from 3 to 9 dai using a disease index scale from 0 to 4 as previously described (Deslandes et al., 1998) with the scores from 0 to 4 corresponding to healthy and fully wilted plants, respectively.
4.3 | Natural variation of QDR in the
TOU-A population
4.3.1 | Experimental design
For each temperature treatment, 624 plants were used and arranged by following a randomized complete block design (RCBD) of three temporal experimental blocks. Each block was represented by two trays of 104 positions, corresponding to one replicate per accession (n = 192 accessions) and the susceptible Col-0 accession was placed in the same three positions within each tray (n = 6). In each block, the remaining 10 positions in the trays were kept empty. Note that plants of the third block were not scored at 9 dai.
4.3.2 | Statistical analysis
For each temperature treatment, a mixed model (MIXED procedure in SAS v. 9.4; SAS Institute Inc.) was used to explore the natural ge-netic variation of the disease index at each time point of phenotyp-ing, as follows:
where µ is the overall mean of the phenotypic data, “block” accounts for differences in microenvironmental conditions between the three experimental blocks, “accession” corresponds to the genetic differ-ences among the TOU-A natural accessions, covCol is a covariate ac-counting for tray effects within blocks (phenotypic mean of the three Col-0 replicates per tray was used as a covariate), and “ε” is the residual term. The factor “block” was considered as a fixed factor and the factor “accession” as a random factor. The significance of the random effect was determined by likelihood ratio tests of model with and without this effect. Residuals were normally distributed so no transformation was applied on raw phenotypic data. For GWA mapping analyses, we used best linear unbiased predictors (BLUPs) obtained for each natural accession. Because A. thaliana is a highly selfing species (Platt et al., 2010), BLUPs correspond to genotypic values. Using a formula adapted from Gallais (1990), broad-sense heritabilities (H2) at each time point of phenotyping were estimated from the variance component estimates of the “block” and “accession” terms obtained with the VARCOMP pro-cedure in SAS v. 9.4 (SAS Institute Inc.).
4.3.3 | GWA mapping with local score analysis
To fine map the genomic regions with additive effects associated with natural disease index variation at each time of phenotyping for each temperature treatment, a mixed model implemented in the software EMMAX was adopted (Efficient Mixed-Model Association eXpedited; Kang et al., 2010). To control for the effect of population structure, we included as a covariate an identity-by-state kinship matrix K based on the 1,902,592 SNPs identified in the TOU-A population (Frachon et al., 2017). Because rare alleles increase the rate of false positives when in-cluded in mixed models, we considered a threshold of minor allele rela-tive frequency (MARF) >7% and ended up with 981,617 SNPs (Brachi et al., 2010; Kang et al., 2010). As previously described in Frachon et al. (2017), a threshold of 7% corresponds to the MARF value above which the p value distribution obtained from the mixed model is not depend-ent on MARF values in the TOU-A population.Thereafter, we implemented a local score approach on the set of p values provided by EMMAX. The local score allows detec-tion of significant genomic segments by accumulating the statis-tical signals from contiguous markers such as SNPs (Fariello et al., 2017). In a given QTL region, the association signal, through the p values, will cumulate locally due to LD between SNPs, which will then increase the local score (Bonhomme et al., 2019). Briefly, a sequence of scores is calculated along the chromosome as Xi = −
log10(pi) − ξ, where pi is the p value of marker i and ξ is a tuning parameter with an optimal value that can be fixed at 2 or 3 in a GWAS context (Bonhomme et al., 2019). Then, finding segments that accumulate strong signals is equivalent to finding peaks along a Lindley process defined as hi = max(0, hi−1 + Xi) along the
chro-mosome, with h0 = 0. Significant SNP–phenotype associations were identified by estimating a chromosome-wide significance threshold for each chromosome (Bonhomme et al., 2019).
(1)
4.3.4 | Detecting QTL epistasis
In order to detect epistatic interactions among our set of 14 top QTLs identified with additive effects by combining a GWA mapping ap-proach with a local score analysis, we followed the procedure adopted in Brachi et al. (2015). We first identified within each QTL region the SNP with the highest association score estimated by EMMAX, hereaf-ter named bait top SNP. For each of the 14 QTLs, we then computed LD estimates between the bait top SNP and all the other SNPs in the TOU-A population. LD between two biallelic (homozygous) SNPs was calculated using the absolute value of r statistic (correlation coeffi-cient) between two SNP genotype vectors. For each QTL, we obtained a distribution of LD estimates between the bait top SNP and the other 981,616 SNPs of the population (MARF > 7%). In order to exclude strong LD values due to physical proximity, SNPs located in a 100 kb window surrounding a bait top SNP were not included in the calcula-tion. To estimate whether the bait top SNP of a given QTL (i.e., focal bait top SNP) was significantly in LD with the bait top SNPs of the remaining 13 QTLs, we estimated in the LD distribution (conditional on each focal bait top SNP) the quantile q for each bait top SNP of the 13 QTLs. To be conservative, an LD estimate between a focal bait top SNP and another bait top SNP was declared significant if (1 − q) < .01.
4.3.5 | Estimates of allelic effect
To display the allelic effect of the bait SNPs after controlling for the effects of population structure, BLUPs estimated from model (1) were adjusted by fitting them with a kinship matrix. Kinship-adjusted BLUPs were computed under the R environment 3.6.1 (R_Core_Team, 2019). In order to avoid pseudoreplication due to the presence of SNPs in stretches of LD, we first pruned the SNP data set with the snpgdspLD command using the following parameters: ld.threshold = 0.8, slide.max.bp = 500, maf = 0.07 (“gdsfmt” and “SNPRelate” packages), leaving 365,952 SNPs for the estimation of the kinship matrix. The kinship matrix was then estimated using the popkin function (allowing missing data in the SNP matrix) in the pop-kin package, with the subpopulation vector set to NULL. Because the resulting matrix was not positive semi-definite, the function make.positive.definite() from the package lqmm was used. Finally, the kinship-adjusted BLUPs were calculated with the function kin. blup from package rrBLUP. Keeping the notations from model (1), the parameters were: accession as geno, disease index as pheno, the above-mentioned kinship matrix as K, GAUSS = F, indicating that the genotypes are not independent and follow G = K VG, block as fixed effect and covCol as covariate. The kinship-adjusted BLUPs were then extracted using the command $pred.
4.4 | Analysis of the SDS candidate gene
For each temperature treatment, an experiment of 288 plants was set up according to a RCBD of three temporal experimental blocks.
Each block was represented by one tray of 96 positions, correspond-ing to 24 replicates of each genotype, that is, the sds-2 and sds-3 mutants with their corresponding wild-type background Col-0 and Ws-4, respectively.
For each temperature treatment, we tested whether each null mutant differs from its corresponding wild-type background along the infection stages by using the following model (MIXED procedure in SASv. 9.4; SAS Institute Inc.):
where µ is the overall mean of the phenotypic data, “block” accounts for differences in microenvironmental conditions between the three experimental blocks, “genotype” corresponds to the genetic differ-ences between the T-DNA mutant and its corresponding wild-type background, “block × genotype” accounts for variation between geno-type differences among blocks, and “ε” is the residual term. All factors were considered as fixed.
ACKNOWLEDGEMENTS
We are grateful to Raphaël Mercier for providing T-DNA insertion mu-tant seeds (INRA, Versailles, France). N.A. benefited from a PhD grant co-financed by the Occitanie Regional Council and the INRA Plant Health and Environment Division (SPE). H.D. was funded by a grant from SYNGENTA seeds (Sarrians, France). L.B. benefited from a PhD grant financed by the ANR project DeCoD (ANR-16-CE20-0017-01). This study was performed at the LIPM belonging to the Laboratoire d'Excellence (LABEX) entitled TULIP (ANR-10-LABX-41).
AUTHOR CONTRIBUTIONS
R.B. and F.R. supervised the project. N.A., R.B., and F.R. designed the experiments. N.A. conducted the phenotyping experiments. N.A. and F.R. analysed the phenotypic traits. F.R. performed the GWA mapping. M.B. performed the genome-wide local score analysis. L.B. performed the LD analyses. H.D. estimated the allelic effects of the QTLs. N.A., L.D., R.B., and F.R. wrote the manuscript. All authors contributed to the revisions.
DATA AVAIL ABILIT Y STATEMENT
The data that support the findings of this study are available from the corresponding author upon reasonable request.
ORCID
Nathalie Aoun https://orcid.org/0000-0002-9176-9805
Léa Boyrie https://orcid.org/0000-0002-9357-5959
Maxime Bonhomme https://orcid.org/0000-0002-1210-4777
Laurent Deslandes https://orcid.org/0000-0003-1974-5144
Richard Berthomé https://orcid.org/0000-0003-4781-6210
Fabrice Roux https://orcid.org/0000-0001-8059-5638
REFERENCES
Aoun, N., Tauleigne, L., Lonjon, F., Deslandes, L., Vailleau, F., Roux, F. et al. (2017) Quantitative disease resistance under elevated temperature:
(2)
genetic basis of new resistance mechanisms to Ralstonia
sola-nacearum. Frontiers in Plant Science, 8, 1387.
Atkinson, N.J. and Urwin, P.E. (2012) The interaction of plant biotic and abiotic stresses: from genes to the field. Journal of Experimental
Botany, 63, 3523–3543.
Atkinson, N.J., Lilley, C.J. and Urwin, P.E. (2013) Identification of genes involved in the response of Arabidopsis to simultaneous biotic and abiotic stresses. Plant Physiology, 162, 2028–2041.
Azumi, Y., Liu, D., Zhao, D., Li, W., Wang, G., Hu, Y. et al. (2002) Homolog interaction during meiotic prophase I in Arabidopsis requires the
SOLO DANCERS gene encoding a novel cyclin-like protein. The EMBO Journal, 21, 3081–3095.
Baron, E., Richirt, J., Villoutreix, R., Amsellem, L. and Roux, F. (2015) The genetics of intra- and interspecific competitive response and effect in a local population of an annual plant species. Functional Ecology, 29, 1361–1370.
Birker, D., Heidrich, K., Takahara, H., Narusaka, M., Deslandes, L., Narusaka, Y., et al. (2009) A locus conferring resistance to Colletotrichum higginsianum is shared by four geographically dis-tinct Arabidopsis accessions. The Plant Journal, 60, 602–613. Bita, C.E. and Gerats, T. (2013) Plant tolerance to high temperature in
a changing environment: scientific fundamentals and production of heat stress-tolerant crops. Frontiers in Plant Science, 4, 273.
Brachi, B., Faure, N., Bergelson, J., Cuguen, J. and Roux, F. (2013) Genome-wide association mapping of flowering time in Arabidopsis thaliana in nature: genetics for underlying components and reaction norms across two successive years. Acta Botanica Gallica, 160, 205–219.
Brachi, B., Villoutreix, R., Faure, N., Hautekèete, N., Piquot, Y., Pauwels, M. et al. (2010) Investigation of the geographical scale of adaptive phenological variation and its underlying genetic bases in Arabidopsis
thaliana. Molecular Ecology, 22, 4222–4240.
Brachi, B., Meyer, C.G., Villoutreix, R., Platt, A., Morton, T.C., Roux, F.
et al. (2015) Coselected genes determine adaptive variation in
herbi-vore resistance throughout the native range of Arabidopsis thaliana.
Proceedings of the National Academy of Sciences of the United States of America, 112, 4032–4037.
Bebber, D.P., Ramotowski, M.A.T. and Gurr, S.J. (2013) Crop pests and pathogens move polewards in a warming world. Nature Climate
Change, 3, 985–988.
Bergelson, J. and Roux, F. (2010) Towards identifying genes underlying ecologically relevant traits in Arabidopsis thaliana. Nature Reviews
Genetics, 11, 867–879.
Bonhomme, M., Fariello, M.I., Navier, H., Hajri, A., Badis, Y., Miteul, H.
et al. (2019) A local score approach improves GWAS resolution and
detects minor QTL: application to Medicago truncatula quantita-tive disease resistance to multiple Aphanomyces euteiches isolates.
Heredity, 123, 517–531.
Bulankova, P., Akimcheva, S., Fellner, N. and Riha, K. (2013) Identification of Arabidopsis meiotic cyclins reveals functional diversification among plant cyclin genes. PLoS Genetics, 9, e1003508.
Carlborg, O., Jacobsson, L., Ahgren, P., Siegel, P. and Andersson, L. (2006) Epistasis and the release of genetic variation during long-term selec-tion. Nature Genetics, 38, 418–420.
Carlborg, H.O. and Haley, C.S. (2004) Epistasis: too often neglected in complex trait studies? Nature Reviews Genetics, 5, 618–625. Cheng, C., Gao, X., Feng, B., Sheen, J., Shan, L. and He, P. (2013) Plant
immune response to pathogens differs with changing temperatures.
Nature Communications, 4, 2530.
Cook, D.E., Mesarich, C.H. and Thomma, B.P.H.J. (2015) Understanding plant immunity as a surveillance system to detect invasion. Annual
Review of Phytopathology, 53, 541–563.
De Muyt, A., Pereira, L., Vezon, D., Chelysheva, L., Gendrot, G., Chambon, A. et al. (2009) A high throughput genetic screen identifies new early meiotic recombination functions in Arabidopsis thaliana. PLoS
Genetics, 5, e1000654.
Debieu, M., Huard-Chauveau, C., Genissel, A., Roux, F. and Roby, D. (2016) Quantitative disease resistance to the bacterial pathogen
Xanthomonas campestris involves an Arabidopsis immune receptor
pair and a gene of unknown function. Molecular Plant Pathology, 17, 510–520.
Deslandes, L., Olivier, J., Theulieres, F., Hirsch, J., Feng, D.X., Bittner-Eddy, P. et al. (2002) Resistance to Ralstonia solanacearum in Arabidopsis thaliana is conferred by the recessive RRS1-R gene, a member of a novel family of resistance genes. Proceedings of the
National Academy of Sciences of the United States of America, 99,
2404–2409.
Deslandes, L., Pileur, F., Liaubet, L., Camut, S., Can, C., Williams, K.
et al. (1998) Genetic characterization of RRS1, a recessive locus in Arabidopsis thaliana that confers resistance to the bacterial
soil-borne pathogen Ralstonia solanacearum. Molecular Plant-Microbe
Interactions, 11, 659–667.
Ding, J., Zhang, W., Jing, Z., Chen, J.-Q. and Tian, D. (2007) Unique pat-tern of R-gene variation within populations in Arabidopsis. Molecular
Genetics and Genomics, 277, 619–629.
Elphinstone, J.G. (2005) The Current Bacterial Wilt Situation: A Global
Overview. St. Paul, MN: APS Press.
Evans, N., Baierl, A., Semenov, M.A., Gladders, P. and Fitt, B.D. (2008) Range and severity of a plant disease increased by global warming.
Journal of the Royal Society Interface, 5, 525–531.
Fariello, M.I., Boitard, S., Mercier, S., Robelin, D., Faraut, T., Arnould, C.
et al. (2017) Accounting for linkage disequilibrium in genome scans
for selection without individual genotypes: lhe local score approach.
Molecular Ecology, 26, 3700–3714.
Forsberg, S.K.G., Bloom, J.S., Sadhu, M.J., Kruglyak, L. and Carlborg, O. (2017) Accounting for genetic interactions improves modeling of in-dividual quantitative trait phenotypes in yeast. Nature Genetics, 49, 497–503.
Frachon, L., Bartoli, C., Carrère, S., Bouchez, O., Chaubet, A., Gautier, M. et al. (2018) A genomic map of climate adaptation in Arabidopsis
thaliana at a micro-geographic scale. Frontiers in Plant Science, 9,
967.
Frachon, L., Libourel, C., Villoutreix, R., Carrère, S., Glorieux, C., Huard-Chauveau, C. et al. (2017) Intermediate degrees of synergistic pleiot-ropy drive adaptive evolution in ecological time. Nature Ecology and
Evolution, 1, 1551–1561.
Frachon, L., Mayjonade, B., Bartoli, C., Hautekèete, N.-C. and Roux, F. (2019) Adaptation to plant communities across the genome of Arabidopsis thaliana. Molecular Biology and Evolution, 36, 1442–1456.
French, E., Kim, B.S. and Iyer-Pascuzzi, A.S. (2016) Mechanisms of quanti-tative disease resistance in plants. Seminars in Cell and Developmental
Biology, 56, 201–208.
Gallais, A. (1990) Théorie de la Sélection en Amélioration des Plantes. Paris: Masson.
Garrett, K.A., Dendy, S.P., Frank, E.E., Rouse, M.N. and Travers, S.E. (2006) Climate change effects on plant disease: genomes to ecosys-tems. Annual Review of Phytopathology, 44, 489–509.
Godiard, L., Sauviac, L., Torii, K.U., Grenon, O., Mangin, B., Grimsley, N.H.
et al. (2003) ERECTA, an LRR receptor-like kinase protein controlling
development pleiotropically affects resistance to bacterial wilt. The
Plant Journal, 36, 353–365.
Gray, S.B. and Brady, S.M. (2016) Plant developmental responses to cli-mate change. Developmental Biology, 419, 64–77.
Hatfield, J.L., Boote, K.J., Kimball, B.A., Ziska, L.H., Izaurralde, R.C., Ort, D. et al. (2011) Climate impacts on agriculture: implications for crop production. Agronomy Journal, 103, 351–370.
Huard-Chauveau, C., Perchepied, L., Debieu, M., Rivas, S., Kroj, T., Kars, I. et al. (2013) An atypical kinase under balancing selection confers broad-spectrum disease resistance in Arabidopsis. PLoS Genetics, 9, e1003766.